Abstract
Intra-lot and inter-lot variability in cosyntropin was detected in the DQS using Fourier transform near-infrared spectrometry. One vial of 12 sampled from Sandoz Lot0200062 appeared 6.9 SDs from the center of the rest of the vials, and another was 4.3 SDs away. Spectra of 102 vials from 7 lots in the library clustered in two groups (p=0.02).
Introduction
The University of Kentucky’s (UK) Drug Quality Study (DQS) was established in August of 2019 to engage in consumer-level quality assurance testing for drugs used within UK HealthCare’s pharmacies. DQS currently screens medications, using FT-NIR and Raman spectroscopy, for quality defects indicated by variability in absorbance peak intensities and locations. Following 15 months of continuous monitoring, DQS has assembled a spectral library containing medications typically used in an inpatient care setting. Statistical analyses using DQS’ spectral library can now be performed to identify potential intra-lot and inter-lot variability in medications under review. Using MedWatch, DQS reports its findings in an effort to hold manufacturers accountable for GMP requirements and to improve patient outcomes by exerting positive pressure on the pharmaceutical supply chain. At all levels, DQS staff are committed to achieving service excellence by pursuing compliance with the standards set forth by our patients and broad GxP requirements.
Drug Product
Cosyntropin is a prescription medication used for screening for adrenocortical insufficiency. Cosyntropin is a 1–24 corticotropin, a synthetic subunit of ACTH. It is an open-chain polypeptide containing, from the N terminus, the first 24 of the 39 amino acids of natural ACTH. Cosyntropin for Injection is provided as a sterile lyophilized powder in vials. The drug may be used alone or with other medications.
Issues
The DQS team has identified possible quality control issues (intra-lot and inter-lot variability) with cosyntropin 0.25 mg, manufactured by Sandoz, that may require further investigation.
The lot with intra-lot variability was Lot0200062 with an expiration date of 06/30/2023. The lots forming the spectral library were Lot0200052, Lot0200053, Lot0200055, Lot0200056, Lot0200057, Lot0200058, and Lot0200067.
Methods
FT-NIR (Fourier Transform Near-Infrared) Spectrometry
Using nondestructive analytical techniques, FT-NIR spectra were collected for inventory belonging to Lot0200062 as part of routine medication quality screening. A representative sample of 12 individual vials were selected for screening from Lot0200062 and noted to be stored under proper conditions, in their original packaging at ambient room temperature. FT-NIR spectra were collected noninvasively and nondestructively through the bottom of the vials using a Thermo Scientific Antaris II FT-NIR Analyzer (Waltham, MA, USA).
Multiplicative Scatter Correction (MSC)
Multiplicative scatter correction (MSC) is a widely used spectrometric normalization technique. Its purpose is to correct spectra in such a way that they are as close as possible to a reference spectrum, generally the mean of the data set, by changing the scale and the offset of the spectra (Isaksson, 1988).
BEST (Bootstrap Error-Adjusted Single-sample Technique)
The BEST calculates distances in multidimensional, asymmetric, nonparametric central 68% confidence intervals in spectral hyperspace (roughly equivalent to standard deviations(Dempsey, 1996). The BEST metric can be thought of as a “rubber yardstick” with a nail at the center (the mean). The stretch of the yardstick in one direction is therefore independent of the stretch in the other direction. This independence enables the BEST metric to describe odd shapes in spectral hyperspace (spectral point clusters that are not multivariate normal, such as the calibration spectra of many biological systems). BEST distances can be correlated to sample composition to produce a quantitative calibration, or simply used to identify similar regions in a spectral image. The BEST automatically detects samples and situations unlike any encountered in the original calibration, making it more accurate in chemical investigation than typical regression approaches to near-IR analysis. The BEST produces accurate distances even when the number of calibration samples is less than the number of wavelengths used in calibration, in contrast to other metrics that require matrix factorization. The BEST is much faster to calculate as well (O(n) instead of the O(n3) required by matrix factorization.)
Principal Components (PCs)
Principal component analysis is the process of computing the principal components of a dataset and using them to execute a change of basis (change of coordinate system) on the data, usually employing only the first few principal components and disregarding the rest (Joliffe, 2016). PCA is used in exploratory data analysis and in constructing predictive models. PCA is commonly utilized for dimensionality reduction by projecting each data point onto only the first few principal components to obtain lower-dimensional data while preserving as much of the original variation in the data as possible. The first principal component is the direction that maximizes the variance of the projected data. The second principal component is the direction of the largest variance orthogonal to the first principal component. Decomposition of the variance typically continues orthogonally in this manner until some residual variance criterion is met. Plots of PC scores help reveal underlying structure in data.
Subcluster Detection
In typical near-infrared multivariate statistical analyses, samples with similar spectra produce points that cluster in a certain region of spectral hyperspace. These dusters can vary significantly in shape and size due to variation in sample packings, particle-size distributions, component concentrations, and drift with time. These factors, when combined with discriminant analysis using simple distance metrics, produce a test in which a result that places a particular point inside a particular cluster does not necessarily mean that the point is actually a member of the cluster. Instead, the point may be a member of a new, slightly different cluster that overlaps the first. A new cluster can be created by factors like low-level contamination, moisture uptake, or instrumental drift. An extension added to part of the BEST, called FSOB (Fast Son of BEST) can be used to set nonparametric probability-density contours inside spectral clusters as well as outside (Lodder, 1988), and when multiple points begin to appear in a certain region of cluster-hyperspace the perturbation of these density contours can be detected at an assigned significance level using r values, and visualized using quantile-quantile (QQ) plots. The detection of unusual samples both within and beyond 3 SDs of the center of the training set is possible with this method. Within the ordinary 3 SD limit, however, multiple instances are needed to detect unusual samples with statistical significance.
Results and Discussion
Intralot Analysis
Upon examination of the FT-NIR spectra, significant absorbance peak location and intensity differences were observed in 1 of 12 vials screened after applying multiplicative signal correction to the spectra. In general, differences in absorbance peak location and intensity were observed at 4222, 4283, 4307, 4375, 4388, 4623, 4684, 4772, 5897, 5911, and 5930 cm−1. These findings can be observed in Figures 1 and 2.
Figure 1.
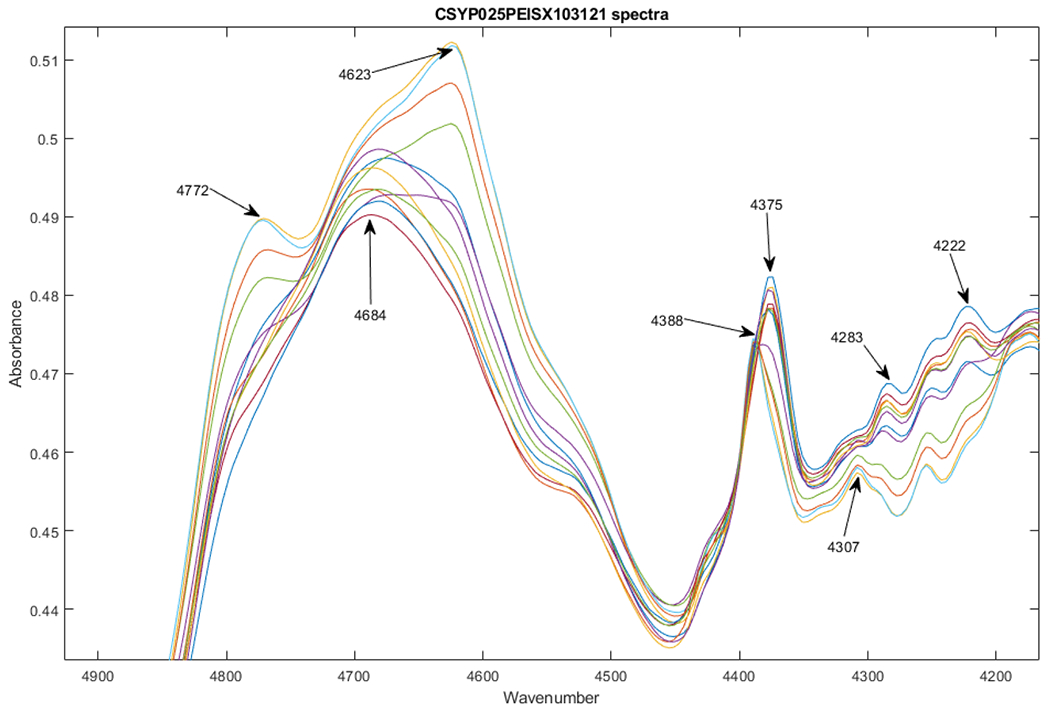
Zoomed spectra of 12 vials of cosyntropin from Lot0200062 after multiplicative scatter correction. The wavenumbers of major peak differences are shown on the spectra.
Figure 2.
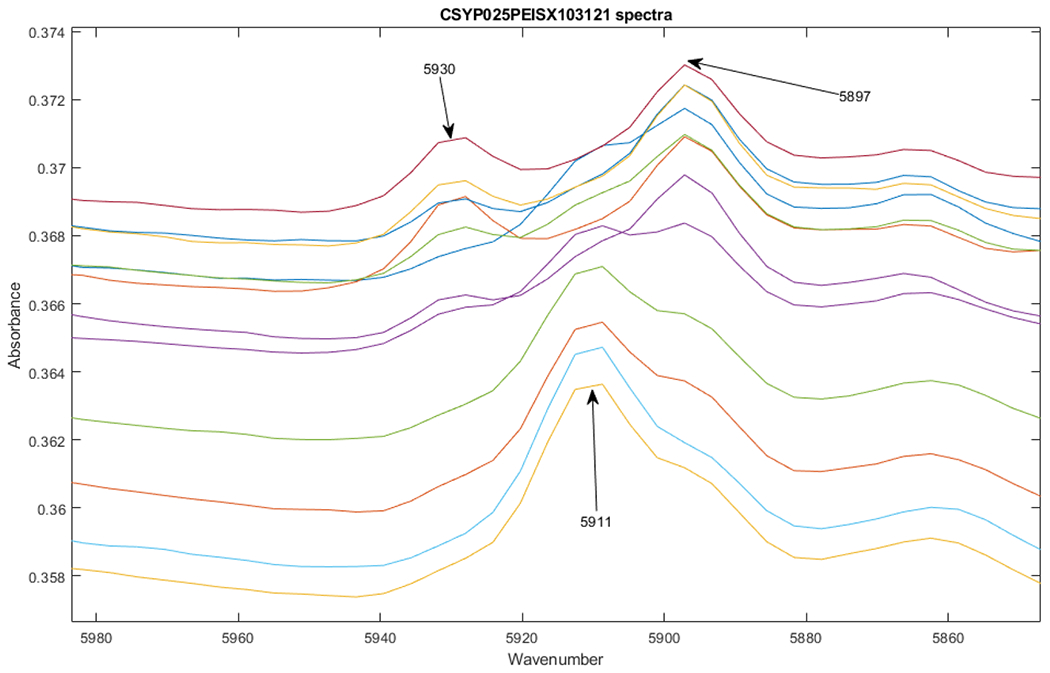
Zoomed spectra of 12 vials of cosyntropin from Lot0200062 after multiplicative scatter correction.
The observation of variability in absorbance peak intensity and absorbance peak location differences for vials within the lot may indicate the presence of product impurities and/or degradation products. Statistical analysis of the collected FT-NIR spectra suggested intra-lot variability. The two outlier vials on PCs 3 and 5 had a calculated distance of 6.9 and 4.3 multidimensional standard deviations (SDs) from the center of the 10 other vials with the same lot number (see Figure 3). Using a group membership range between 0 and 3 SDs, a standard deviation of 6.9 or 4.3 signals a potential quality control issue in Lot0200062.
Figure 3.
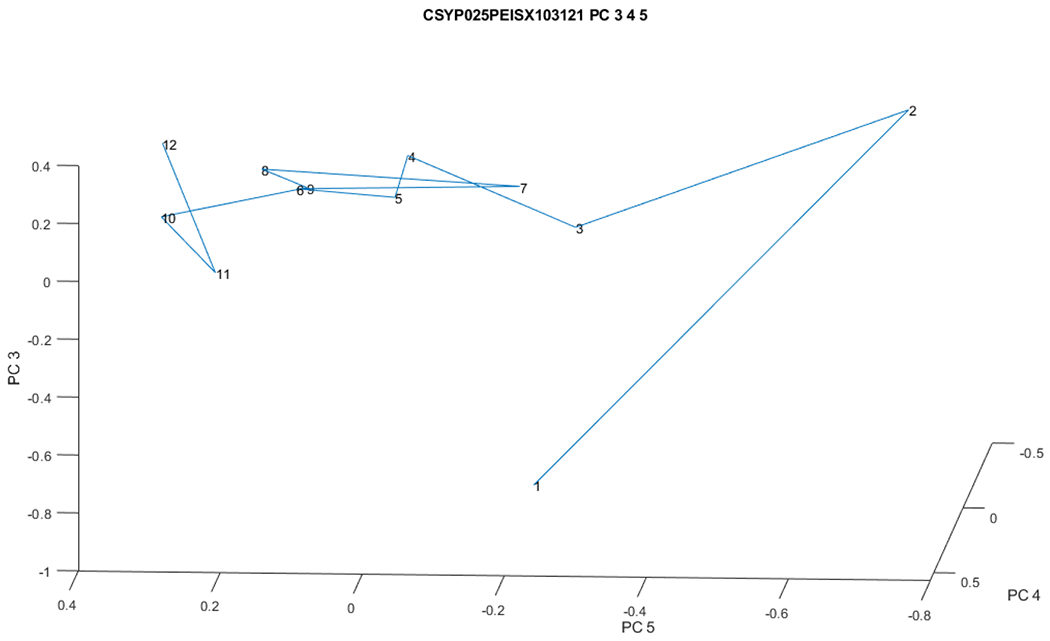
Vial 1 appears 6.9 BEST multidimensional SDs from the estimated center of Lot0200062, and vial 2 is 4.3 SDs away.
Inter-Lot Analysis
In addition, upon comparing Lot0200062 to other lots collected for our spectral library (Lot0200052, Lot0200053, Lot0200055, Lot0200056, Lot0200057, Lot0200058, and Lot0200067), it was discovered that there is inter-lot variability as well as intra-lot variability (see Figure 4). Figure 4 shows that 6 vials are displaced in the same direction from the main set of vials on PCs 2 and 3 (vials 2, 12, 58, 60, 64, and 67). This displacement is statistically significant (p=0.02) using the subcluster detection test (rlim = 0.98, rt=0.94), with the QQ plot shown in Figure 5. If the two groups of vials were identical, the QQ plot would show a straight line with a slope of 1 and an intercept of zero.
Figure 4.
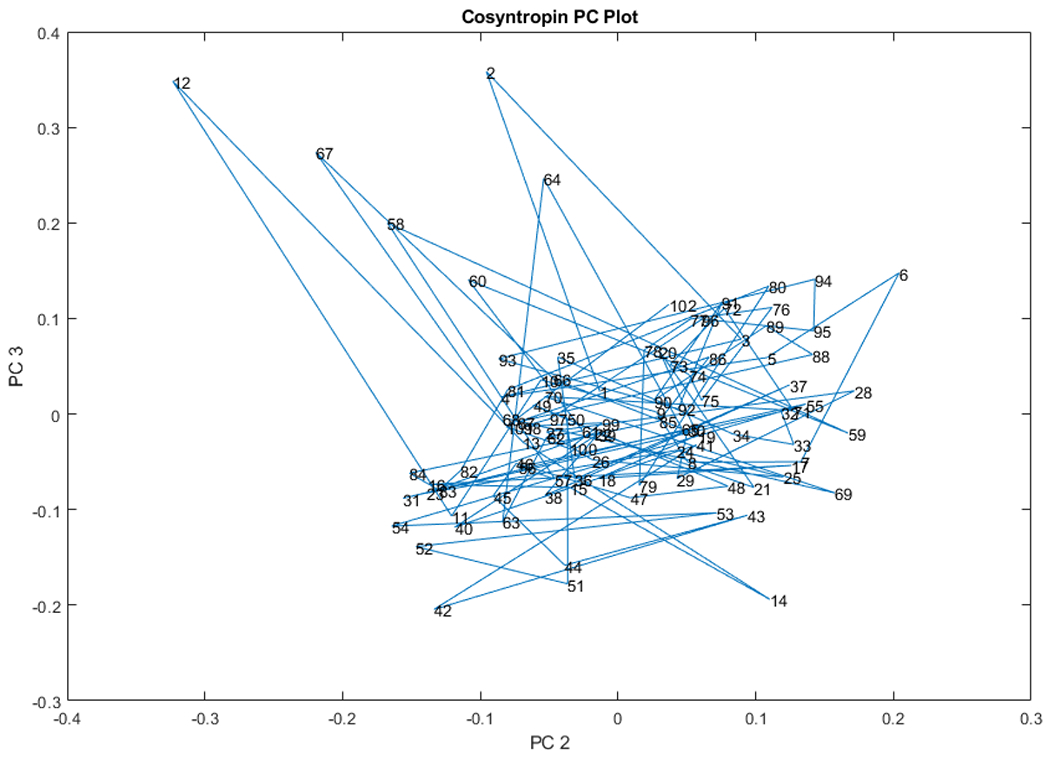
Spectra of the 102 vials in the spectral library cluster in 2 adjacent regions in hyperspace. The 6 outlier vials (vials 2, 12, 58, 60, 64, and 67) form a group that appears to have increased moisture content (see Figure 6).
Figure 5.
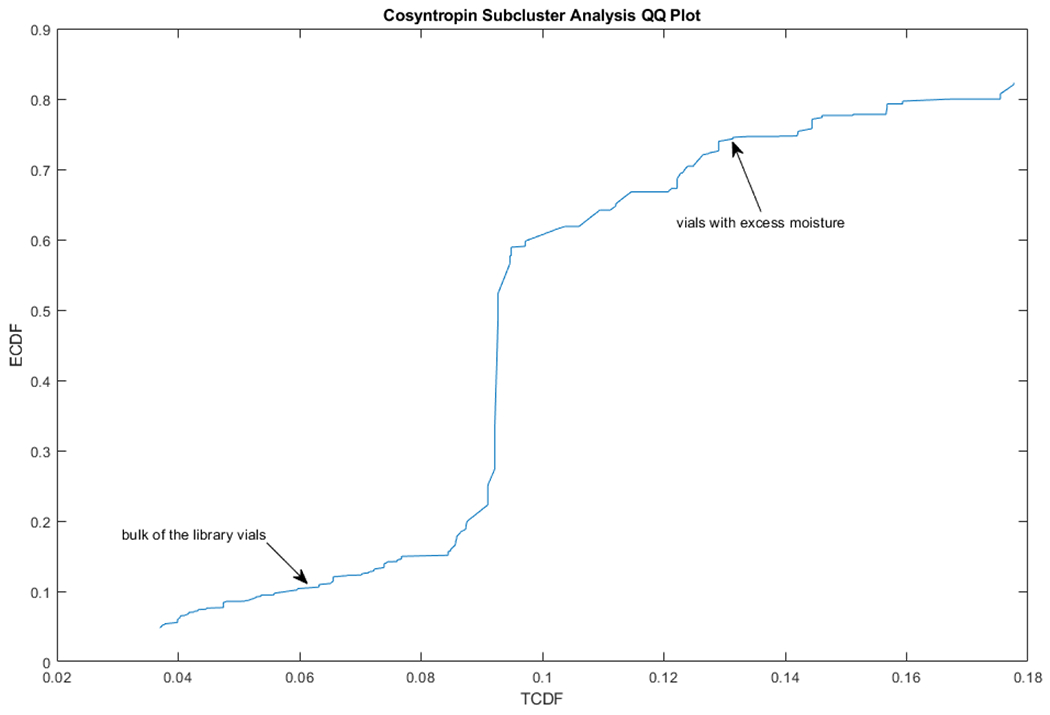
QQ plot from the subcluster detection method. This displacement between the groups of vials is statistically significant (p=0.02) using the subcluster detection test (rlim = 0.98, rt=0.94).
The displacement in the 6 vials along PCs 2 and 3 seems to be caused at least in part by excess moisture in the vials (see Figure 6, which shows a peak at 5150 cm-1 that the bulk of the vials do not have).
Figure 6.
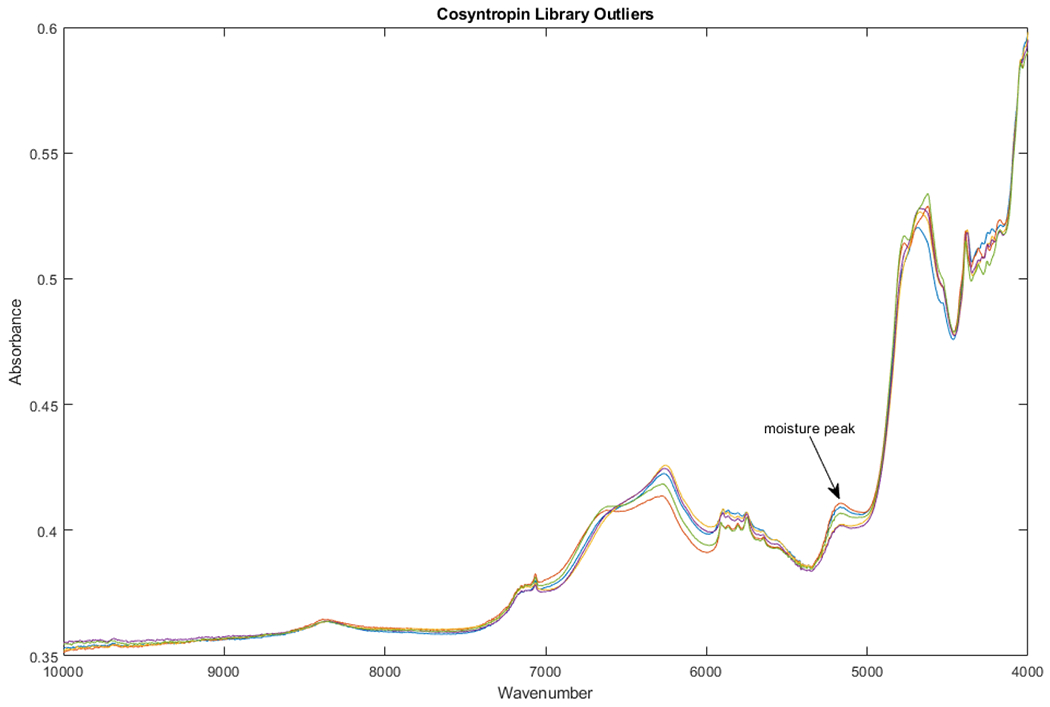
Spectra of the 6 outlier vials in Figure 4 show an apparent moisture peak at 5150 cm−1.
The presence of intra-lot and inter-lot variability may warrant further investigation of the product, cosyntropin 0.25 mg, and the manufacturing process controls of its producer.
Conclusions
Statistically significant differences appear between vials in the same lot, and between different lots of the same product. Additional destructive testing should be conducted to determine whether these lots represent acceptable drug product.
Figure 7.
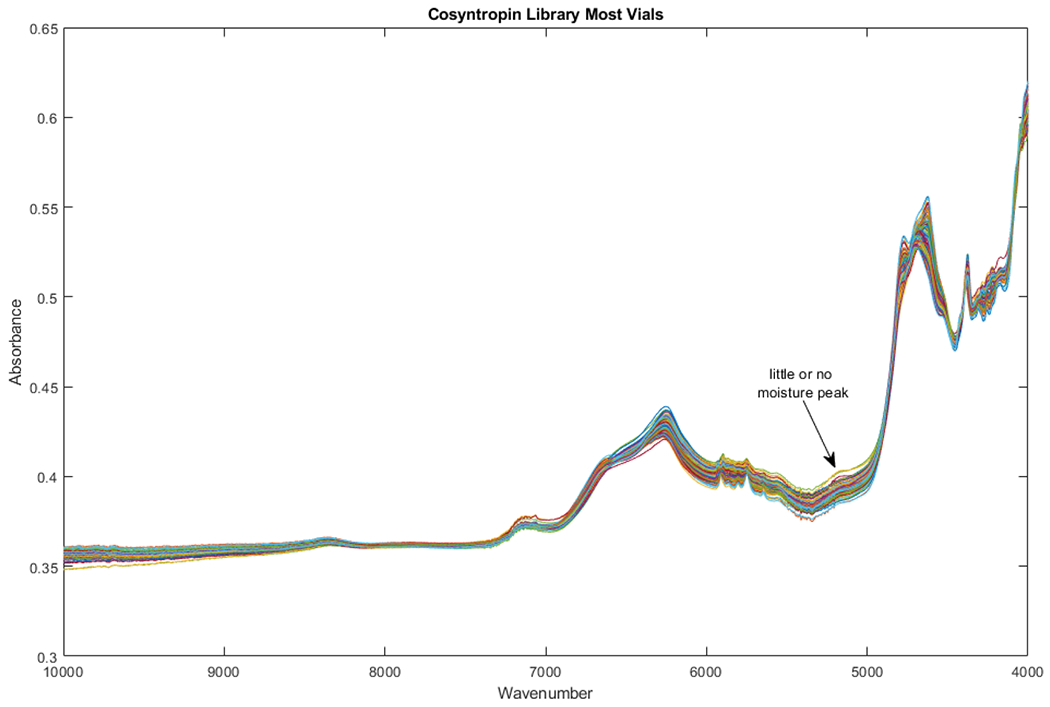
The moisture peak is smaller in the bulk of the library than it is in the outliers in Figure 4.
Acknowledgements
The project described was supported in part by NSF ACI-1053575 allocation number BIO170011 and the National Center for Research Resources and the National Center for Advancing Translational Sciences, National Institutes of Health, through Grant UL1TR001998. The content is solely the responsibility of the authors and does not necessarily represent the official views of the NIH.
References
- Dempsey RJ, Davis DG, Buice RG Jr, & Lodder RA (1996). Biological and medical applications of near-infrared spectrometry. Applied Spectroscopy, 50(2), 18A–34A. [Google Scholar]
- Isaksson T, & Næs T (1988). The effect of multiplicative scatter correction (MSC) and linearity improvement in NIR spectroscopy. Applied Spectroscopy, 42(7), 1273–1284. [Google Scholar]
- Jolliffe IT, & Cadima J (2016). Principal component analysis: a review and recent developments. Philosophical Transactions of the Royal Society A: Mathematical, Physical and Engineering Sciences, 374(2065), 20150202. [DOI] [PMC free article] [PubMed] [Google Scholar]
- Lodder RA, & Hieftje GM (1988). Detection of subpopulations in near-infrared reflectance analysis. Applied spectroscopy, 42(8), 1500–1512. [Google Scholar]


