

Abstract
Graphene monolayer of sub-nanometer thickness shows strong metallic and plasmonic behavior in terahertz (THz) frequency range. This plasmonic effect varies considerably when graphene layer is placed under a magnetic field of appropriate strength. The strong adsorption characteristic of graphene layer is another advantage. In this work, a photonic spin Hall effect (PSHE)-based plasmonic sensor consisting of germanium prism, organic dielectric layer, and graphene monolayer is simulated and analyzed in THz aiming at highly sensitive and reliable sensing under variable magnetic field. Modified Otto configuration and magneto-optic effect in graphene are considered. The sensor’s performance is examined in terms of sensitivity, limit of detection (LOD), and figure of merit (FOM). The analysis indicates that LOD of the order of 10−5 RIU for gas sensing is achievable, which is finer than recently reported gas sensors based on different techniques. Further, the FOM improves when a larger magnitude of magnetic field is applied. The FOM is even greater for rarer gaseous media, which can make the sensor extremely useful in early detection of airborne viruses such as SARS-Cov-2 (while using appropriate specificity method) and to measure the concentration of a particular gas in a given gaseous mixture. The results further indicate that the same sensor design can be used for magnetic field detection while the FOM of magnetic field detection is significantly greater for rarer gaseous medium (e.g., air), which may enable the probe to be used in early detection of radiation leakage in nuclear reactors. For larger magnitudes of magnetic field, the corresponding LOD becomes finer.
Keywords: Graphene, Magnetic field, Plasmon, THz, Photonic spin Hall effect, Sensor
Introduction
Spin Hall effect (SHE) refers to the splitting of spin up and spin down electrons inducing spin current perpendicular to the direction of applied electric field [1, 2]. Photonic spin Hall effect (PSHE) has been attracting a lot of attention in magneto-optical effects [3, 4]. PSHE is the optical analogy of SHE where spin photon plays the role of spin electron and the electric field is replaced by refractive index (RI) gradient [5, 6]. The reason for the PSHE is credited to a spin-orbital interaction between spin polarization and trajectory of light is the origin of PSHE [4, 7, 8]. PSHE is referred to as the displacement normal to the plane of incidence corresponding to the splitting of left or right circularly polarized component when the beam is reflected or transmitted through a plane interface [9, 10].
PSHE has become a potential candidate for finding applications in different research areas including plasmonics [11, 12]. PSHE has been utilized to calculate the optical thickness of nanostructures [13], and to identify graphene layers [14]. It has also been implemented to investigate more complicated configurations and materials such as left-handed materials and photonic tunneling [15].
Spin-dependent splitting (SDS) corresponding to PSHE is small in magnitude so a few methods have been proposed to enhance the SDS [16]. PSHE enabled surface plasmon resonance (SPR)-based sensors are strong candidates for enhanced SDS [17, 18]. PHSE enhancement was reported by considering SPR effect in a three-layer structure composed of glass, metal, and air [18]. It was found that a horizontal polarization beam can be used to excite SPR, leading to a significant transverse SDS far greater than the previous reported results observed at the air–glass interface. Another study reported an enhancement of PSHE by using long-range SPR (LRSPR) [19].
From the above studies, one can establish that SDS can be improved by utilizing the SPR effect. It is known that SPR sensors possess high sensitivity and reliability that lead them to find a large number of applications in bio- and chemical sensors including biomolecular interaction. The SPR sensors generally operate in visible and infrared (IR) range with noble metals such as gold and silver [20]. Research of SPR sensors in the terahertz (THz) range is relatively moderate. Further, the use of 2D materials such as graphene also has tremendous potential in SPR sensors in THz range [21]. However, there is still need to enhance the PSHE because it provides very weak responses (SDS) at the subwavelength scale [18]. In summary, PSHE-based plasmonic sensor in THz with controllable performance (e.g., through variable fields/media) and 2D materials should be studied in more details.
In this work, we have reported an enhanced PSHE-based plasmonic gas sensor with graphene monolayer in THz under the variation of magnetic field. Graphene could be capable to support surface plasmon wave (SPW) at very low Fermi energy level as it offers a negative imaginary part of conductivity over THz range [22]. Modified Otto configuration has been used. Germanium (Ge) is used as light coupling prism, which assists in momentum matching between SPW and incident p-polarized THz radiation. Further, the influence of magnetic field on graphene RI in THz range is exploited to improve the gas sensor’s performance. The same probe is also explored and evaluated for implementation as a magnetic field sensor.
Graphene’s Optical Properties in THz and PSHE-Based Sensor Design
Graphene’s Optical Properties in THz Under the Variation of Magnetic Field
In the THz frequency range, the RI of graphene monolayer significantly depends on the magnetic field (B), which is applied perpendicular to the graphene surface. A mathematical dependence of graphene RI (ng) with B can be represented by the following corrected relation [23]:
| 1 |
In Eq. (1), εg is the relative permittivity (dielectric constant) of graphene, σg is the conductivity of graphene, ω (= 2πν) is the angular frequency, ν is the radiation frequency, tg = 0.34 nm is the effective thickness of graphene monolayer, ε0 = 8.854 × 10⁻¹² F/m is the permittivity of vacuum, , EF = 0.8 eV is the Fermi energy, is the carrier relaxation time, μ = 1 m2/(Vs) is the carrier mobility, vF = 9.5 × 10⁵ m/s is the Fermi velocity, and is the cyclotron frequency of electrons in graphene. The final part of Eq. (1) can be written in another corrected form [21]:
| 2 |
Based on above formulation, Fig. 1 shows the simulated variation of real and imaginary parts of graphene’s RI with magnetic field at ν = 5 THz.
Fig. 1.
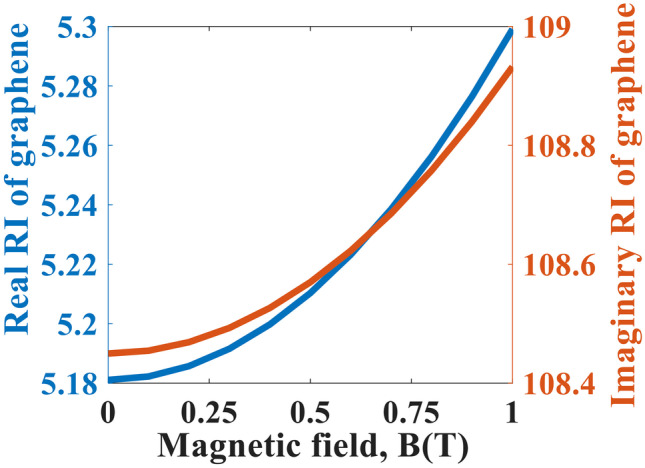
Simulated variation of real (blue) and imaginary (brown) parts of graphene’s RI with magnetic field at = 5 THz
It is observed that real part of graphene’s RI is very small as compared to the corresponding imaginary part, and, consequently, the graphene monolayer supports highly confined plasmonic modes at this frequency.
Graphene-Based Sensor Design with PHSE in THz
Schematic of the 4-layer PSHE-based plasmonic sensor probe is shown in Fig. 2. Modified Otto configuration is used where Ge prism (RI = n1) and graphene monolayer (RI = n3 and thickness d3 = tg = 0.34 nm) are separated by a dielectric organic layer (RI = n2 and thickness d2 = 12 μm) [24, 25]. Previously reported data corresponding to magnetic field (B)-dependent RI of graphene at 5 THz is considered [25]. Further, n1 = 4 and n2 = 1.5 at 5 THz [21]. To calculate the transverse SDS, a general beam propagation model using angular spectrum theory is employed with an incident beam of Gaussian form:
| 3 |
Fig. 2.
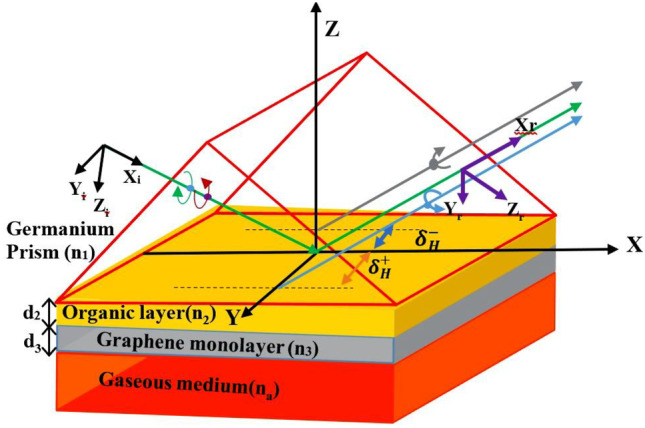
Schematic diagram of 4-layer PSHE-based plasmonic sensor. Graphene monolayer is considered to be under the variable magnetic field while the other layers are considered insulated from it
In Eq. (3), is the beam waist, and and are the wave vector component in and directions, respectively.
In the spin basis set, the incident beam can be written as:
| 4 |
| 5 |
Here, H and V stand for horizontal and vertical polarization states, respectively. Further, and denote the left- and right-handed circularly polarized components, respectively. Transverse displacement of the decomposed H and V polarization incidence [15], respectively, can be written as:
| 6 |
| 7 |
If the reflection coefficients rp (p-polarization) and rs (s-polarization) are insensitive to , the above expressions can be simplified by considering the zero-order Taylor series [17]:
| 8 |
| 9 |
It should be noted that rp and rs for the proposed 4-layer sensor model can be calculated using transfer matrix method [26]. MATLAB is used for the simulation of PSHE-based sensor’s performance. From Eqs. (8 and 9), it is clear that δH components will be significantly greater than δV ones. Hence, the proposed sensor will be evaluated by considering δH only.
Results and Discussion
PSHE-Based Plasmonic Probe for Gas Sensing in THz
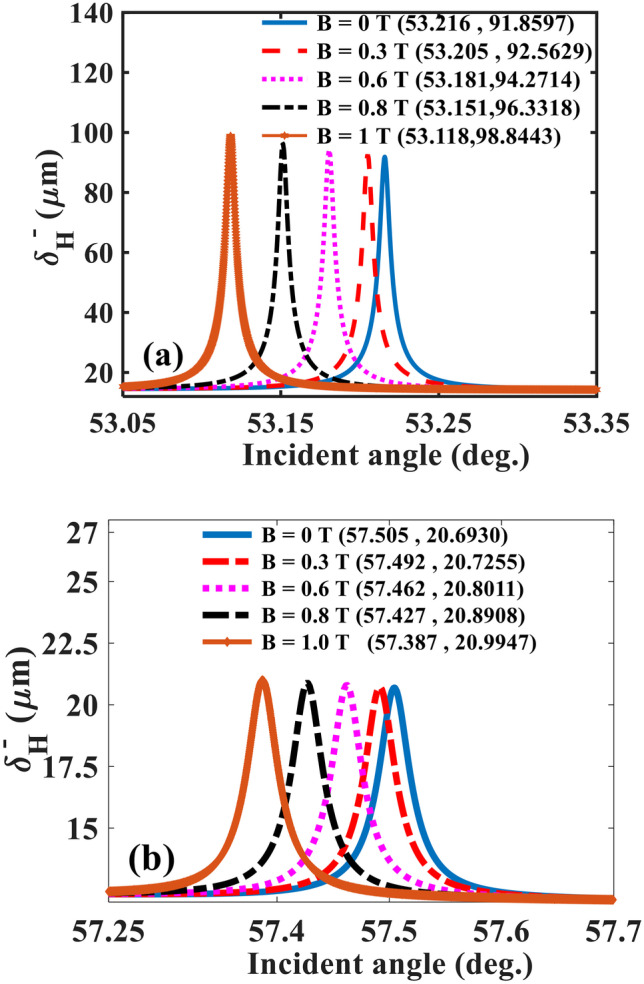
Figure 3a, b depict the angular variation of (i.e., amplified SDS magnitude) for different na values at B = 0 T and B = 1 T, respectively. Clearly, is controllable through both na and B, and this controllability feature adds to the flexibility of the sensor design. At any B value, the SDS peak, which represents the corresponding plasmonic excitation, shifts to greater θ value with an increase in na. Further, when B is varied from 0 to 1 T, it affects both SDS and θSPR. For any given na, the corresponding θSPR shifts to a smaller value and SDS peak magnitude increases when B is increased from 0 to 1 T. This dual effect is due to significant change in graphene RI (both real and imaginary components) upon the variation in B at 5 THz [21]. However, it should be appreciated that the above B-dependent deviation in SDS and θSPR will, respectively, affect the detection accuracy (that depends on SDS curve width) and sensitivity and limit of detection (LOD). At this point, it is worth-mentioning that the sensor’s overall performance is evaluated in terms of figure of merit (FOM):
| 10 |
Fig. 3.

Simulated angular variation of (i.e., PSHE spectrum) for different na values corresponding to a B = 0 T and b B = 1 T at 5 THz. The corresponding values of peak SDS and θSPR are also mentioned in both the figures. For calculations of , an equivalent standard spectral resolution of 0.1 nm is considered
In Eq. (10), δθSPR is the angular shift of PSHE peak corresponding to δna variation in gaseous medium RI, and FWHM is the angular width of PSHE spectrum. FOM consists of two individual performance aspects, i.e., sensitivity (Sa = in deg./RIU) and accuracy (A = 1/FWHM in deg.−1). The unit of FOM is RIU−1 from Eq. (10). Further, the LOD is the ratio of finest angular resolution available (0.001 deg. [20]) to Sa.
In this context, Fig. 4a, b show, respectively, the variation of sensitivity Sa and LOD with na for three values of B (0, 0.6, and 1 T). At any given B value, Sa and LOD vary with na in an almost linear fashion. However, more important is to note that for whole range of na values, Sa is reasonably greater (and correspondingly LOD is reasonably finer) as we lower the magnitude of B. This is due to the reason that for a given variation in na, the shift in θSPR is greater for smaller B, which is apparent from Fig. 2 also. Further, for any value of B, Sa magnitude increases and LOD gets finer for larger na. However, the LOD remains strictly of the order of 10−5 RIU, while the overall LOD magnitude is considerably finer than the recently reported photonic gas sensors, viz., 8 × 10⁻⁵ RIU using optical nanofiber microcoupler in near-IR [27] and 10−4 RIU using photonic crystal nanocavities in mid-IR [28]. At this point, it is appreciable that in addition to large Sa and fine LOD, the accuracy of detecting the gas RI is equally important.
Fig. 4.
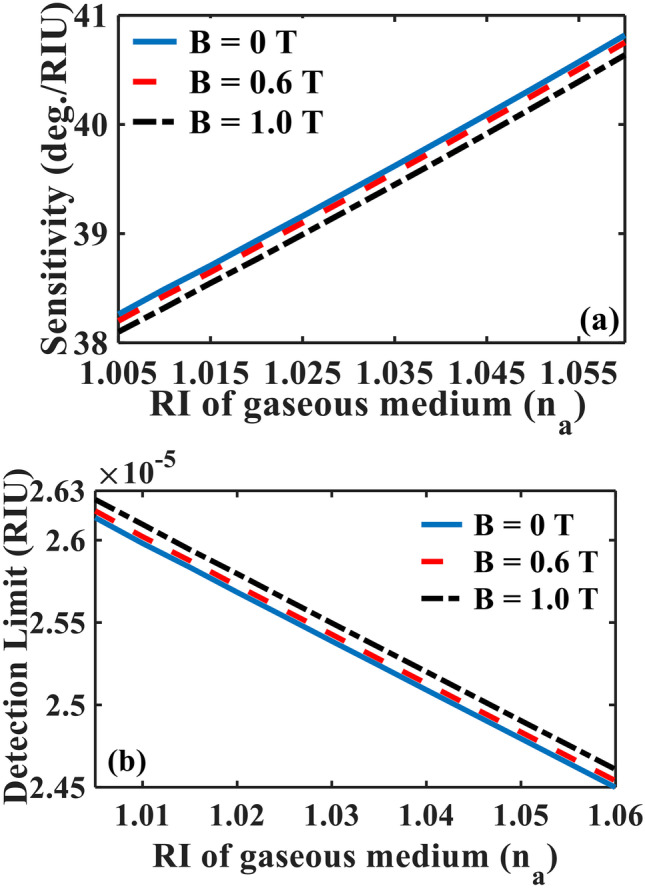
Magnetic field dependent variation of a sensitivity and b LOD with na at 5 THz. Here, na = 1 has been taken as reference for above calculations of sensitivity and LOD
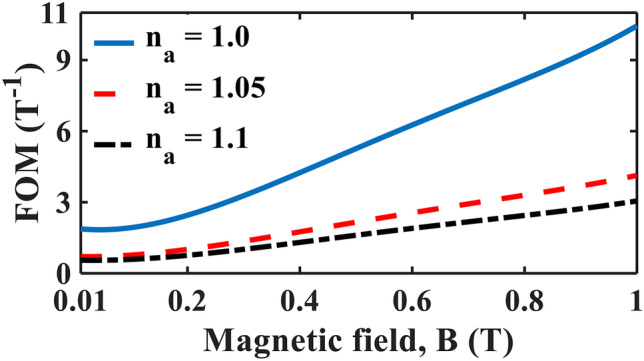
As mentioned earlier, the accuracy is governed by how narrow the plasmonic spectrum is. In the present case, the FWHM of plasmonic PSHE spectra (depicted in Fig. 3) is slated to be affected by variation in B (as discussed above); therefore, accuracy (and, hence, FOM) will also vary under the influence of B. In this sequence, Fig. 5 depicts the variation of FOM with na for three values of B. Unlike sensitivity (and LOD), FOM gets considerably better for larger value of B.
Fig. 5.
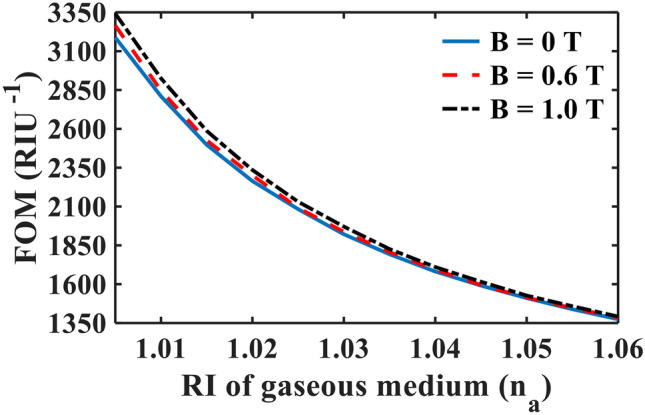
Magnetic field dependent variation of FOM with na at 5 THz. Here, na = 1 has been taken as reference for FOM calculations
This is due to the reason that FWHM is smaller for larger B, which happens because the imaginary part (absorption) of graphene monolayer increases with B. It causes the PSHE spectrum to be deeper leading to smaller FWHM. In view of variation of Sa depicted in Fig. 4a, the above FOM variation principally resembles the variation of A (i.e., 1/FWHM) with B. Although FOM decreases for larger values of na, it is still large enough for highly sensitive and accurate measurement of na. More importantly, larger magnitude of B is able to ascertain considerably higher FOM (with a moderate decrease in sensitivity and LOD). For that matter, higher magnitude of FOM is more evident particularly at smaller na values, which is a crucial result because in case of mixture of gases, low na corresponds to smaller concentrations (e.g., CO2 in CH4) [29] and comparatively larger FOM will certainly lead to more accurate determination of low concentrations in gaseous mixtures. As another perceived application of this result may be in view of the reports that the fatal virus such as SARS-Cov-2 has an airborne transmission [30], probabilistically leading to extremely minute local variations in the air RI. The proposed device, with an appropriate specificity material, can be a striking tool to provide an early (owing to high sensitivity and fine LOD) and accurate (due to large FOM at small RI) detection of the SARS-Cov-2 infusion at the locations of anticipated high risk.
PSHE-Based Magnetic Field Sensing in THz
Due to incorporation between na and B, the same structure can be envisaged for application in magnetic field sensing. In this sequence, Fig. 6a, b depict the PSHE spectra for different B values at na = 1 and na = 1.1, respectively.
Fig. 6.
Simulated variation of for different B values corresponding to a na = 1 and b na = 1.1 at 5 THz. The corresponding values of peak SDS and θSPR are also mentioned in both the figures
For any given na, the corresponding θSPR shifts to a smaller value while SDS peak magnitude increases when B is steadily increased from 0 to 1 T. Even though the θSPR values comfortably lie in a reasonable range for both na values, the SDS peak magnitude corresponding to any B is significantly greater for na = 1 compared to that for na = 1.1. It actually leads to greater FWHM of PSHE spectra for greater na. Like discussed in previous section, the above twin effect (i.e., variation in both θSPR and SDS peak magnitude with B) is bound to considerably affect the FOM of magnetic field detection defined as:
| 11 |
Figure 7 depicts the FOM variation with B at three na values. Consistent with Fig. 5, the FOM for magnetic field detection is significantly greater for smaller na value (close to 1, i.e., air/vacuum). This result is of particular significance in case of nuclear reactors (working under vacuum-like conditions) where any kind of radiation leakage can be detected by measuring the magnetic field with high accuracy and sufficient sensitivity. The calculations further reveal that the LOD for magnetic field detection can reach as fine as 0.006 T with the proposed scheme. The LOD improves for higher magnitudes of B.
Fig. 7.
Variation of FOM with B at 5 THz for three na values. Here, B = 0 has been taken as reference for FOM calculations
Conclusion
PSHE-based plasmonic sensor with Ge prism, thick organic layer, and graphene is simulated and analyzed in THz region for gaseous and magnetic field sensing. The results suggest that larger FOM for gaseous sensing can be achieved with larger magnetic field (at rarer gaseous media, in particular) while negligibly compromising with the sensitivity and LOD. The above feature can be potentially applicable in early detection of airborne viruses (e.g., SARS-COV-2) and detection of small concentrations in gaseous mixtures. Proposed sensor design provides significantly finer LOD than recent gas sensors based on different techniques. As a flexible measure, depending on the required levels of gas sensing performance (in terms of sensitivity, LOD, and FOM), one may appropriately choose the magnetic field anywhere between 0 and 1 T. Further, the same 4-layer sensor probe can be used for magnetic field detection with the feature that larger FOM is achievable when the detection is performed with rarer gaseous media (e.g., air). Magnetic field sensor can be helpful in nuclear reactors for monitoring the radiation leakage.
Author Contribution
All the authors contributed equally.
Funding
A. K. Sharma (principal investigator), Y. K. Prajapati (co-principal investigator), and P. Kumar (research staff) gratefully acknowledge the core research grant (Project no.: CRG/2019/002636) from Science and Engineering Research Board (SERB) India that fully funded this research work.
Declarations
Ethics Approval
Not applicable.
Consent to Participate
Not applicable.
Consent for Publication
Not applicable.
Conflict of Interest
The authors declare no competing interests.
Footnotes
Publisher's Note
Springer Nature remains neutral with regard to jurisdictional claims in published maps and institutional affiliations.
References
- 1.Kato YK, et al. Observation of the spin Hall in semiconductor. Science. 2004;306(1910):1–5. doi: 10.1126/science.1105514. [DOI] [PubMed] [Google Scholar]
- 2.Hirsch JE. Spin Hall effect. Phys Rev Lett. 1999;83(9):1834–1837. doi: 10.1103/PhysRevLett.83.1834. [DOI] [Google Scholar]
- 3.Rizal C. Magneto-optic-plasmonic sensors with improved performance. IEEE Trans Magnet. 2021;57(2):1–5. doi: 10.1109/TMAG.2020.3012468. [DOI] [Google Scholar]
- 4.Liu YL et al (2019) Magneto-optical effects on the properties of the photonic spin Hall effect owing to the defect mode in photonic crystals with plasma. AIP Adv 9(7):p 075111
- 5.Bliokh KY, Bliokh YP. Topological spin transport of photons : the optical Magnus effect and Berry phase. Phys Lett A. 2004;333(3–4):181–186. doi: 10.1016/j.physleta.2004.10.035. [DOI] [Google Scholar]
- 6.Aiello A, Woerdman JP. Role of beam propagation in Goos-Hänchen and Imbert-Fedorov shifts. Opt Lett. 2008;33(13):1437. doi: 10.1364/OL.33.001437. [DOI] [PubMed] [Google Scholar]
- 7.Ling X et al (2017) Recent advances in the spin Hall effect of light. Rep Prog Phys 80(6):pp 066401 [DOI] [PubMed]
- 8.Murakami S, Nagaosa N, Zhang S. Dissipationless quantum spin. Science. 2003;301:1348–1351. doi: 10.1126/science.1087128. [DOI] [PubMed] [Google Scholar]
- 9.Bliokh KY, et al. Spin-orbit interactions of light. Nat Photonics. 2015;9(12):796–808. doi: 10.1038/nphoton.2015.201. [DOI] [Google Scholar]
- 10.Gosselin P, Be A (2007) Spin Hall effect of photons in a static gravitational field. 75(8):pp 1–6
- 11.Filonov DS, et al. Photonic spin Hall effect in hyperbolic metamaterials for polarization-controlled routing of subwavelength modes. Nat Commun. 2014;5(1):3216. doi: 10.1038/ncomms4216. [DOI] [PubMed] [Google Scholar]
- 12.Ling X, et al. Steering far-field spin-dependent splitting of light by inhomogeneous anisotropic media. Phys Rev A. 2012;86(5):1–5. doi: 10.1103/PhysRevA.86.053824. [DOI] [Google Scholar]
- 13.Boucaud P, et al. Nanocrystalline diamond photonics platform with high quality factor photonic crystal cavities. App Phys Lett. 2014;171115(2012):1–5. [Google Scholar]
- 14.Zhou X et al (2012) Identifying graphene layers via spin Hall effect of light. App Phys Lett 10:p 251602
- 15.Zhou X, et al. Observation of spin Hall effect in photon tunelling via weak measurements. Sci Rep. 2014;4:7388. doi: 10.1038/srep07388. [DOI] [PMC free article] [PubMed] [Google Scholar]
- 16.Prajapati YK (2021) Photonic spin Hall effect detection using weak measurement in the SPR structure using antimonene: a sensing application. Superlat Microstruct155:p 106886
- 17.Xiang Y, et al. Enhanced spin Hall effect of reflected light with guided-wave surface plasmon resonance. Photon Res. 2017;5(5):467. doi: 10.1364/PRJ.5.000467. [DOI] [Google Scholar]
- 18.Srivastava A, Sharma AK, Prajapati Y K (2021) On the sensitivity-enhancement in plasmonic biosensor with photonic spin Hall effect at visible wavelength. Chem Phys Lett 774:p 138613
- 19.Tan X, Zhu X (2016) Enhancing photonic spin Hall effect via long-range surface plasmon resonance. Opt Lett 41(11):pp 2478–2481 [DOI] [PubMed]
- 20.Sharma AK, Nagao T. Design of a silicon-based plasmonic optical sensor for magnetic field monitoring in the infrared. App Phys B. 2014;117:363–368. doi: 10.1007/s00340-014-5843-9. [DOI] [Google Scholar]
- 21.Zhang Z et al (2017) Graphene based surface plasmon resonance gas sensor with magnetic field control for terahertz. Prog Electrom Res Symp19–22
- 22.Bao Q, Loh KP. Graphene photonics, plasmonics, and broadband optoelectronic devices. ACS Nano. 2012;6:3677–3694. doi: 10.1021/nn300989g. [DOI] [PubMed] [Google Scholar]
- 23.Cheng R, et al. Tunable graphene-based terahertz absorber via an external magnetic field. Opt Mater Exp. 2020;10(2/1):501–512. doi: 10.1364/OME.384147. [DOI] [Google Scholar]
- 24.Otto A. Excitation of nonradiative surface plasma waves in silver by method of frustrated total reflection. Z Phys. 1968;216(4):398–410. doi: 10.1007/BF01391532. [DOI] [Google Scholar]
- 25.Srivastava T, et al. Graphene based surface plasmon resonance gas sensor for terahertz. Opt Quant Electron. 2016;48(6):1–11. doi: 10.1007/s11082-016-0462-9. [DOI] [Google Scholar]
- 26.Hetch E (2002) Optics Addison-Wesley
- 27.Li K et al (2018) Ultrasensitive measurement of gas RI using an optical nanofiber microcoupler. Opt. Lett 43(4):pp 679–682 [DOI] [PubMed]
- 28.Baghdouche L, Cassan E (2020) Mid infrared gas sensor based on high-Q/V point-defect photonic crystal nanocavities. Opt Quant Electron 52:260
- 29.Giraudet C (2016) Concentration dependent RI of CO2/CH4 mixture in gaseous and supercritical phases. J Chem Phys 144:p 134304 [DOI] [PubMed]
- 30.Greenhalgh T, et al. Ten scientific reasons in support of airborne transmission of SARS-COV-2. Lancet: In Press; 2021. [DOI] [PMC free article] [PubMed] [Google Scholar]