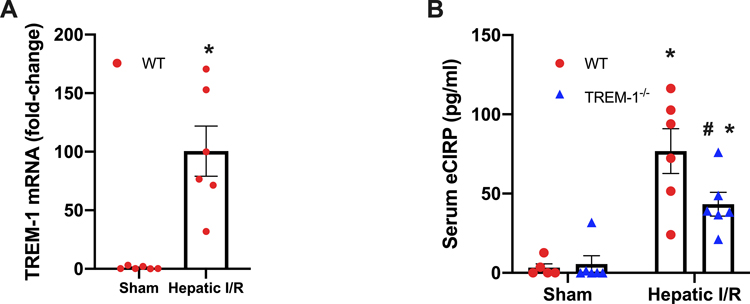
Fig. 1. TREM-1 gene expression and serum eCIRP increase after hepatic I/R.
Blood and ischemic liver tissue was collected at 24 h reperfusion from WT sham, TREM-1−/− sham, WT I/R, and TREM-1−/− I/R groups. (A) TREM-1 mRNA was measured by RT-qPCR in WT sham and WT I/R groups (n=6/group). Levels were normalized to β-actin. (B) Serum eCIRP was measured by ELISA in all groups (n=5–6/group). Data expressed as means ± SE and compared by one-way ANOVA and SNK method, and students t-test for TREM-1 (*P ≤ 0.05 versus WT Sham; #P ≤ 0.05 vs WT I/R).

