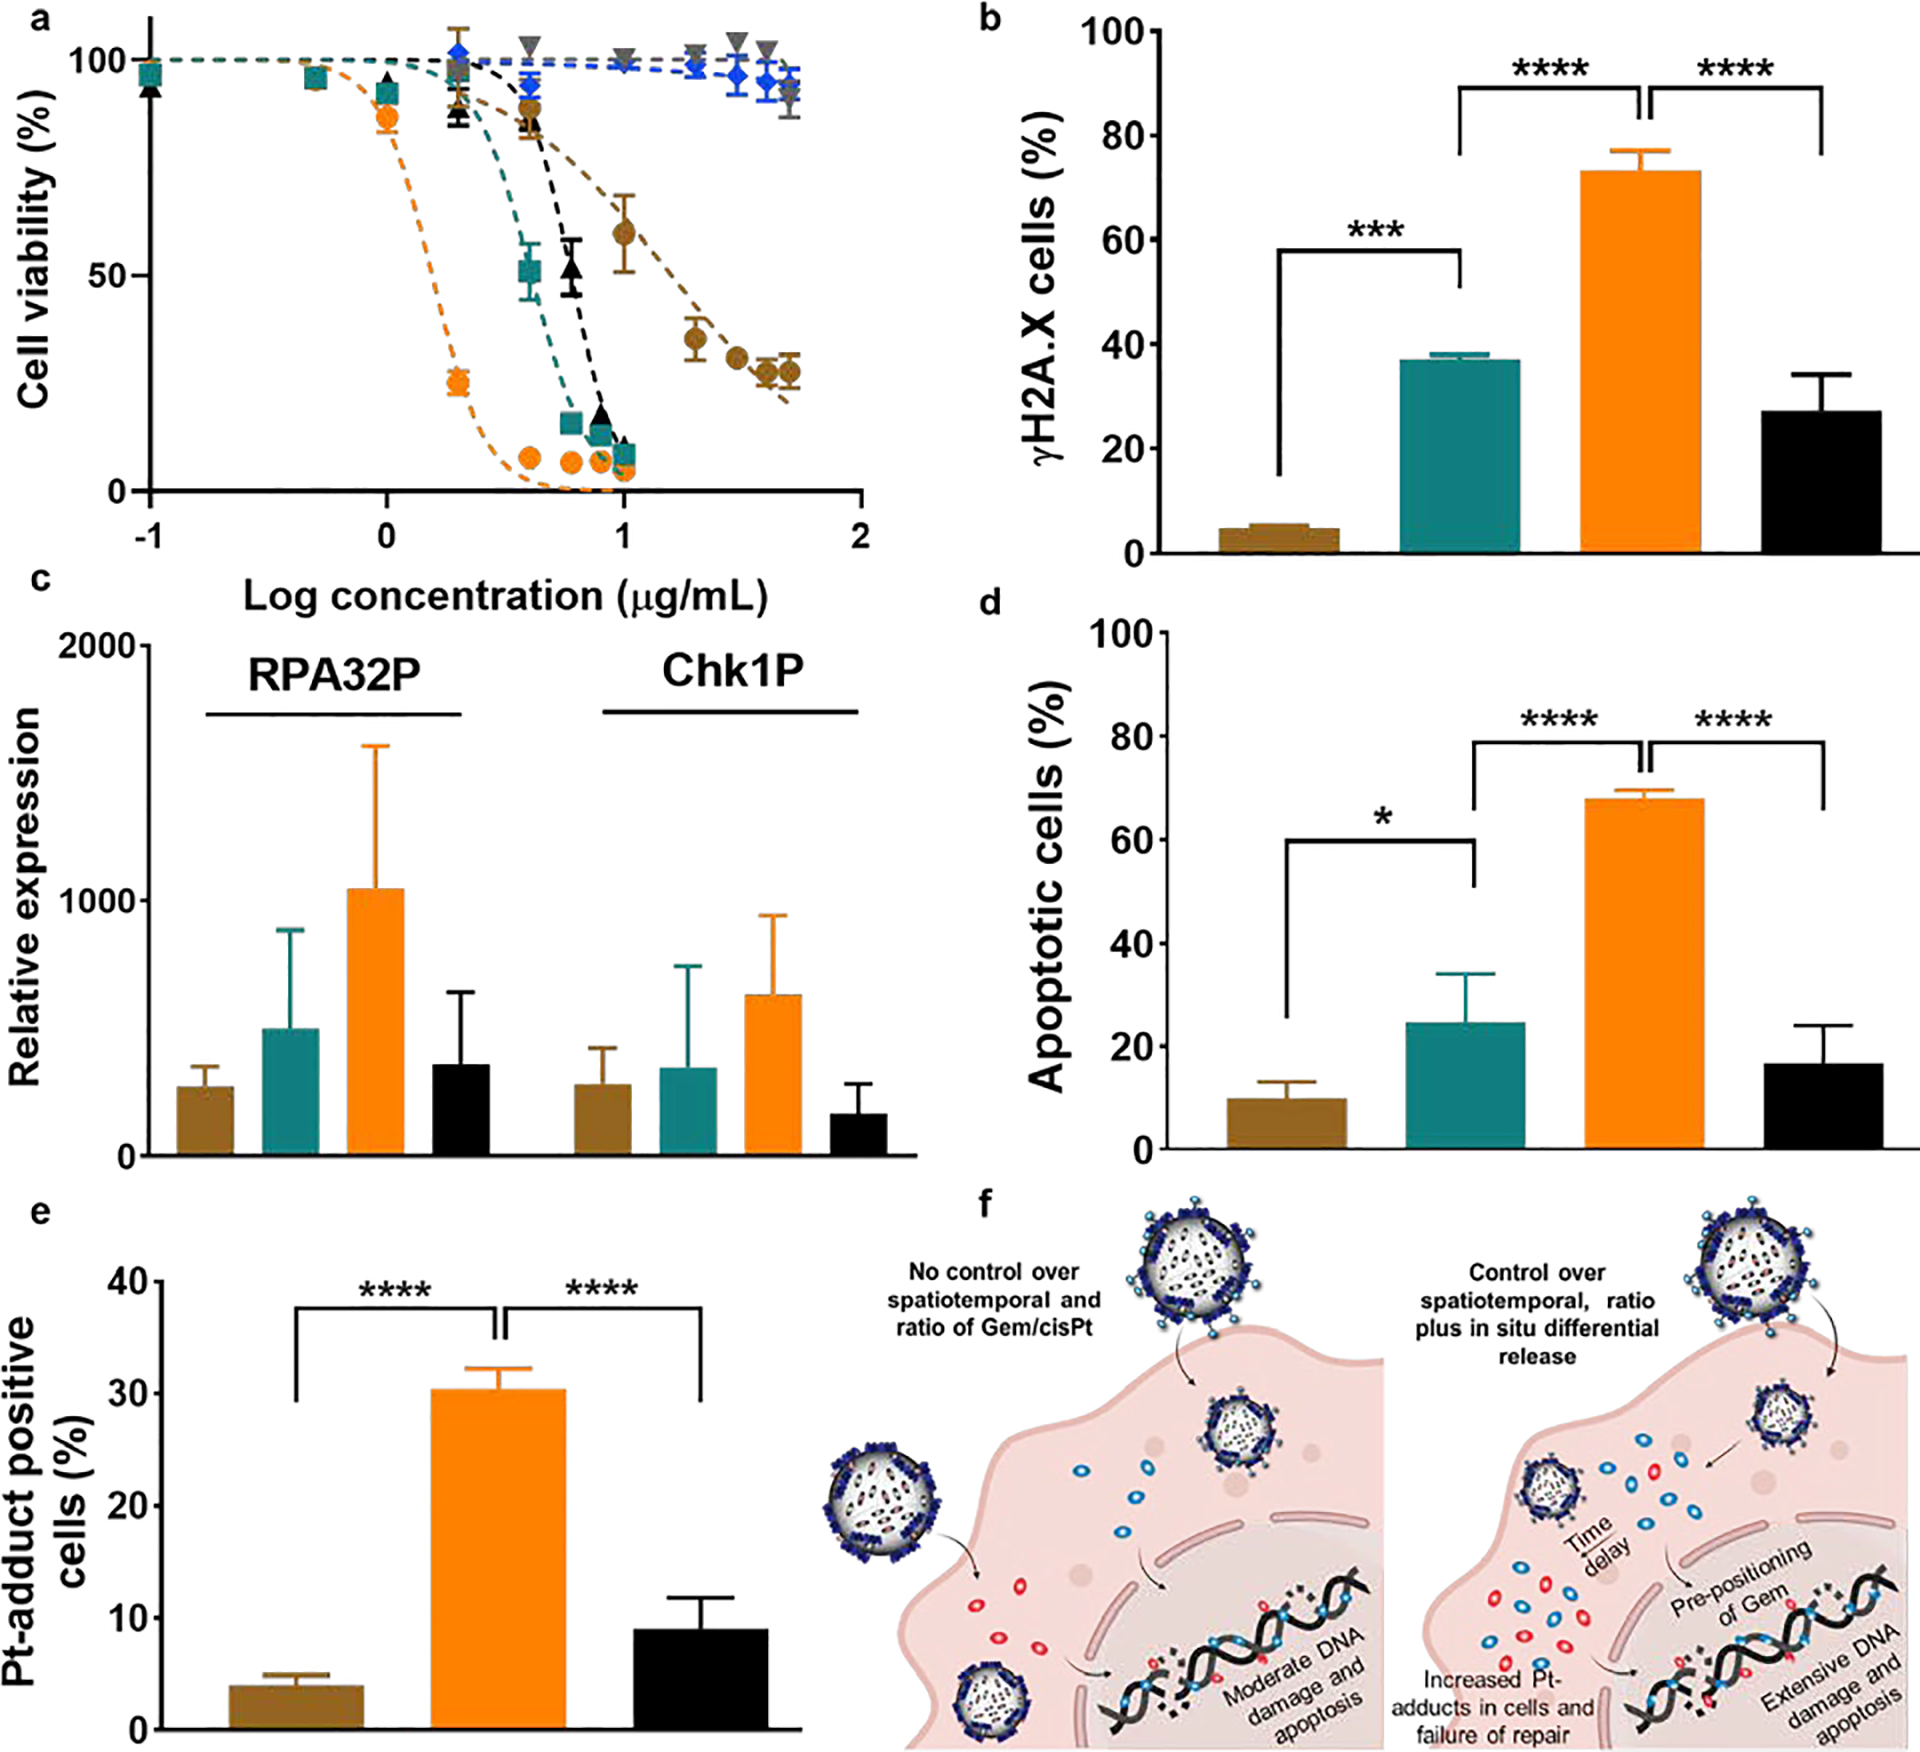
Figure 3.

In vitro evaluation of Gem-cisPt-MSNs in a panel of PDAC cells. (a) Dose-response curve of KCM cells treated with AP-MSNs (gray), PEI-MSNs (blue), cisPt-MSNs (brown), Gem-MSNs (green), Gem-cisPt-MSNs (orange), and a physical mixture of Gem-MSNs plus cisPt-MSNs (black). Data represents the mean ± SD of three independent experiments (n=3). (b) Percentage of γH2AX positive cells; (c) western blot analysis of the phosphorylation status of RPA32 and Chk1 proteins (RPA32P indicates RPA32 phosphorylation at the Ser33 and Chk1P indicates Chk1 phosphorylation at the Ser345); (d) percentage of apoptotic cells; and (e) percentage of cells positive for Pt-adduct after treating KCM cells with cisPt-MSNs (brown), Gem-MSNs (green), Gem-cisPt-MSNs (orange) or a physical mixture of Gem-MSNs plus cisPt-MSNs (black). (f) Schematic representation of the mechanism that underlies the enhanced cytotoxic benefit of Gem-cisPt-MSN on PDAC cells. Data represents the mean ± SD of three independent experiments (n=3). One-way ANOVA using Tukey’s multiple comparison test was performed between different groups to determine statistical differences. Statistics: ****p≤0.0001, ***p≤0.001, ** p≤0.01, * p≤0.05 and not significant (ns) p>0.05.
