Figure 5.

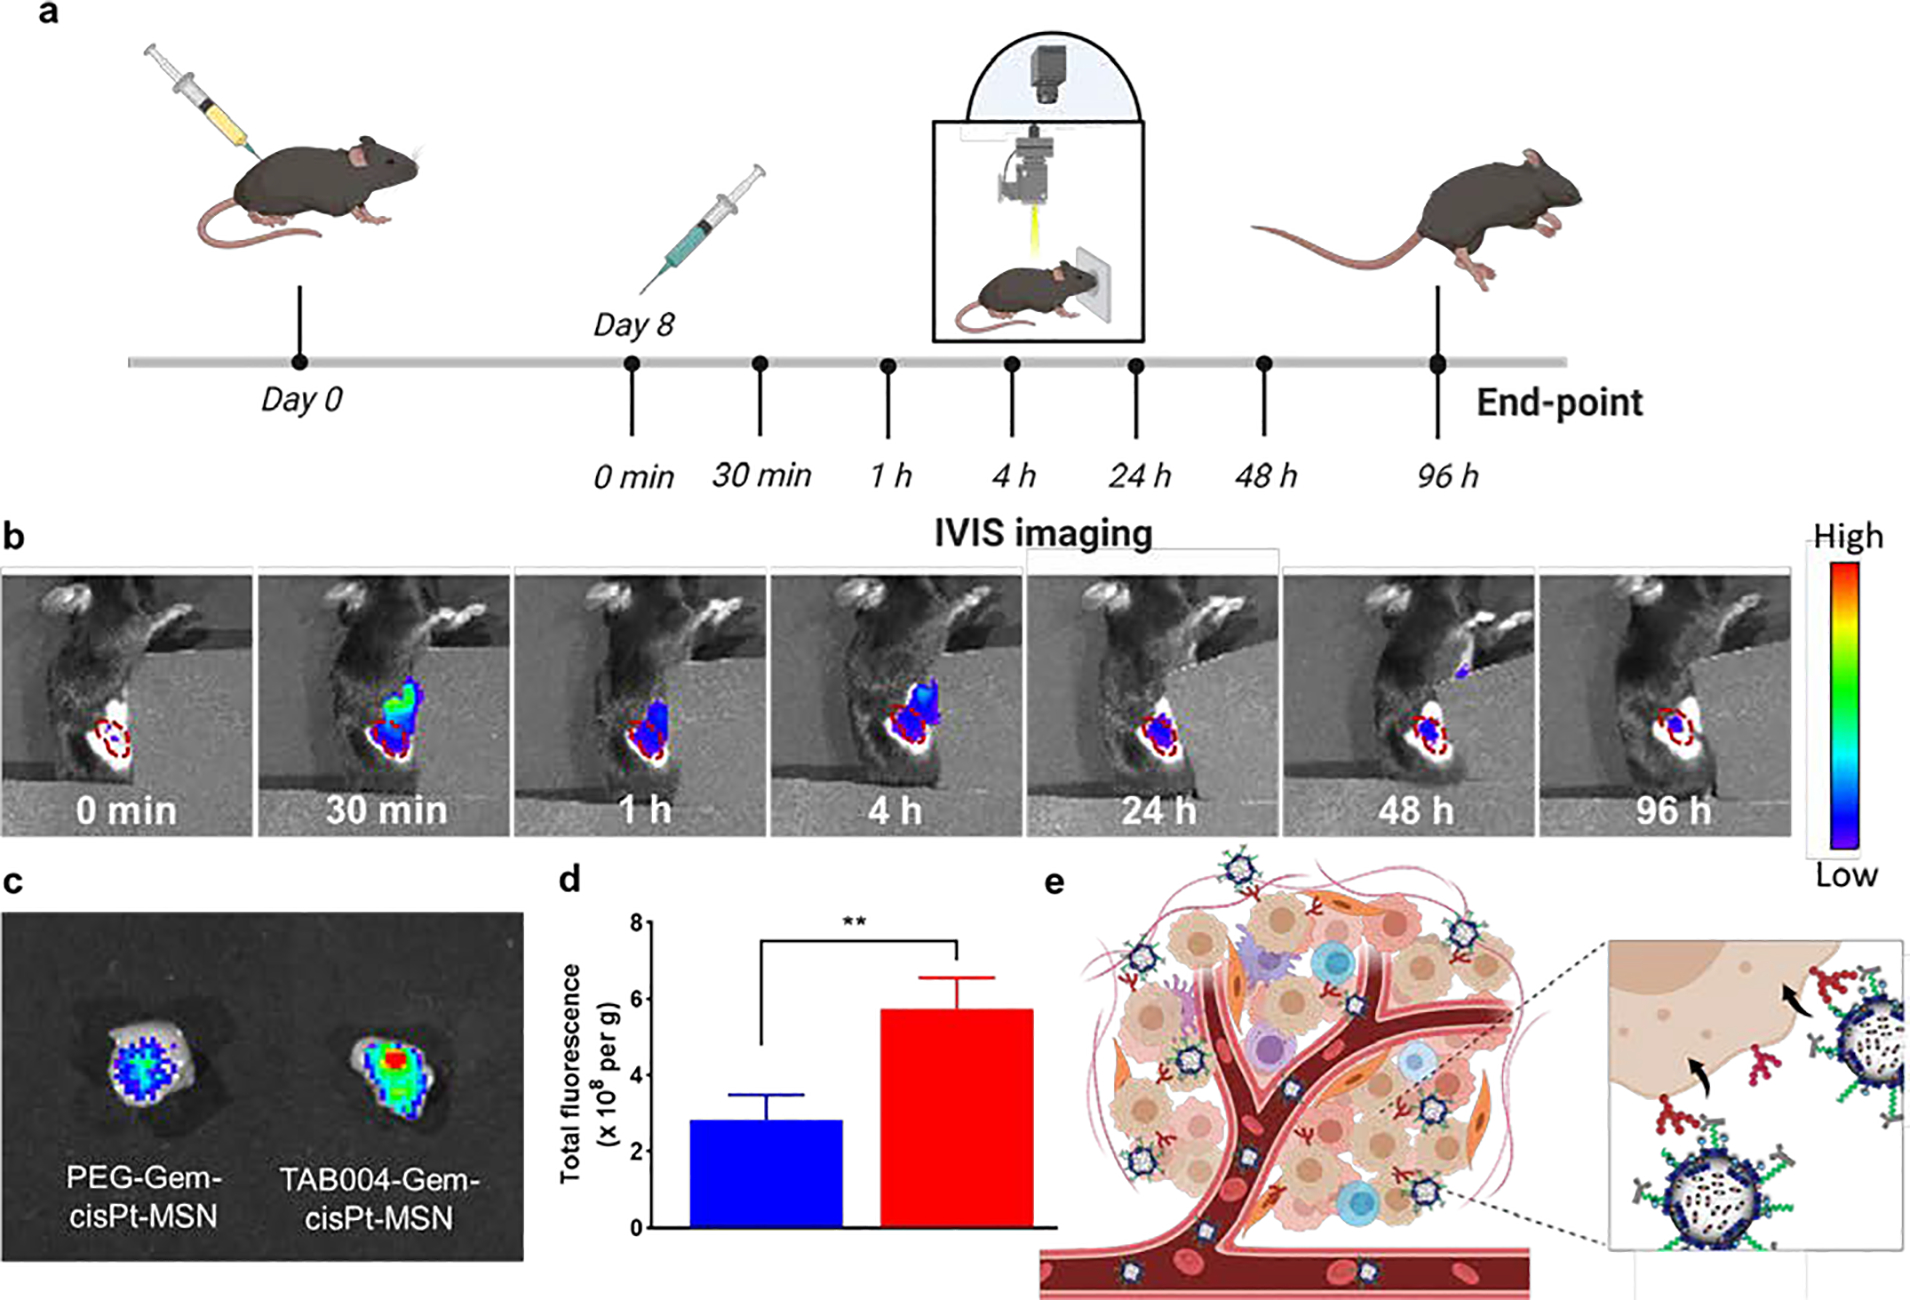
In vivo targeting of TAB004-Gem-cisPt-MSNs in syngeneic KCM mice. (a) Schematic illustration showing the regimen for administration of MSNs and the subsequent imaging schedule. (b) Representative IVIS images at 0, and 30 min, and at 1, 4, 24, 48, and 96 h after intravenous injection of mouse with TAB004-Gem-cisPt-MSNs (region outlined in red denotes subQ tumor location). (c) Tumors excised after 96 h exhibited the difference in accumulation of TAB004-Gem-cisPt-MSNs versus PEG-Gem-cisPt-MSNs. (d) Quantification of fluorescence in tumors excised from mice injected with PEG-Gem-cisPt-MSNs (blue) or TAB004-Gem-cisPt-MSNs (red) (n=3). Data represents the mean ± SD of three independent experiments (n=3) and t-test was performed between the two groups to determine the statistical difference. (e) Schematic representation of the specific interaction between TAB004 functionalized on the surface of MSNs with the tMUC1 expressed on KCM cells. Statistics: ****p≤0.0001, ***p≤0.001, ** p≤0.01, * p≤0.05 and not significant (ns) p>0.05.
