

Abstract
Tumor associated macrophages (TAMs) play a major role in regulating mammary tumor growth and in directing the responses of tumor infiltrating leukocytes in the microenvironment. However, macrophage-specific mechanisms regulating the interactions of macrophages with tumor cells and other leukocytes that support tumor progression have not been extensively studied. In this study, we show that the activation of the RON receptor tyrosine kinase signaling pathway specifically in macrophages supports breast cancer growth and metastasis. Using clinically relevant murine models of breast cancer, we demonstrate that loss of macrophage RON expression results in decreases in mammary tumor cell proliferation, survival, cancer stem cell self-renewal, and metastasis. Macrophage RON signaling modulates these phenotypes via direct effects on the tumor proper and indirectly by regulating leukocyte recruitment including macrophages, T-cells, and B-cells in the mammary tumor microenvironment. We further show that macrophage RON expression regulates the macrophage secretome including IL-35 and other immunosuppressive factors. Overall, our studies implicate activation of RON signaling in macrophages as a key player in supporting a thriving mammary pro-tumor microenvironment through novel mechanisms including the augmentation of tumor cell properties through IL-35.
Keywords: RON receptor tyrosine kinase, breast cancer stem cells, macrophages, tumor microenvironment, IL-35 regulation
Introduction
Breast cancer (BCa) is the most common cancer and the second leading cause of cancer-related deaths among women in the US (1). Treatment advances have improved overall survival of patients with localized or regional disease (1). Nevertheless, many still die from BCa, highlighting need for new therapies.
The tumor microenvironment (TME) is known to support BCa development and progression. Within the TME, tumor infiltrating leukocytes (TILs) can promote or restrain tumorigenesis depending on environmental cues, activation state, and cellular crosstalk (2). Macrophages are the most abundant immune cells in the TME and exhibit a continuum of polarization states classified in two general groups based on their biological function: classically activated (M1) or alternatively activated (M2) macrophages. M1 macrophages inhibit BCa cell growth and support T-cell mediated anti-tumor immunity responses via secretion of pro-inflammatory cytokines (such as TNF-α, nitric oxide [NO]) (3–5). M2 macrophages support breast tumorigenesis and immunosuppression through the secretion of growth factors and anti-inflammatory cytokines. Increases in M2 macrophage infiltration correlating with poor prognosis (3, 6–8).
The RON receptor tyrosine kinase (MST1R) is expressed in macrophages (3, 6, 9–17) negatively regulating inflammatory responses during injury and infection (3, 6, 12–14, 18–20). RON activation by its ligand, Hepatocyte Growth Factor-Like protein (HGFL/MST1), promotes the expression of Arginase-1 and limits inducible nitric oxide synthase (iNOS). This leads to decreases in NO production and pro-inflammatory cytokines attenuating immune responses while supporting a M2 state (3, 6, 12, 18–26).
RON is expressed at low levels in normal mammary epithelial cells but is overexpressed in over 50% of human BCs. Tumoral RON expression correlates with increased BCa progression, metastasis, and poor prognosis independent of molecular subtype (8, 10, 27, 28). RON activation leads to downstream activation of several signaling cascades that promote pleiotropic functions, including cell proliferation, invasion, angiogenesis, therapeutic resistance, and stemness (8, 10, 27, 29, 30). Several gain and loss-of-function mouse models have established RON upregulation in epithelial cells as a key driver of mammary tumorigenesis (31, 32) while global RON or HGFL knockout in BCa (27, 33) abrogates tumorigenesis.
Macrophages are known to provide diverse, context dependent functions via direct phagocytic mechanisms and secretion of molecules, such as cytokines, that result in paracrine mechanistic action. The IL-12 cytokine family consists of heterodimers composed of an α (p19, p28, or p35) and a β chain (p40 or EBI3) (34). Different combinations of the α and β chains form each heterodimer: IL-12 (p35-p40), IL-23 (p19-p40), IL-27 (p28-EBI3), IL-39 (p19-EBI3) and IL-35 (p35-EBI3) (34, 35). In general, IL-23, IL-27, IL-39, and IL-35 have been shown to promote tumor growth and metastasis, whereas IL-12 is tumor suppressive (35). Of IL-12 family members, only IL-35 has been shown to promote immunosuppression of CD4+ and CD8+ T-cell effector functions, while also inducing the expression of IL-10 and IL-35 to promote T and B-cell responses (35). The IL-35 heterodimer then signals through 4 different receptor dimers of the IL12Rβ2, IL6ST, and IL27RA receptors. Receptor activation by IL-35 leads to the activation of STAT1/STAT4 heterodimers or homodimers and the B cell-specific STAT1/STAT3 heterodimers which can induce the expression/secretion of p35 and EBI3 (IL-35), secretion of immunosuppressive cytokines, generation of regulatory T and B cells, and inhibition of T and B cell proliferation (36, 37). Direct function of IL-35 on tumor cells and macrophage-dependent IL-35 secretion in the context of breast cancer is not well characterized.
Herein, we examined the role of RON in macrophages in governing BCa phenotypes and in regulating the TME. We show that mice lacking macrophage RON exhibit diminished mammary tumor initiation, growth, and metastasis. Macrophage RON loss is associated with reductions in BCa proliferation, survival, and cancer stem cell self-renewal. We also show that mammary tumors from mice lacking macrophage RON display enhanced recruitment of anti-tumor TILs. The mammary TME from mice lacking macrophage RON consists of fewer F4/80+ cells and heightened iNOS+ cells vs Arginase-1+ cells, CD8+ T-cells, and restrained B cell infiltration. Furthermore, we demonstrate that macrophage RON supports BCa phenotypes by altering cytokine production. Through transcriptomics, cytokine profiling, and protein expression analyses, we show that RON in macrophages activates immunosuppressive and tumor promoting cytokine signaling pathways, including the IL-12 family of cytokines. IL-12 family members act as anti-tumor response regulators (38), and our studies show an important function of macrophage RON expression on IL-35 subunit (IL-12 p35, EBI3) production and ensuing effects supporting BCa stem cell self-renewal. Together, we demonstrate that a key function for RON in macrophages in supporting mammary tumorigenesis through mechanisms affecting the TME immune recruitment and tumor cell proliferation, anti-apoptosis, cancer stem cell self-renewal, and progression to metastasis. These studies highlight the potential of RON-targeted therapies as a promising approach for treating BCa.
Results
Myeloid RON signaling sustains BCa growth, survival, and recruitment of M2 macrophages and B cells while suppressing T-cell and M1 macrophage recruitment
We utilized the well-established PyMT model of BCa with or without a conditional deletion of the RON tyrosine kinase (TK) domain in the myeloid compartment, referred to as PyMT TKFL/FL and PyMT TKΔMyeloid, respectively. PyMT TKΔMyeloid mice exhibited a significant decrease in mammary tumor growth and tumor weight compared to PyMT TKFL/FL control mice (Figure 1A–B). Immunohistochemical (IHC) analyses showed that PyMT TKΔMyeloid tumors contained significant decreases in tumor cell BrdU incorporation and increases TUNEL positive tumor cells compared to controls (Figure 1C).
Figure 1. Myeloid RON signaling sustains BCa growth and survival.
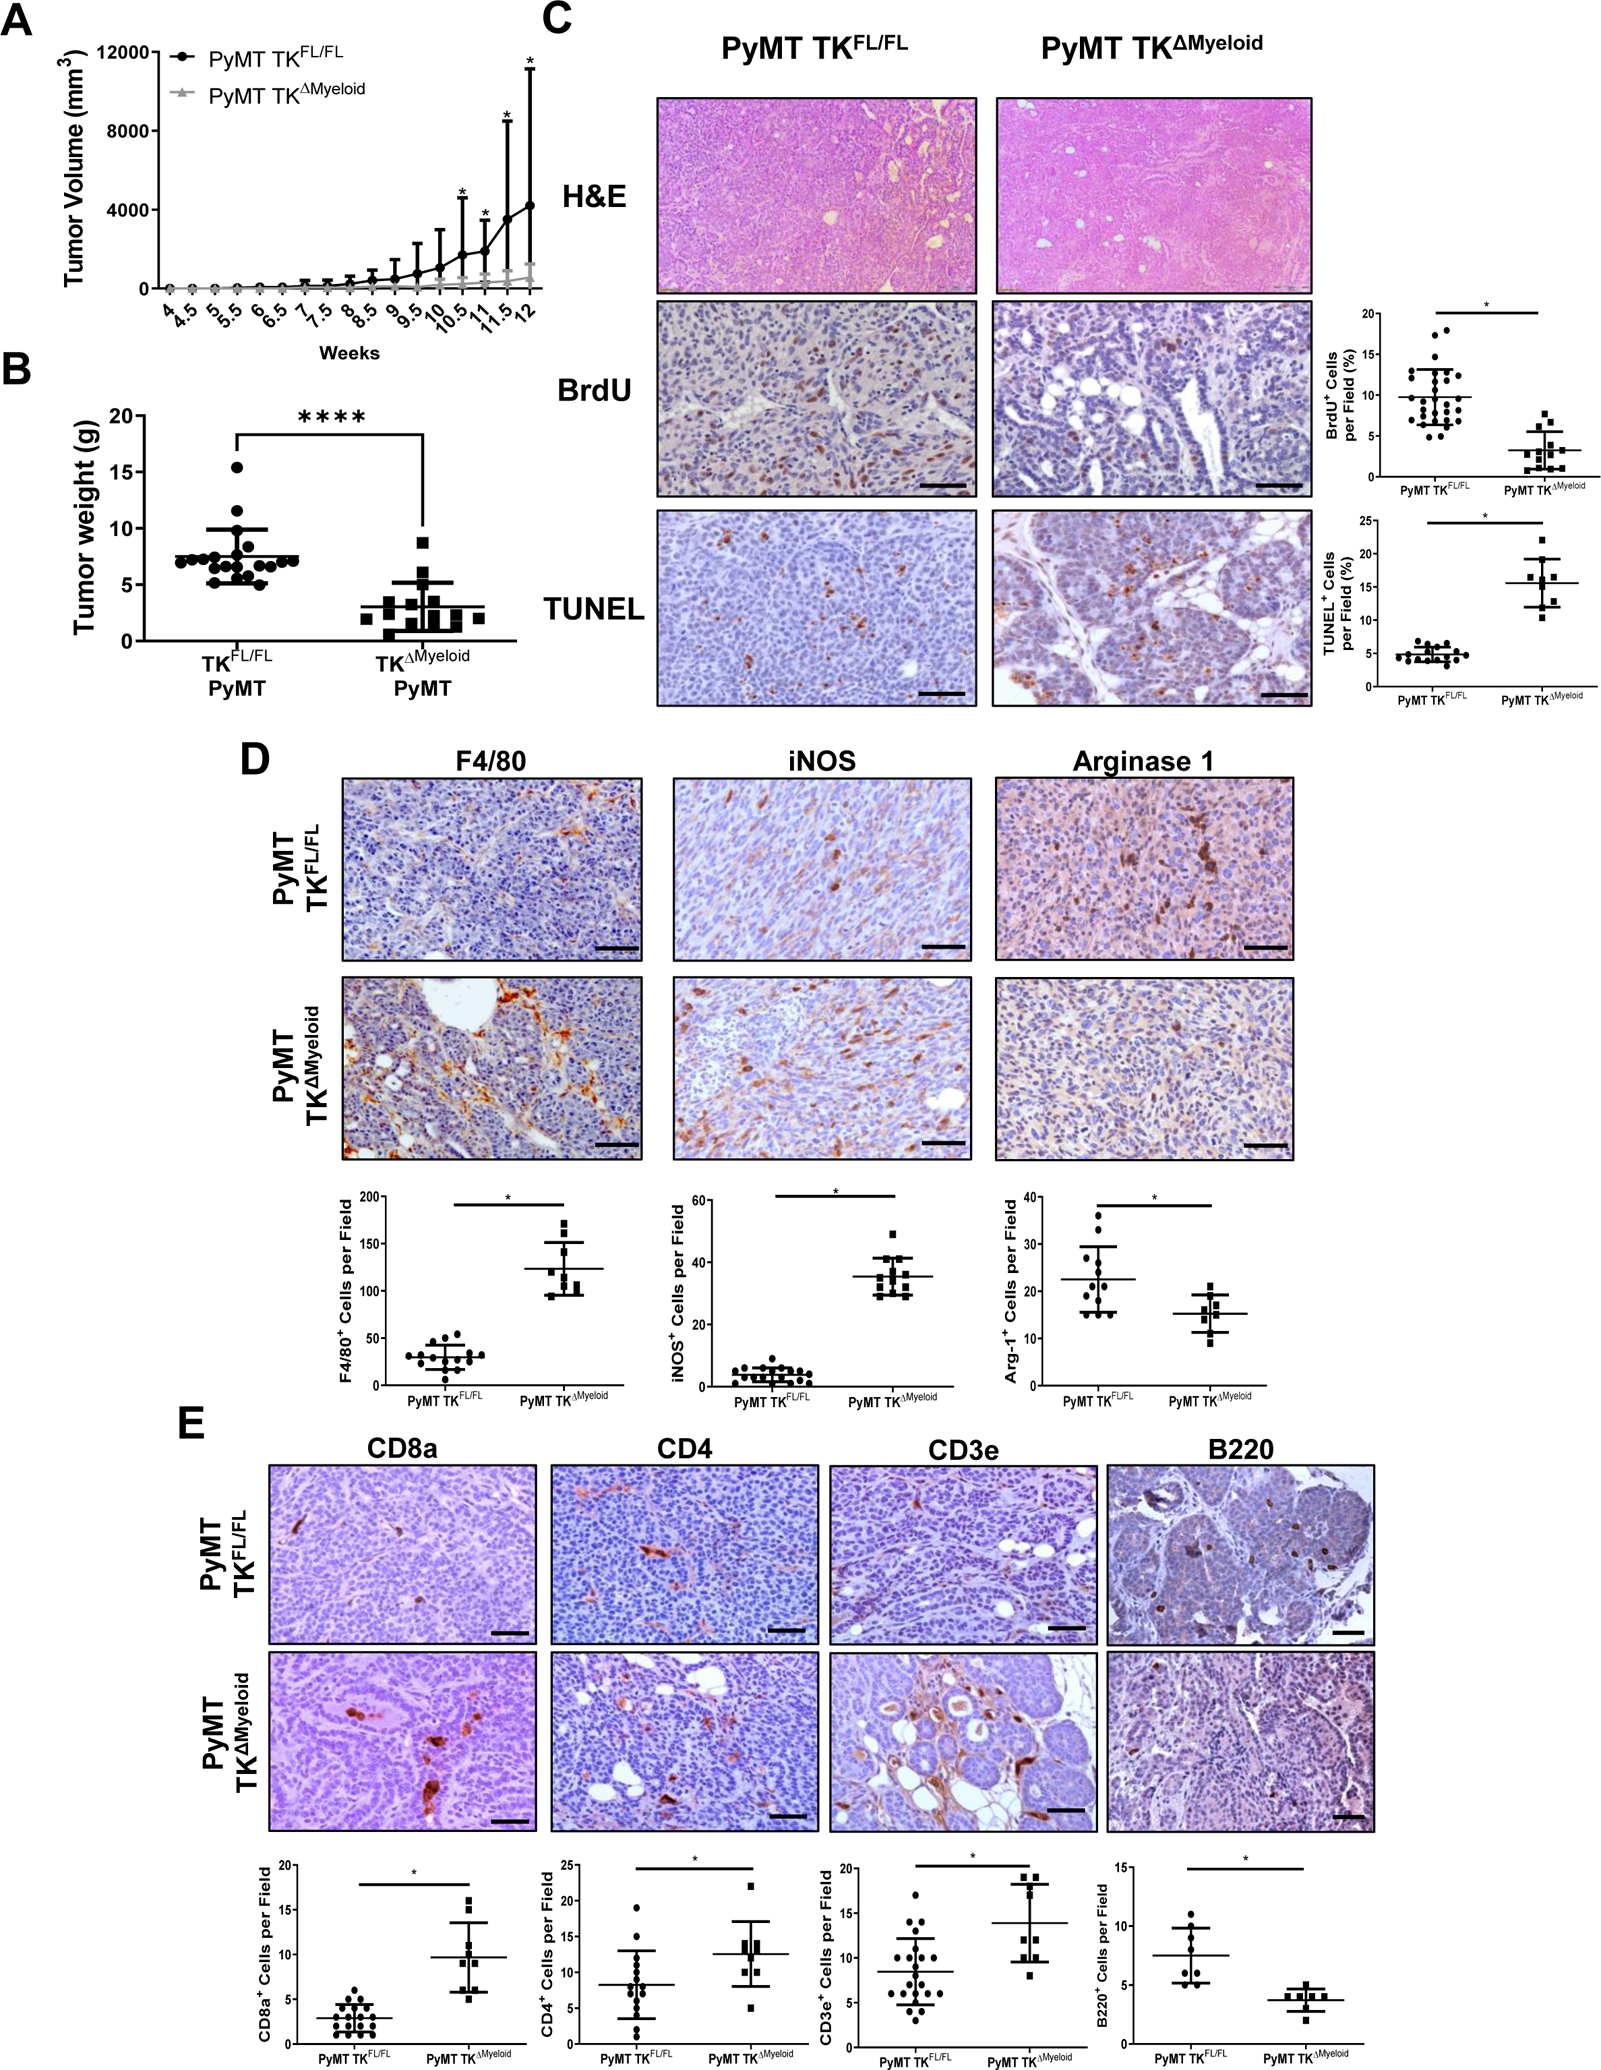
A) Average tumor growth curves of PyMT TKFL/FL (n=47) and PyMT TKΔMyeloid (n=27) mice. Statistical significance was determined using a two-way ANOVA with corrected multiple t tests. Data represent average values ± SD. *P<0.05. B) Tumor weights at 90 days of age for PyMT TKFL/FL (n=20) and PyMT TKΔMyeloid mice (n=15). C) Representative images and quantifications of PyMT TKFL/FL and PyMT TKΔMyeloid tumors stained for C) H&E, BrdU, and TUNEL; D) F4/80, iNOS, and Arginase 1; and E) CD8a, CD3e, CD4, and B220. Scale bars=100μm; n=3–8 tumors per group; n=3–5 fields per tumor were analyzed. Statistical significance was determined using Student’s t test (B-E). Data represent average values ± SD. *P<0.05.
We next examined macrophage infiltration and polarization state markers in mice with and without myeloid RON loss. IHC analyses showed that PyMT TKΔMyeloid tumors had a significant increase in F4/80+ cells compared to controls (Figure 1D, Supplemental Figure S1A). Expression of the M1 polarization marker, iNOS, and the M2 polarization marker, Arginase-1, showed that PyMT TKΔMyeloid tumors had a significant increase in the number of iNOS positive cells and decrease in the number of Arginase-1 positive cells compared to controls (Figure 1D, Supplemental Figure S1A).
Next, the effects of myeloid-specific RON loss on the infiltration of T cells were evaluated. IHC analyses showed that PyMT TKΔMyeloid tumors had a significant increase in the infiltration of CD3+, CD8+, and CD4+ T-cells compared to PyMT TKFL/FL tumors (Figure 1E, Supplemental Figure S1B). Interestingly, analysis of the B-cell marker, B220, showed that PyMT TKΔMyeloid tumors had a significant decrease in the number of B-cells within PyMT TKΔMyeloid tumors compared to controls (Figure 1E, Supplemental Figure S1B). Taken together, our data provide evidence that myeloid-specific RON signaling may sustain breast tumorigenesis by promoting recruitment/activities of M2 macrophage and B-cells while restraining CD8+ and CD4+ T-cell recruitment and responses.
RON signaling within myeloid cells promotes BCa cell metastasis and self-renewal
We next examined whether RON loss in myeloid cells might affect BCa cell metastatic growth and stem cell (BCSC) self-renewal. Comparing PyMT TKFL/FL and PyMT TKΔMyeloid mice with similar primary BCa tumor weights (Figure 2A), we observed a significant decrease in both the incidence and number of macroscopic lung metastases in PyMT TKΔMyeloid mice compared to PyMT TKFL/FL mice (Figure 2B–D).
Figure 2. RON signaling within myeloid cells promotes BCa cell metastasis and self-renewal.
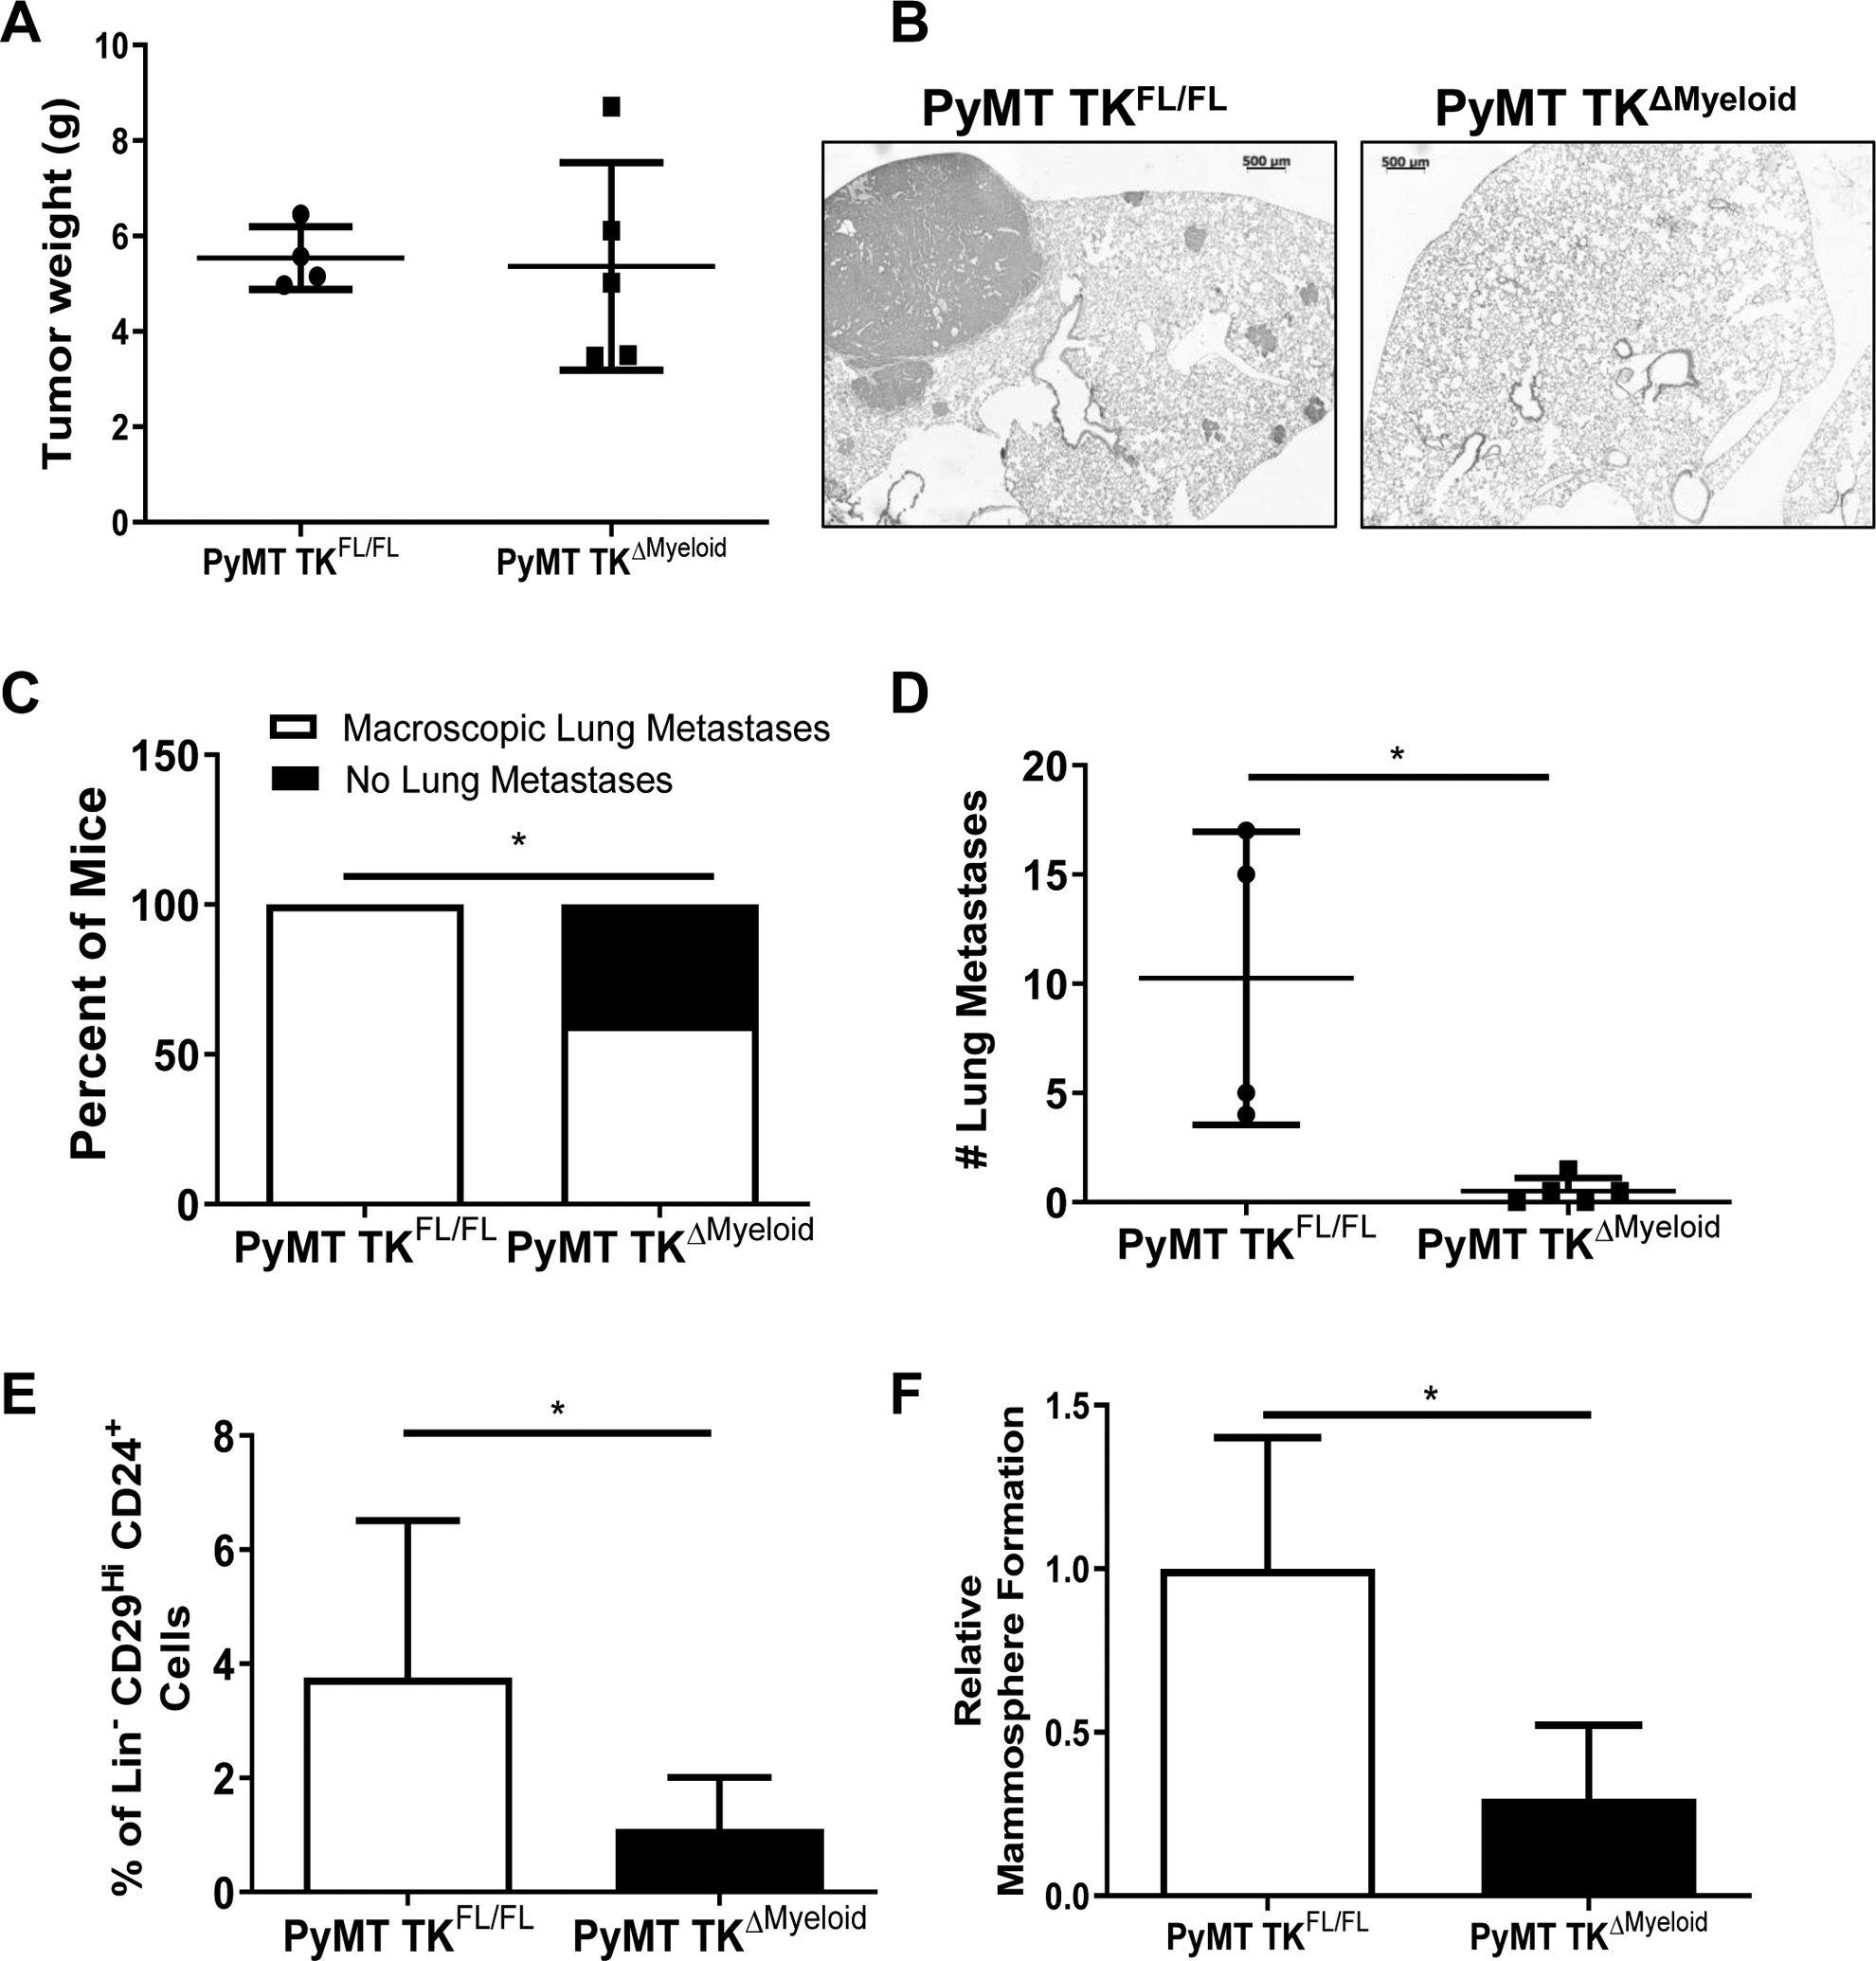
A) Similar tumor weights for PyMT TKFL/FL (n=4) and PyMT TKΔMyeloid (n=5) mice selected for metastases analyses. B) Representative H&E images of lung tissue isolated from PyMT TKFL/FL and PyMT TKΔMyeloid mice. Scale bar=500μm. C) Percent of PyMT TKFL/FL (n=4) and PyMT TKΔMyeloid (n=5) mice from panel A exhibiting macroscopic lung metastases versus no metastasis. D) Number of macroscopic lung metastatic lesions for PyMT TKFL/FL (n=4) and PyMT TKΔMyeloid (n=5) mice from panel A. E) Percentage of Lin−CD29HiCD24+ cells obtained for similar sized PyMT TKFL/FL (n=7) and PyMT TKΔMyeloid (n=8) tumors. F) Relative change in mammosphere formation ability obtained from Lin−CD29HiCD24+ BCSCs cultured from similar sized PyMT TKFL/FL and PyMT TKΔMyeloid tumors (n=6–8). Statistical significance was determined using Student’s t test (C-F). Bars represent average values ± SD. *P<0.05.
BCSCs play a major role in regulating tumor initiation and metastatic progression and their activities have been shown to be supported by TAMs (7, 8). Using similar size-matched tumors from PyMT TKFL/FL and PyMT TKΔMyeloid mice, we found that mammary tumors PyMT TKΔMyeloid had a significant decrease in BCSCs numbers judged by flow cytometry analyses for the expression of BCSC markers Lin−CD29hiCD24+ (Figure 2E) and a decrease in their self-renewal ability as assessed through mammosphere formation assays (Figure 2F).
Macrophage-specific RON signaling sustains BCa growth and survival
We next generated a PyMT model of BCa with a macrophage-specific, tamoxifen inducible ablation of RON, referred to as PyMT TKFL/FL CSF1R-Cre+ mice. Once mammary tumors from these mice reached a volume of ~100mm3, the mice were divided in two groups: 1) control mice without tamoxifen treatment (PyMT TKFL/FL CSF1R-Cre+) and 2) tamoxifen treated mice harboring a deletion of RON TK domain in macrophages (PyMT TKFL/FL CSF1R-Cre+ + Tamo). While tamoxifen is a compound commonly used in the treatment of hormone receptor-positive breast cancer, the low dose administered in this model is not a therapeutic dose, and PyMT TKFL/FL CSF1R-Cre+ mice treated with tamoxifen show similar tumor growth from PyMT TKΔmyeloid mice indicating the observed effect is likely RON-specific (Supplemental Figure S2A).
Tumor growth analyses of macrophage-specific RON signaling loss appear to phenocopy the myeloid deletion model; tamoxifen treated PyMT TKFL/FL CSF1R-Cre+ mice having a significant decrease in tumor kinetics, tumor weight, lung metastasis incidence, and number of macroscopic lung metastases compared to controls (Figure 3A–3D). IHC analyses demonstrated alterations in the TME upon loss of RON signaling in macrophages, with tamoxifen treated PyMT TKFL/FL CSF1R-Cre+ mice showing a significant increase in the recruitment of macrophages overall, iNOS+ cells, and CD8a+ T-cells while also restrained recruitment of Arginase-1+ cells and B220+ B-cells (Figure 3E–3F). To further investigate the ability of RON signaling to drive tumor progression, we treated PyMT wild-type (WT) mice with established tumors with the potent RON inhibitor BMS-777607 beginning at 8 weeks of age (Supplemental Figure S2B). We found that BMS-777607 treatment halted BCa progression compared to the controls.
Figure 3. Macrophage-specific RON signaling sustains BCa growth and survival.
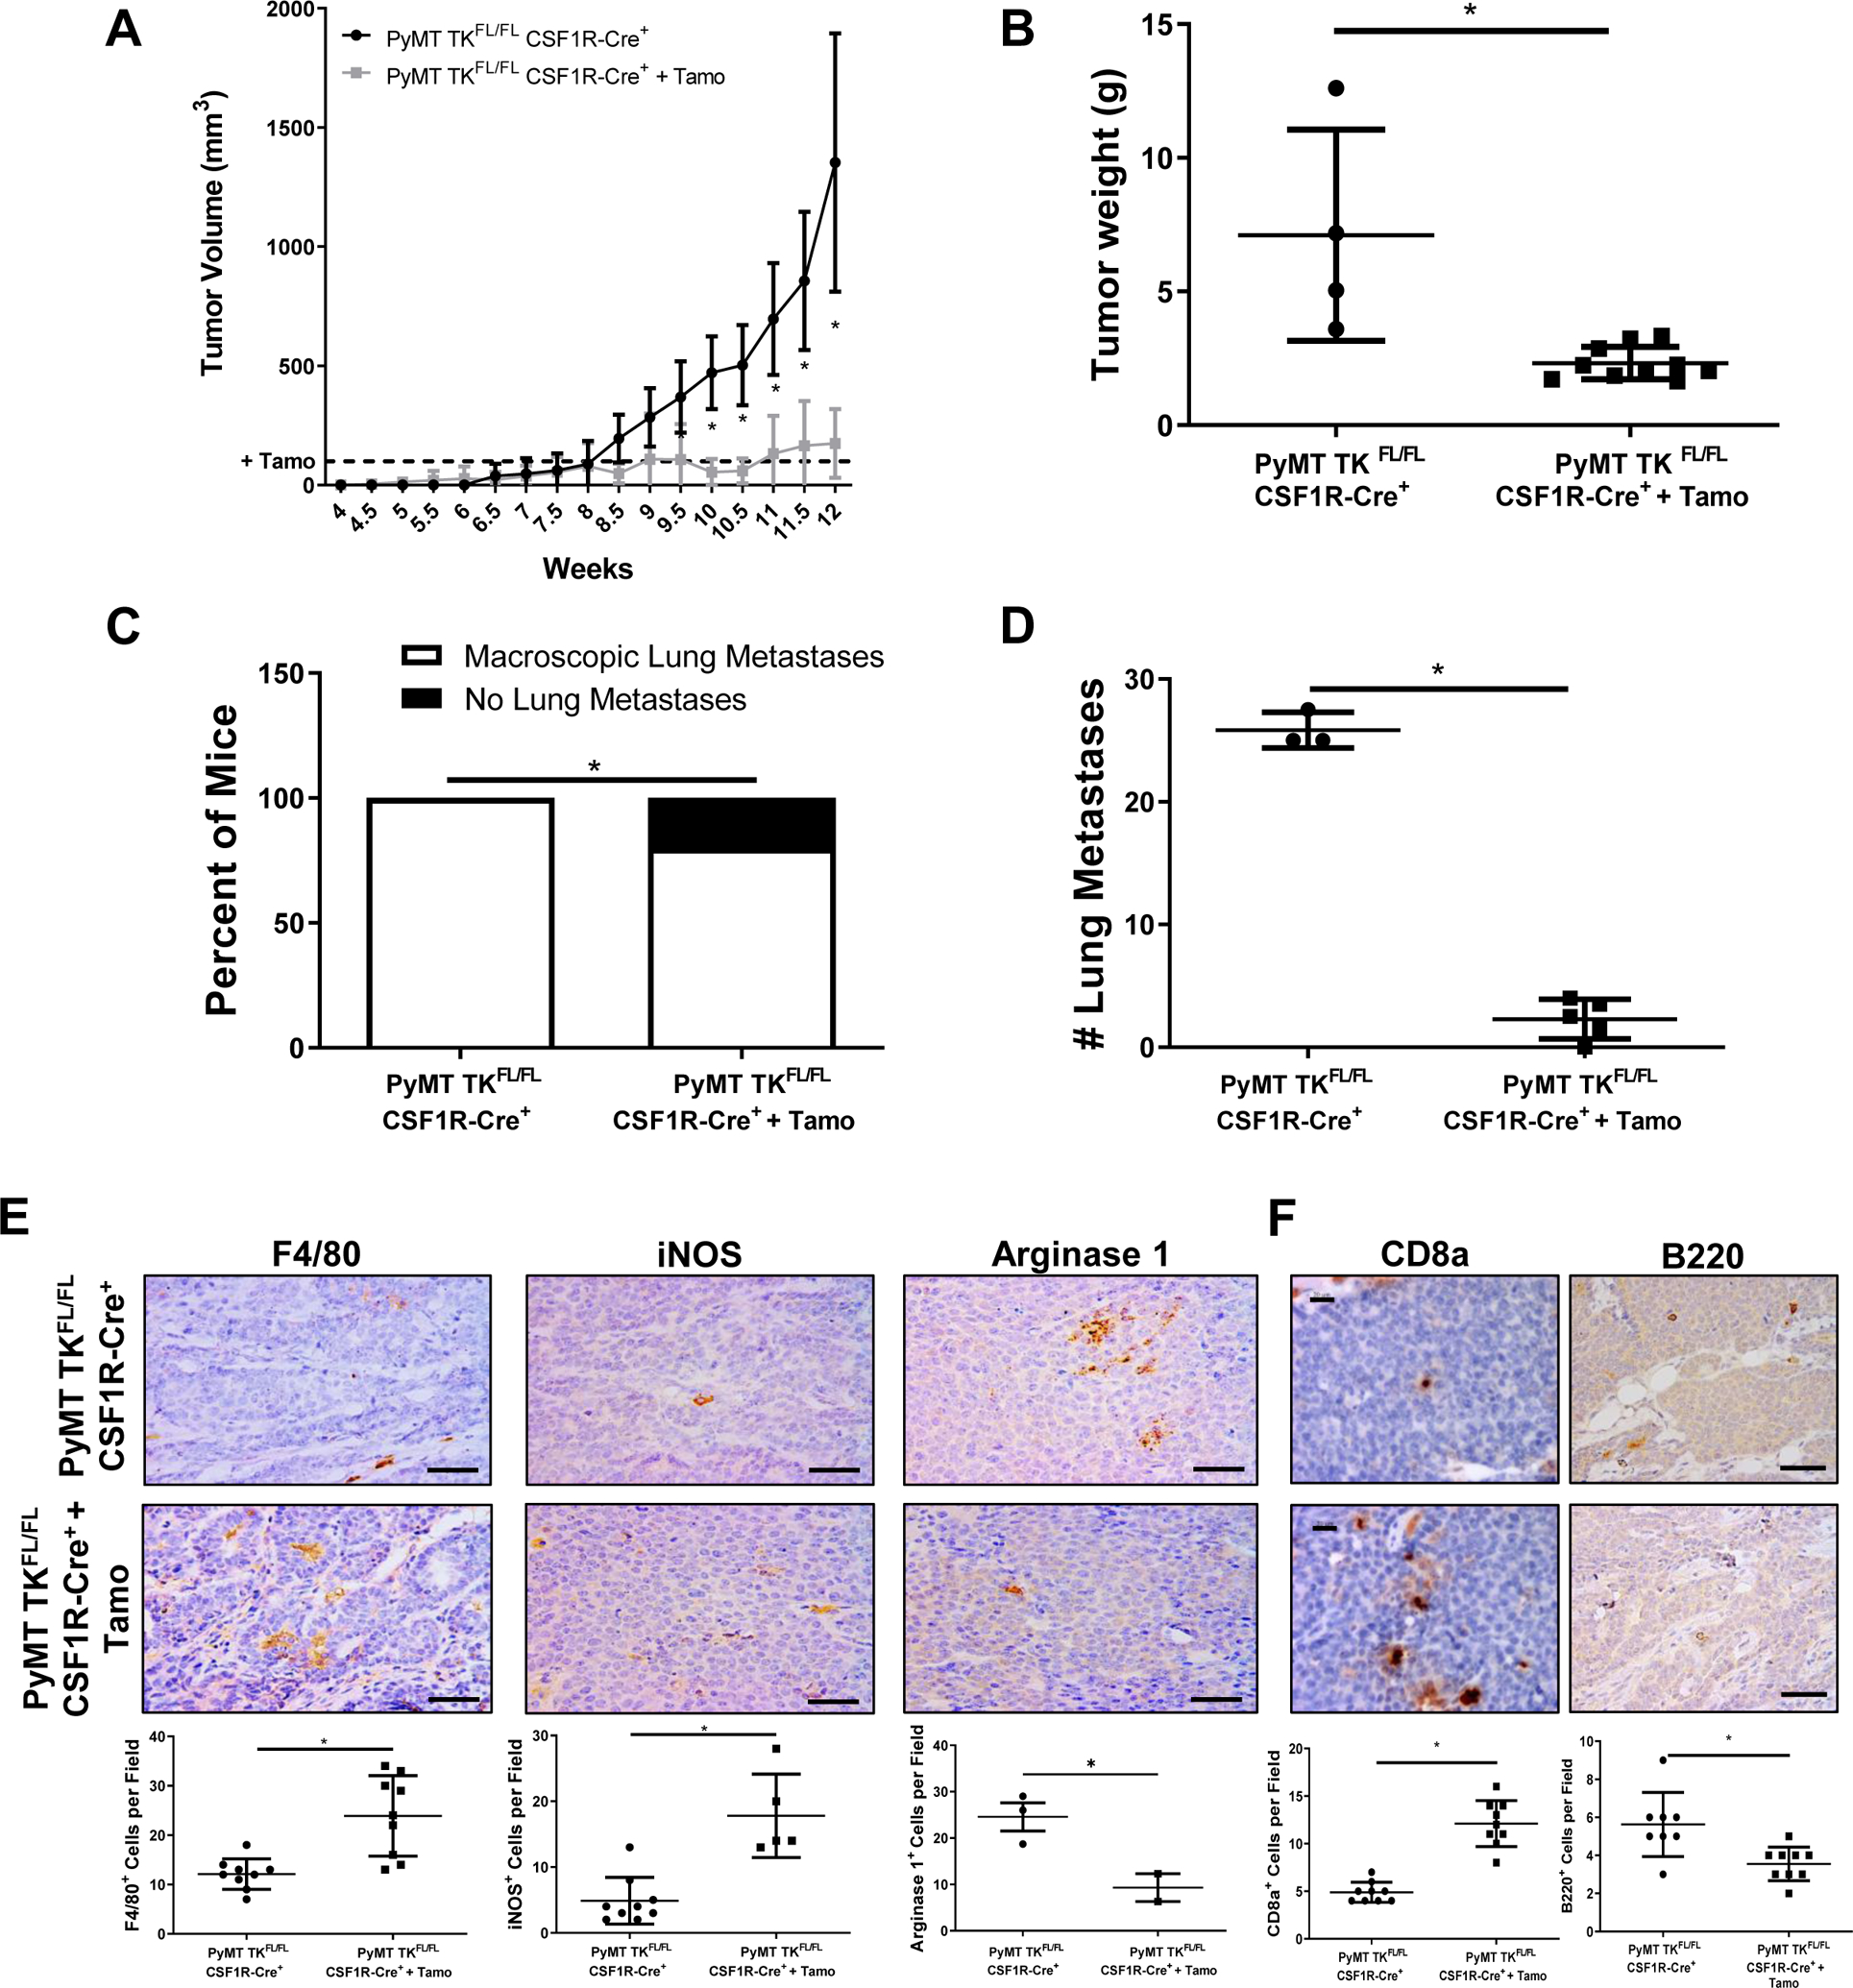
A) Tumor growth curves of PyMT TKFL/FL CSF1R-Cre+ mice with (n=10) and without (n=5) tamoxifen (Tamo) treatment. Tamoxifen treatment was initiated when tumors reached 100mm3(denoted by the dashed line). Statistical significance was determined using a two-way ANOVA with corrected multiple t tests. Data represent average values ± SD. *P<0.05. B) Tumor weights at 90 days for PyMT TKFL/FL CSF1R-Cre+ mice with (n=10) and without (n=5) tamoxifen (Tamo) treatment. C) Percent of PyMT TKFL/FL CSF1R-Cre+ mice with (n=5) and without (n=3) tamoxifen (Tamo) treatment exhibiting macroscopic lung metastases versus no metastasis. Mice evaluated with similar primary tumor weights. D) Number of macroscopic lung metastatic lesions for mice from C. E-F) Representative images and quantifications of PyMT TKFL/FL CSF1R-Cre+ and PyMT TKFL/FL CSF1R-Cre+ + Tamoxifen tumor sections stained for F4/80, iNOS, and Arginase 1 (E); and CD8a and B220 (F). Scale bar=100μm for (E) and Scale bar=20μm (CD8a) or 100μm (B220) (F). Statistical significance was determined using Student’s t test (B-F). Data represent average values ± SD. *P<0.05.
Macrophage RON loss alters macrophage functions to inhibit tumor cell proliferation, survival, migration, and BCSC self-renewal
Using in vitro cocultures of R7 murine BCa cells with M2 polarized BMDMs from either wild-type mice (TK+/+) or RON deficient (TK−/−) mice, we examined the effect of macrophage-specific RON signaling in regulating BCa cell proliferation. R7 BCa cells cocultured with TK−/− BMDMs showed a decrease in BrdU incorporation compared to R7 cells cocultured with TK+/+ BMDMs (Figure 4A and Supplemental Figure S3A). To assess whether factors secreted by BMDMs affect mammary tumor cell proliferation, we cultured R7 cells in conditioned media (CM) obtained from either TK+/+ BMDMs or TK−/− BMDMs. Flow cytometry analyses showed a decrease in BrdU incorporation in R7 cells cultured in TK−/− BMDM CM compared to R7 cells cultured in TK+/+ BMDM CM (Figure 4B and Supplemental Figure S3B), suggesting that loss of RON signaling in macrophages alters the macrophage secretome to inhibit tumor cell proliferation.
Figure 4. Loss of RON signaling in macrophages alters macrophage functions to inhibit tumor cell proliferation, survival, migration, and self-renewal.
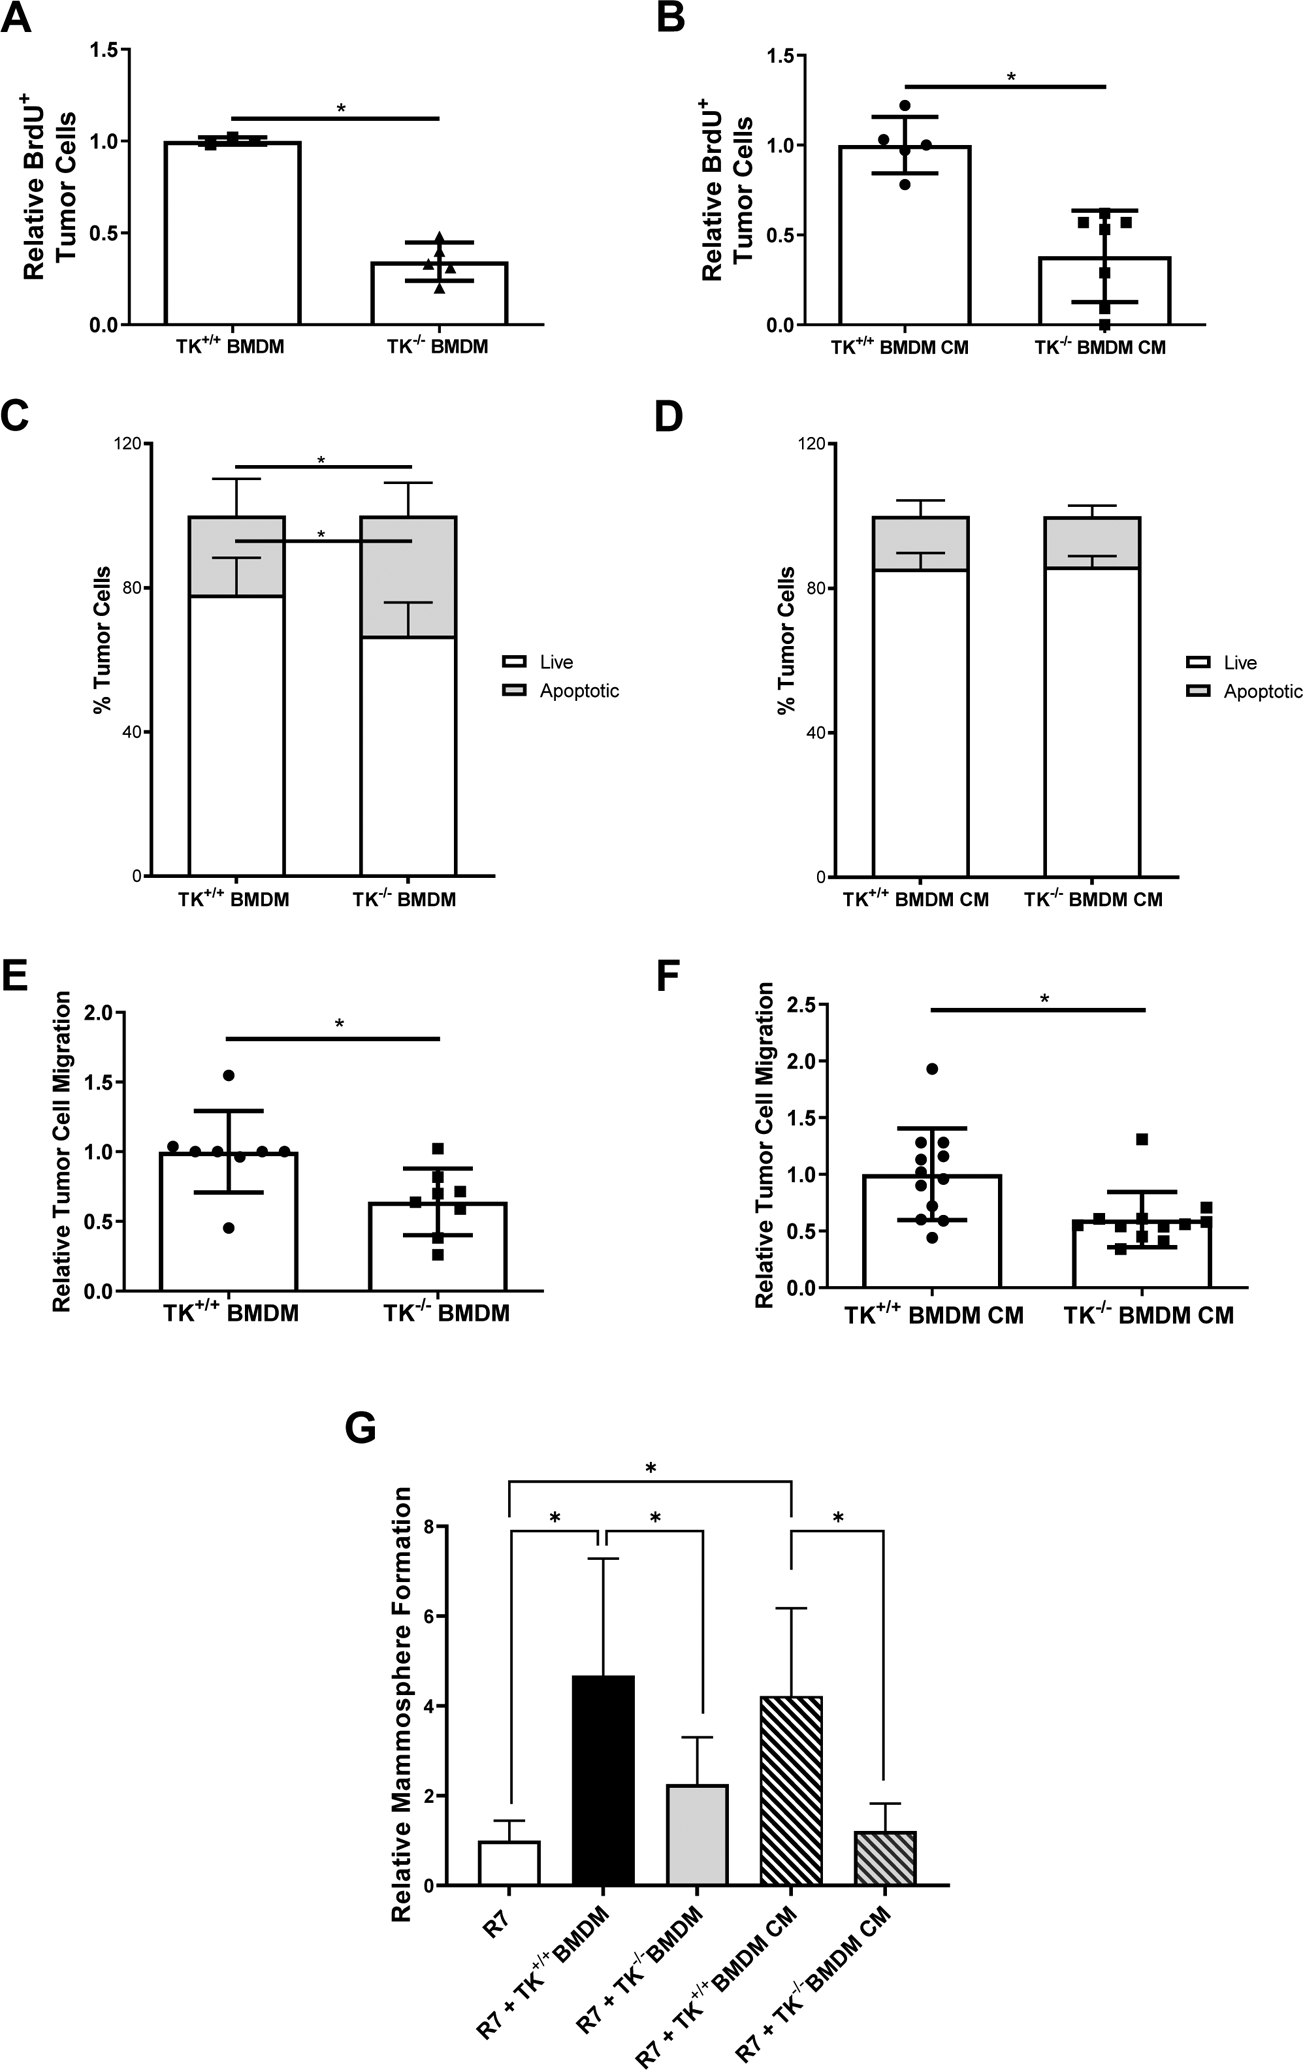
A-B) Relative BrdU positive R7 BCa cells when co-cultured with TK+/+ bone marrow derived macrophages (BMDMs) or TK−/− BMDMs (A) and TK+/+ BMDM conditioned media (CM) or TK−/− BMDM CM (B). Relative numbers represent the number of BrdU positive R7 BCa cells present in each experimental condition normalized to the number of BrdU positive R7 BCa cells present in its respective control group. (n=3). C) Annexin V/Propidium Iodide flow cytometry analysis showing the percent of R7 BCa cells that are viable (Live) or that are in early apoptosis, late apoptosis, or dead (Apoptotic) after co-culture with TK+/+ BMDMs or TK−/− BMDMs (n=3). D) Annexin V/Propidium Iodide flow cytometry data showing the percent of R7 BCa cells that are viable (Live) or that are in early apoptosis, late apoptosis, or dead (Apoptotic) after culture with TK+/+ BMDM CM or TK−/− BMDM CM (n=3). E-F) Relative R7 BCa cell migration toward TK+/+ BMDMs or TK−/− BMDMs (E) and TK+/+ BMDM CM or TK−/− BMDM CM (F) (n=3–6). G) Relative mammosphere formation of R7 cells cultured alone or co-cultured with TK+/+ BMDMs, TK−/− BMDMs, TK+/+ BMDM CM, or TK−/− BMDM CM (n=3). Statistical significance was determined using Student’s t-test (A-F) and a one-way ANOVA (G). Bars represent average values ± SD. * P<0.05.
In addition to promoting the activation and recruitment of other immune cells to induce tumor cell death, pro-inflammatory macrophages also possess cytotoxic functions to directly induce tumor cell death (39, 40). Studies of R7 cells cocultured with TK+/+ BMDMs or TK−/− BMDMs were performed to examine whether RON signaling within macrophages regulates BCa cell survival. Flow cytometry analyses for the expression of Annexin V and Propidium Iodide (PI) showed an increase in the percent of R7 cells undergoing apoptosis when cocultured with TK−/− BMDMs compared to R7 cells cocultured with TK+/+ BMDMs (Figure 4C). To support the effects of secretory versus direct contact mechanisms, the same experiment was performed with BMDM conditioned media (TK+/+ BMDM CM, or TK−/− BMDM CM) (Figure 4D). No differences were observed in tumor cell death suggesting that loss of macrophage RON may promote tumor cell death via mechanisms that require close proximity (e.g., phagocytic mechanisms).
We next examined BCa cell migration by performing transwell assays of R7 BCa cells migrating towards TK+/+ BMDMs, TK−/− BMDMs, TK+/+ BMDM CM, or TK−/− BMDM CM (Figure 4E–4F). A decrease in R7 migration towards either TK−/− BMDMs or TK−/− BMDM CM was identified compared to their respective controls. We also performed mammosphere formation assays of R7 cells alone or cultured with either TK+/+ BMDMs, TK−/− BMDMs, TK+/+ BMDM CM, or TK−/− BMDM CM (Figure 4G). We observed a significant increase in the mammosphere formation ability of the R7 cells when cultured with either TK+/+ BMDMs or TK+/+ BMDM CM, while TK−/− BMDMs and TK−/− BMDM CM had no significant effect on the mammosphere formation ability of the R7 cells, suggesting that macrophage-specific RON signaling supports BCSC self-renewal and maintenance in part via secretion of a soluble factor(s). Data from this in vitro system support results shown in Figures 1–2 and suggests that macrophage RON signaling supports the production of soluble mediators that enhance BCSC self-renewal and tumor cell proliferation, survival, and migration.
RON expression in macrophages supports a secretome that directs immunomodulatory pathways including production of IL-12 family members
We next performed RNA-Sequencing (RNA-Seq) analyses on M2 TK+/+ and TK−/− BMDMs to identify unique changes in gene expression associated with RON loss. 1,890 differentially expressed genes were identified with a 5-fold change threshold, with 1,194 genes upregulated and 696 downregulated upon RON loss (Figure 5A). Pathway enrichment analysis revealed that TK−/− BMDMs have a gene expression signature associated pro-inflammatory anti-tumor responses and phagocytosis (39) and containing increases in insulin-like growth factor (IGF) signaling, cholesterol biosynthesis, peroxisome proliferator-activated receptor (PPAR) signaling, and nitrogen metabolism (Figure 5A and Table 1) Downregulated signatures in TK−/− BMDMs included decreases in cytokine signaling pathways (including IL-10, IL-12, IL-4, IL-13, NF-κB, IL-17, IL-23, IL-27, and Wnt signaling pathways). Macrophage RON loss was also associated with decreases in interferon signaling, TNF signaling, and pattern-recognition receptor signaling pathways (such as NOD-like Receptor Signaling and Toll-like Receptor Signaling).
Figure 5. RON signaling in macrophages alters the macrophage secretome to support immunomodulatory pathways and the production of IL-12 family members.
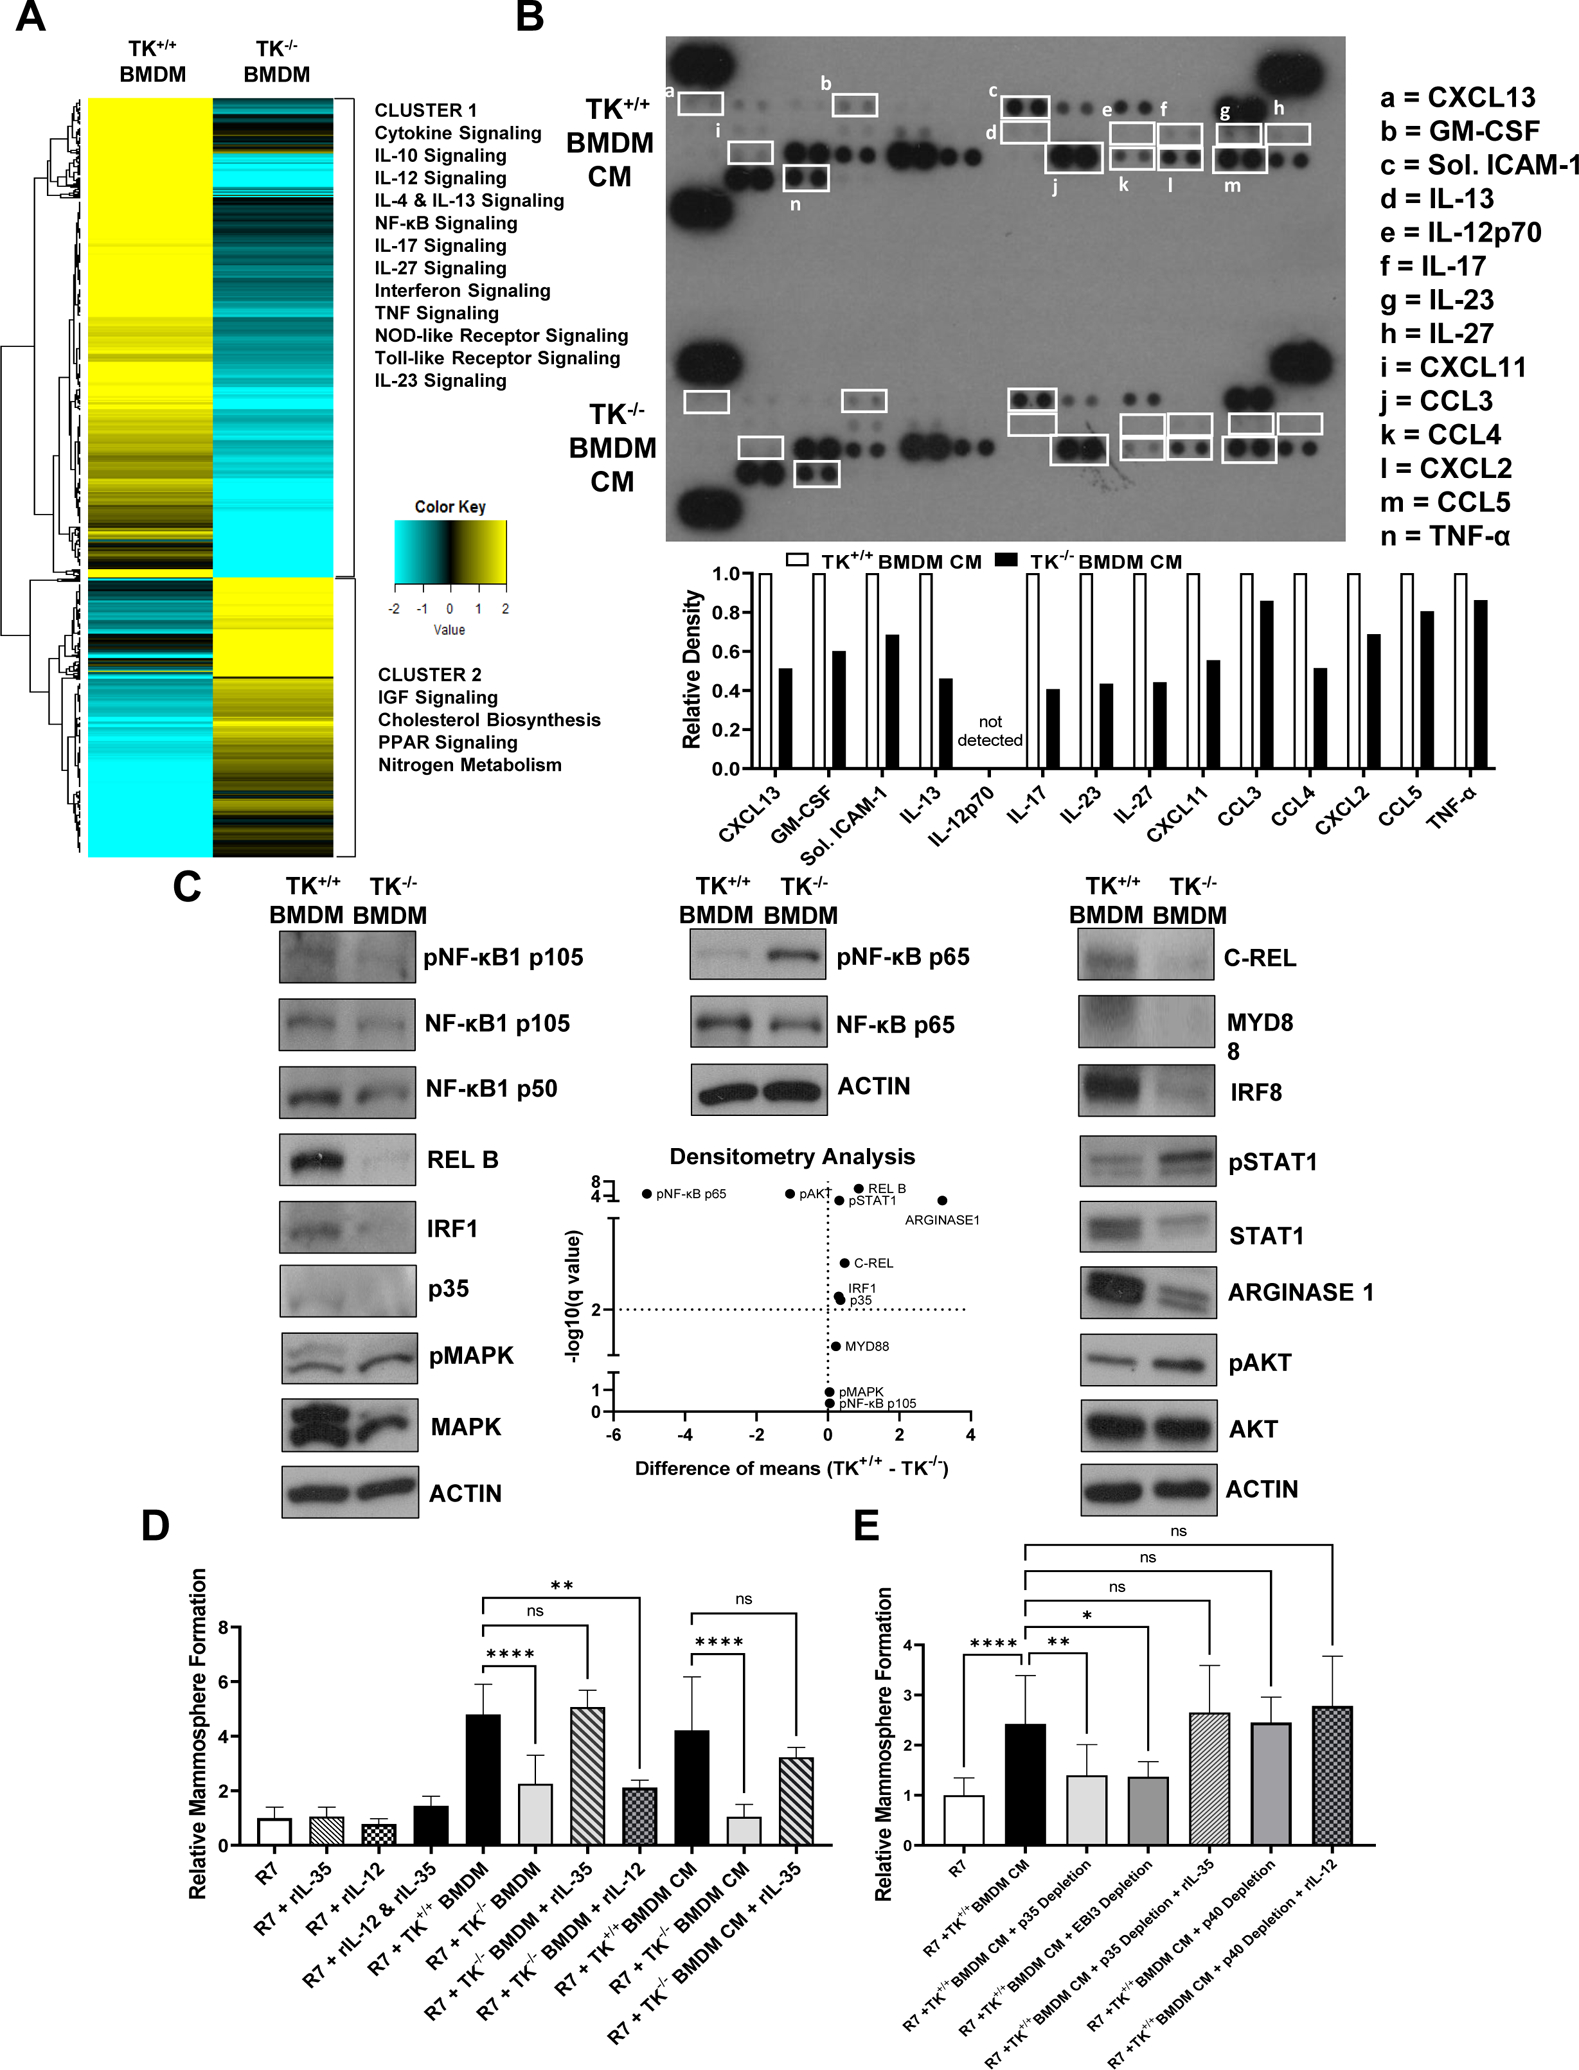
A) Gene expression profile for TK+/+ BMDMs and TK−/− BMDMs. Heatmap shows normalized gene expression values for genes with > 5-fold change in expression in TK−/− BMDMs compared to TK+/+ BMDMs. Group clusters and the pathways associated with each cluster are shown. See Table 1 for additional information. B) Representative cytokine array proteome profile of conditioned media obtained from TK+/+ BMDMs and TK−/− BMDMs. Cytokines of interest with differential expression are shown in white boxes for both samples and identified from a to n. A legend containing the name of each cytokine and their respective densitometry analyses are included (n=3). C) Representative Western blot images showing the expression of phosphorylated NF-κB1 p105, NF-κB1 p105, NF-κB1 p50, REL-B, IRF1, p35, phosphorylated MAPK, MAPK, phosphorylated NF-κB p65, NF-κB p65, C-REL, MYD88, IRF8, phosphorylated STAT1, STAT1, Arginase-1, phosphorylated AKT, AKT, and ACTIN in TK+/+ BMDMs and TK−/− BMDMs whole cell lysates. ACTIN is included for each individual membrane (n=3). Densitometry analyses are included in the Volcano plot. D) Relative mammosphere formation of R7 BCa cells cultured alone with or without recombinant IL-35 (rIL-35), recombinant IL-12 (rIL-12) or cultured with TK+/+ BMDMs, TK−/− BMDMs, TK+/+ BMDM CM, or TK−/− BMDM CM with or without rIL-35 (n=6). E) Relative mammosphere formation of R7 BCa cells cultured alone or cultured with TK+/+ BMDM CM, TK+/+ BMDM CM + p35 depletion, TK+/+ BMDM CM + EBI3 depletion, or TK+/+ BMDM CM + p35 depletion + rIL-35 or TK+/+ BMDM CM + p40 depletion, and TK+/+ BMDM CM + p40 depletion + rIL-12 (n=6). Statistical significance was determined using Multiple t-test (C) and a one-way ANOVA (D-E). Bars represent average values ± SD. * P<0.05.
Table 1.
Top pathways upregulated and downregulated in TK−/− BMDMs compared to TK+/+ BMDMs.
| Cluster | Characteristic | Pathway (adjusted P-value) |
Gene Symbol |
|---|---|---|---|
| 1 | Downregulated in TK−/− BMDMs | Cytokine Signaling (P=1.47E-47) |
Cnksr1, Ereg, Adar, Met, Ptk2b, Saa1, Nod1, Hist1h3c, Fcgr1, Ciita, Fga, Fgf5, Ccl2, Ccl3, Ccl4, Ccl5, Mmp3, Ccl20, Mmp9, Ccl22, Flnb, Flt3, Batf, Fpr1, Ifitm1, Birc3, Il23a, Tnfsf11, Oasl1, Socs1, Fscn1, Mx1, Mx2, Myd88, Tnfrsf25, Tnfsf9, Il1f6, Src, Ripk2, Gbp2, Gbp3, Trim21, Il18rap, Gfra1, Stat1, Stat5a, Nod2, Gbp4, Gbp5, Sqstm1, Nfkb1, Nfkb2, Nos2, Il33, Zeb1, Tnfsf18, Socs3, Oas2, Oas3, Grin2c, Cxcl1, Cxcl2, Cd86, Tnfsf8, Dusp16, Cd40, Tnf, Tnfrsf1b, Il1f9, Hck, Il27, Usp18, Hif1a, Ube2l6, H2-Q10, Ddx58, Pdgfb, H2-Ab1, H2-Ea-ps, H2-Eb1, H2-T23, Gm11127, Tnfsf4, Uba7, Pim1, Il17ra, Vcam1, Cntfr, Pml, Icam1, Irf8, Samhd1, Ifi35, Ifit2, Ifit1, Ifit3, Ifnb1, Rsad2, Csf2, Csf3, Isg15, Xaf1, Rapgef2, Il1a, Il1b, Il1rn, Il2ra, Eif2ak2, Il6, Il10, Il10ra, Il11, Il12a, Il12b, Il12rb2, Il15, Il15ra, Gbp10, Il18, Prtn3, Trim25, Gbp7, Cxcl10, Irak2, Irf1, Irf5, Irf7, Ptafr, Ptgs2, Junb, Il1r2, Tnfsf15, Kpna3, Dusp2, Dusp5, Peli1, Relb, Il18bp, Lck, Lcn2, Lif, Fgf23, Ebi3, Egr1, Rasa4, Lyn, Cxcl9, Ccl17, Cxcl11, Cxcl5, Cx3cl1, Fas, Tnfsf10, Cxcr3, Cxcl16, Cxcl3, Tgfb2, Ccr7, Ccr8, Inhba, Fst, Areg, Gdf2, Ngf, Tdgf1, Wnt5b, Wnt1, Wnt10b, Wnt11, Scube3, Fgfbp1, Ccrl2 |
| IL-10 Signaling (P=2.01E-25) |
Ccl2, Ccl3, Ccl4, Ccl5, Ccl20, Ccl22, Fpr1, Cxcl1, Cxcl2, Cd86, Tnf, Icam1, Csf2, Csf3, Il1a, Il1b, Il1rn, Il6, Il10, Il10ra, Il12a, Il12b, Il18, Cxcl10, Ptafr, Ptgs2, Il1r2, Lif | ||
| Interferon Signaling (P=3.39E-22) |
Adar, Fcgr1, Ciita, Flnb, Ifitm1, Oasl1, Socs1, Mx1, Mx2, Gbp2, Gbp3, Trim21, Stat1, Gbp4, Gbp5, Socs3, Oas2, Oas3, Usp18, Ube2l6, H2-Q10, Ddx58, H2-Ab1, H2-Ea-ps, H2-Eb1, H2-T23, Gm11127, Uba7, Vcam1, Pml, Icam1, Irf8, Samhd1, Ifi35, Ifit2, Ifit1, Ifit3, Ifnb1, Rsad2, Isg15, Xaf1, Eif2ak2, Gbp10, Trim25, Gbp7, Irf1, Irf5, Irf7, Ptafr, Kpna3, Egr1, Saa1, Nlrc5, Myd88, Ifih1, Nfkb1, Nfkb2, Nfkbia, Nfkbib, Tnfaip3, Dhx58, Ikbke, Rnf125 | ||
| TNF Signaling (P=2.16E-21) |
Ccl2, Ccl5, Mmp3, Ccl20, Mmp9, Mmp14, Cxcl5, Cx3cl1, Sele, Birc3, Fas, Bcl3, Nod2, Cflar, Mlkl, Nfkb1, Nfkbia, Socs3, Cxcl1, Cxcl2, Cxcl3, Tnf, Tnfaip3, Tnfrsf1b, Traf1, Cebpb, Vcam1, Icam1, Csf2, Il1b, Il6, Il15, Cxcl10, Ptgs2, Junb, Edn1, Lif | ||
| IL-12 Signaling (P=6.51E-16) |
Ccl3, Ccl4, Socs1, Gadd45b, Ripk2, Il18rap, Stat1, Stat4, Stat5a, Nfkb1, Nfkb2, Nos2, Cd8b1, Gzmb, H2-Q10, H2-Ea-ps, Il1b, Il2ra, Il12a, Il12b, Il12rb2, Il18, Relb, Lck | ||
| NOD-like Receptor Signaling (P=6.02E-15) |
Mefv, Nod1, Ccl2, Ccl5, Birc3, Nox1, MyD88, Ripk2, Gbp2, Gbp3, Stat1, Nod2, Gbp4, Gbp5, Nfkb1, Nfkbia, Nfkbib, Camp, Casp4, Oas2, Oas3, Cxcl1, Cxcl2, Cxcl3, Tnf, Tnfaip3, Ifi205, Nlrp6, Ifnb1, Ikbke, Il1b, Il6, Cybb, Il18, Gbp7, Irf7, Nlrp3, Nampt, Adar, Ccl4, Il33, Trex1, Ddx58, Zbp1, Cxcl10 | ||
| IL-4 & IL-13 Signaling (P=4.54E-14) |
Saa1, Ccl2, Mmp3, Mmp9, Ccl22, Batf, Il23a, Socs1, Fscn1, Stat1, Nos2, Zeb1, Socs3, Tnf, Tnfrsf1b, Hif1a, Pim1, Vcam1, Icam1, Il1a, Il1b, Il6, Il10, Il12a, Il12b, Il18, Ptgs2, Junb, Lcn2, Lif | ||
| IL-23 Signaling (P=5.44E-13) |
Cxcl9, Ccl2, Il23a, Il18rap, Stat1, Stat4, Stat5a, Nfkb1, Nfkbia, Nos2, Socs3, Cxcl1, Tnf, Il1b, Il6, Il12b, Il18 | ||
| NF-κB Signaling (P=8.42E-13) |
Ccl4, Birc3, Tnfsf11, MyD88, Gadd45b, Bcl2a1a, Cflar, Malt1, Nfkb1, Nfkb2, Nfkbia, Cxcl2, Cd14, Cd40, Tnf, Tnfaip3, Traf1, Ddx58, Vcam1, Icam1, Il1b, Trim25, Ptgs2, Relb, Lck, Lyn, Nfkbib, Nfkbie, Rel | ||
| IL-17 Signaling (P=2.54E-11) |
Ccl2, Ccl17, Mmp3, Ccl20, Mmp9, Mmp13, Cxcl5, Nfkb1, Nfkbia, Cxcl1, Cxcl2, Cxcl3, Tnf, Tnfaip3, Cebpb, Il17ra, Csf2, Csf3, Ikbke, Il1b, Il6, Cxcl10, Ptgs2, Lcn2 | ||
| Toll-like Receptor Signaling (P=5.24E-11) |
Cxcl9, Ccl3, Ccl4, Ccl5, Cxcl11, Myd88, Stat1, Nfkb1, Nfkbia, Tlr9, Cd14, Cd86, Tlr2, Tlr3, Cd40, Tnf, Ifnb1, Ikbke, Il1b, Il6, Il12a, Il12b, Cxcl10, Irf5, Irf7 | ||
| IL-27 Signaling (P=1.42E-9) | Stat1, Stat4, Stat5a, Tnf, Il27, Il1b, Il6, Il12a, Il12b, Il12rb2, Il18, Ebi3 | ||
| 2 | Upregulated in TK−/− BMDMs | Insulin-like Growth Factor Signaling (P=1.01E-5) |
Igf1, Igfbp2, Igfbp5, Igfbp6, Irs1, Klk1b1 |
| Cholesterol Biosynthesis (P=9.56E-5) |
Acat2, Mvd, Dhcr7, Dhcr24, Lss, Soat2, Cyp2r1 | ||
| PPAR Signaling (P=1.45E-4) |
Rxra, Acsl3, Scd1, Plin5, Fads2, Plin4, Slc27a6, Pparg, Ehhadh | ||
| Nitrogen Metabolism (P=2.12E-4) |
Ankrd1, Cth, Car4, Car6, Hal |
Gene expression for several of the molecules involved in the immunomodulatory pathways were validated using cytokine array profiling and western blot analyses (Figures 5B–C). Cytokine profile analysis of CM from TK+/+ BMDMs and TK−/− BMDMs showed decreased production of GMCSF, soluble ICAM1, IL-13, IL-17, IL-23, IL-27, CXCL11, CCL3, CCL4, CXCL2, CCL5, and TNF-α in TK−/− BMDM CM compared to TK+/+ BMDM CM (Figure 5B). Decreased CXCL13 production, a key B cell chemoattractant, was also observed in TK−/− BMDMs controls and may be a mechanism to regulate B cell infiltration.
Several cytokines upregulated in TK+/+ BMDMs belong to the IL-12 family. Signaling molecules such as NF-κB1 p105, NF-κB1 p50, C REL, MYD88, IRF1, and IRF8 stimulate IL-12 family member expression, whereas NF-κB p65 is inhibitory (41–43). We observed a decrease in the expression of p35 (Il12a), Ebi3, Nfkb1, Myd88, c Rel (Rel), Irf1, Irf8, Stat1, and Stat4 in TK−/− BMDMs compared to TK+/+ BMDMs in our RNA-Seq analyses (Figure 5A and Table 1). Western blot analyses also confirmed decreases in the expression of C-REL, IRF1, IRF8, p35, and STAT1 and increases in the expression of phosphorylated NF-κB p65 in TK−/− BMDMs compared to controls (Figure 5C). In addition, we identified changes in key proteins involved in macrophage polarization, with TK−/− BMDMs showing decreases in Arginase-1 expression and increases phosphorylated AKT compared to RON expressing controls (Figure 5C) supporting the premise that RON activation drives IL-12 family member expression and suggests it supports an M2-like pro-tumorigenic polarization state in macrophages.
We next asked if IL-12 family members could functionally rescue the mammosphere formation defect observed in R7 cells when cultured with TK−/− BMDMs or TK−/− BMDM CM. Given the consistent changes in p35 at a transcript and protein level, we first evaluated the two IL-12 family members that p35 comprises, IL-12 (p35 + p40) and IL-35 (p35 + EBI3) in the capacity to rescue mammosphere formation when R7 cells are co-cultured with TK−/− BMDM. Intriguingly, supplementation of recombinant IL-35 (rIL-35) or recombinant IL-12 (rIL-12) to R7 cells grown alone in mammosphere media had no effects on their mammosphere formation ability (Figure 5D). However, the mammosphere formation ability defect observed in R7 cells cultured with TK−/− BMDMs or TK−/− BMDM CM was rescued with rIL-35 administration and is comparable to that observed for R7 cells cultured with TK+/+ BMDMs or TK+/+ BMDM CM, suggesting that other macrophage-derived factors may be required for tumor cells to respond to IL-35. Dual treatment with rIL-35 and rIL-12 without BMDM co-culture or CM showed a slight increase in the mammosphere formation ability although non-significant suggesting IL-12 in conjunction with IL-35 is not sufficient to augment mammosphere formation ability. Supplementation of R7 co-culture with TK−/− BMDM with rIL-12 was not able to rescue the defect in mammosphere formation ability, further suggesting IL-12 does not play a role in this mechanism.
To further examine the role of IL-35 in promoting BCa cell mammosphere formation, we depleted IL-12/IL-35 subunits p35, EBI3, and p40 from TK+/+ BMDM CM and supplemented with rIL-35 (Figure 5E). Supplemental Figure S4A shows the depletion status of the IL-12 family members, Supplemental Figure S4B shows the resulting levels of each target in the CM samples after depletion, and Supplemental Figure S4C further demonstrates the extent of depletion by performing a secondary pull-down on immunodepleted samples and yielding drastically reduced levels. Attempted depletion of p28 showed no signal in the bead pull down, suggesting p28 is unlikely to participate in this mechanism. Importantly, we show that mammosphere formation of R7 cells cultured with p35-depleted or EBI3-depleted TK+/+ BMDM CM was significantly decreased compared to the R7 cells cultured with TK+/+ BMDM CM control group. Moreover, this phenotype is rescued with rIL-35 administration to the p35-depleted TK+/+ BMDM CM group even in the absence of IL-12 (which shows reduced levels even when p35 is depleted). Depletion of the p40 subunit showed no impact on the mammosphere formation ability, and rIL-12 treatment on top of depletion showed the same results (Figure 5E).
Patients with high RON and IL-35 have poorer survival outcomes
Finally, we examined the clinical relevance of IL-35 subunits IL12A and EBI3 in relapse-free survival and distant metastasis-free survival in BCa patients in RON expressing tumors. This dataset was previously utilized to showed significantly poorer outcomes for patients with RON expression (44). Using a sliding cutoff approach to guide gene expression cutoff (denoted by red lines) based on P-value and HR value, in patients with RONHigh tumors, IL12AHigh tumor stratification showed significantly poorer relapse-free survival and distant metastasis-free survival compared to IL12ALow tumors (Figure 6A). Interrogation of survival in patients with EBI3High versus EBI3Low RON expressing tumors showed no significant difference under Log Rank statistics. Inspection of the P-value and HR value sliding cutoff plot revealed an unbalanced stratification of samples that may be due to a lack of power or unusual distribution of EBI3 expression (Figure 6B).
Figure 6. Breast cancer patients with high RON and IL12A (p35) expression have poorer relapse-free survival and distant metastasis-free survival.
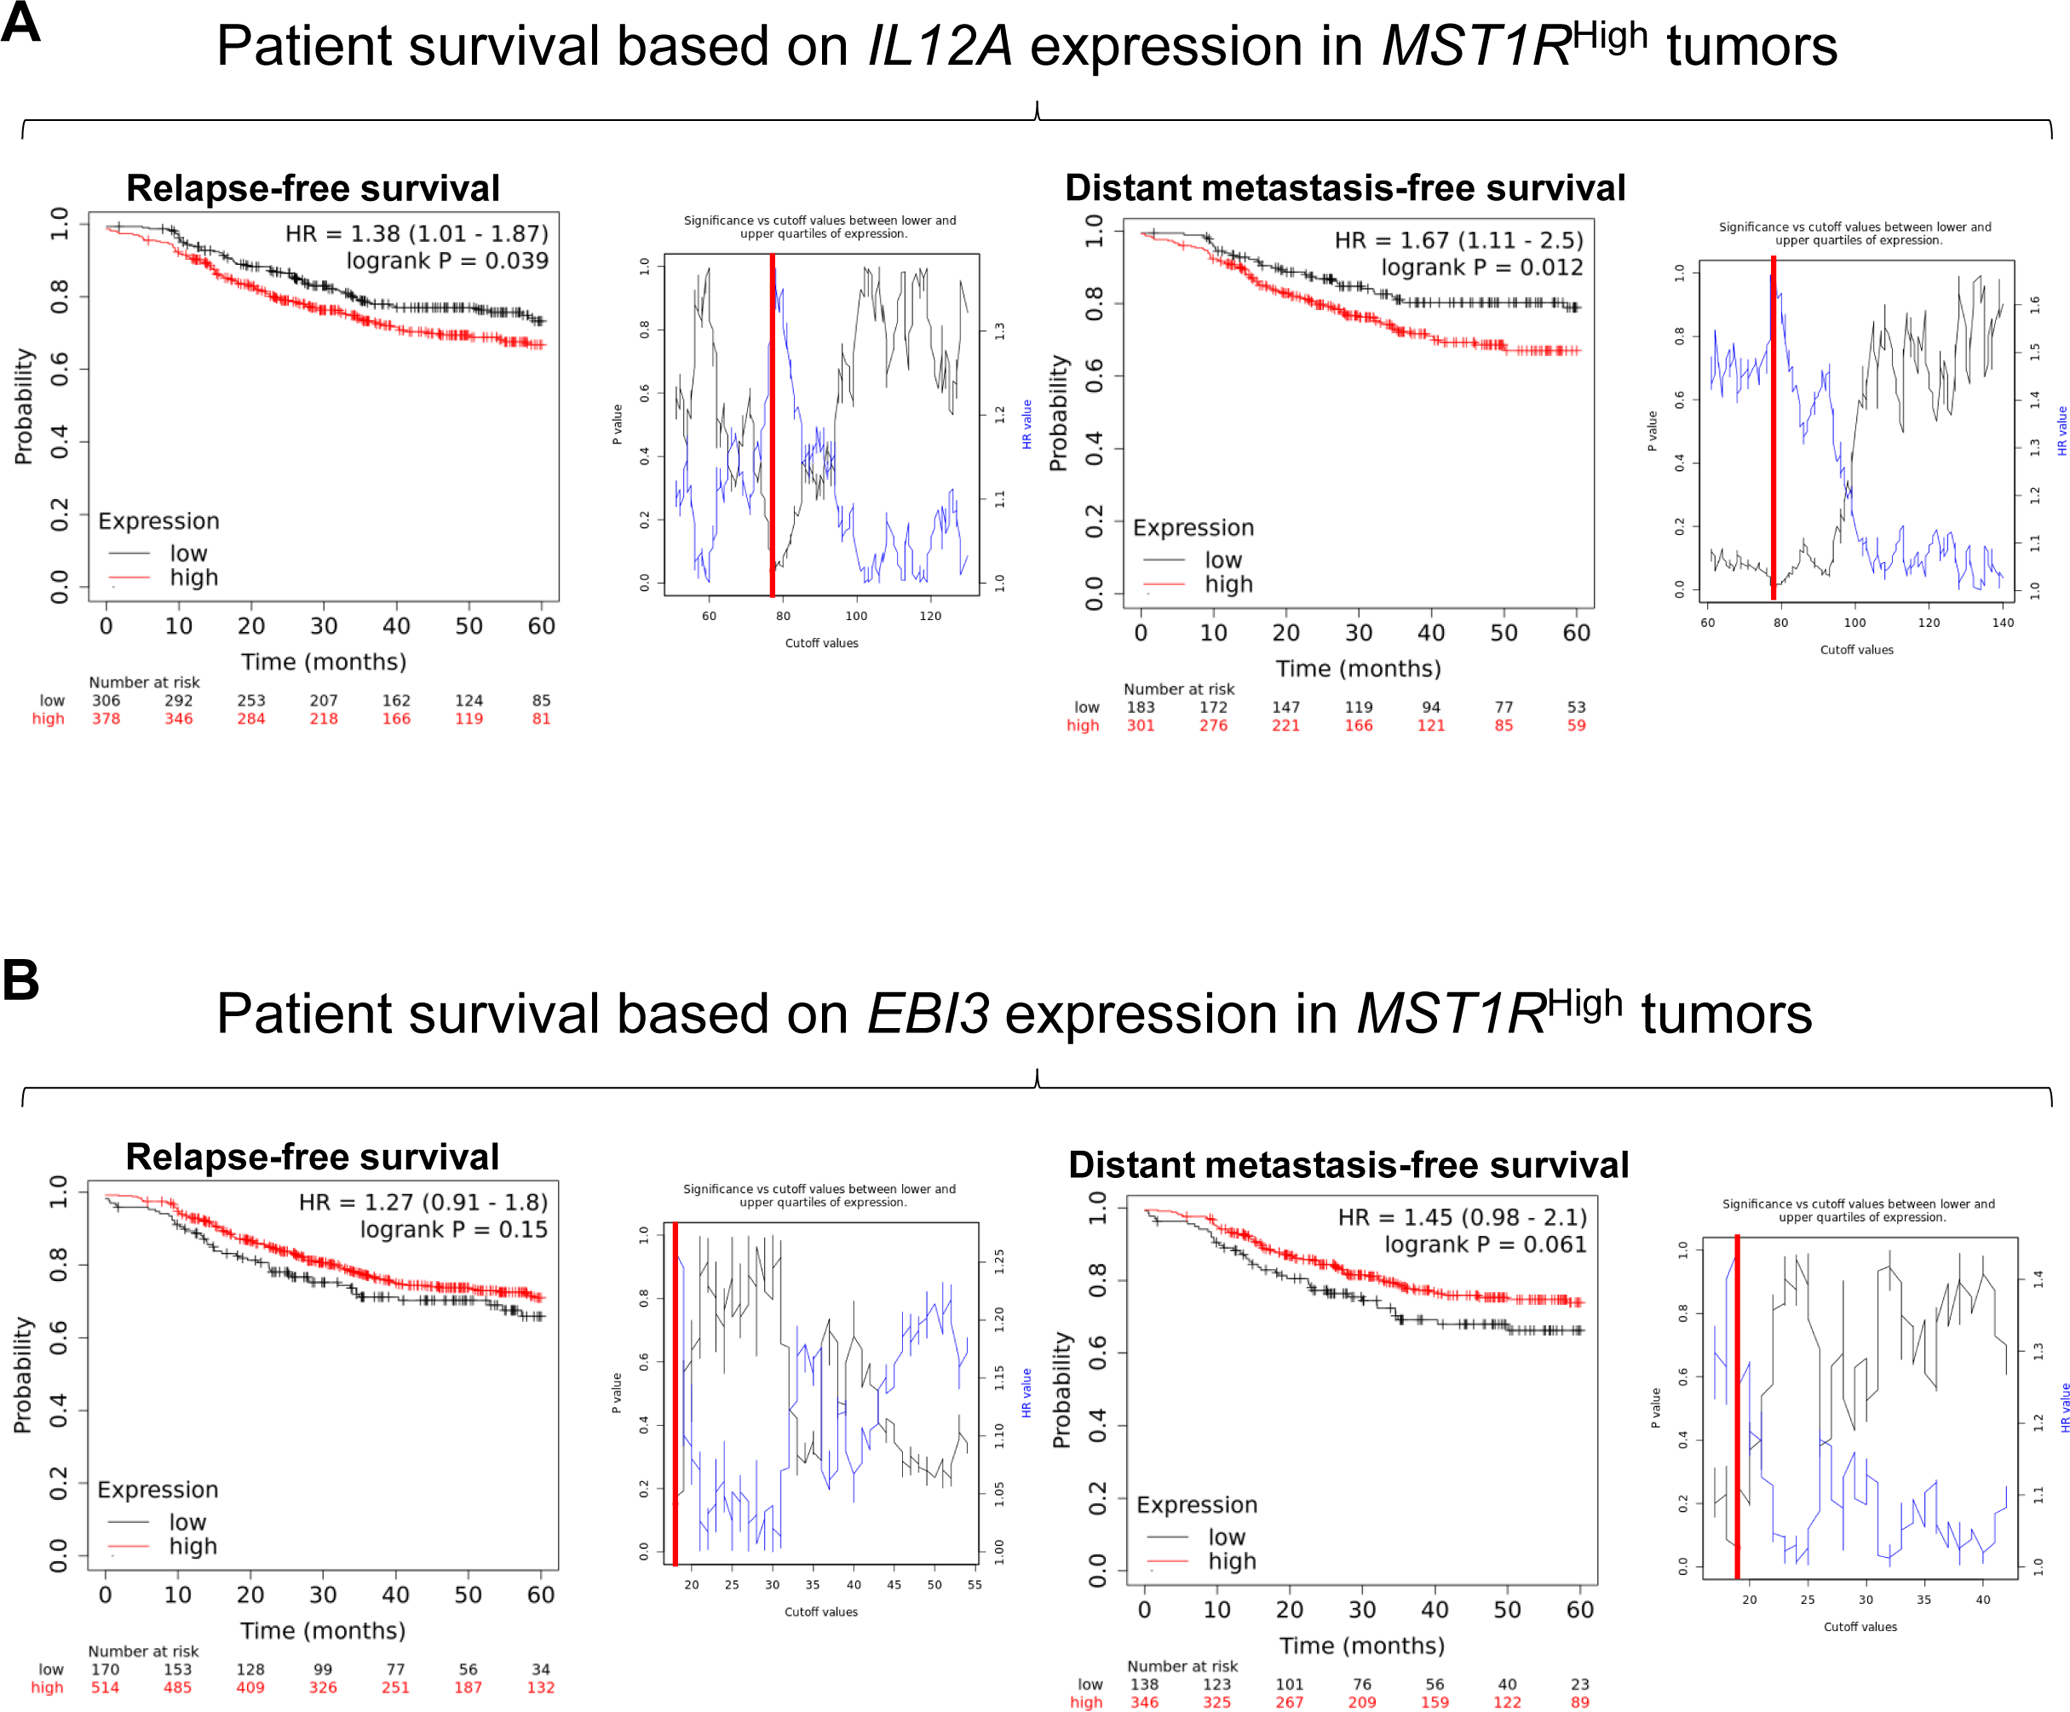
Patients with high RON expression stratified into A) IL12AHigh and IL12ALow groups or B) EBI3High and EBI3Low groups using a sliding cutoff (shown to the right of each Kaplan-Meier curve, cutoff value in red) for relapse-free survival (left), and distant metastasis-free survival (right).
Discussion
Several studies have demonstrated the role of the TME, specifically the tumor infiltrating leukocytes (TIL), in regulating tumor development and progression, with CD8+ and CD4+ T-cells stimulating anti-tumor activity and TAMs suppressing anti-tumor immune responses. Macrophages are the most abundant TIL and play a major role in regulating mammary tumor growth and other TIL responses (3, 5). However, macrophage-specific mechanisms regulating the macrophage-tumor and macrophage-leukocyte interactions that support mammary tumor progression are not well established. Herein, we identified a role for RON signaling within macrophages as a major driver of BCa tumorigenesis. Our data show that loss of macrophage RON expression inhibits mammary tumor cell self-renewal, proliferation, survival, and migration, resulting in reduced tumor volumes, tumor weights, and metastatic outgrowth. These results are consistent with previous animal studies involving whole-body knockouts of either RON or HGFL (8, 27, 33), highlighting the contributions of macrophage-specific RON signaling in driving BCa progression. We also demonstrate that RON expression in macrophages governs macrophage recruitment to the TME and that these macrophages show higher expression of the M2 marker Arginase-1. These results are consistent with a recent study where systemic loss of HGFL in the MMTV-RON mouse model of BCa resulted in decreased tumor burden that was associated with increased M1 macrophage recruitment (27), suggesting that the alteration in macrophage recruitment and polarization are, in part, due to the effect of losing HGFL-RON signaling within macrophages.
Macrophage RON loss was associated with increased infiltration of CD8+ and CD4+ T cells and decreased B cell infiltration. Two recent studies with ablation of host RON signaling demonstrated that RON signaling supports BCa progression and metastasis by inhibiting CD8+ T-cell proliferation, recruitment, and cytotoxicity (6, 27). Interestingly, we are the first to describe the involvement of RON signaling in promoting B cell recruitment. Thus, we posit that activation macrophage RON promotes diverse cellular responses within the TME including B cell recruitment which may prove to be supportive of mammary tumor growth and progression. Interestingly, in a murine prostate cancer model, we reported findings wherein loss of tumor cell RON expression leads to loss of RON expression in TAMs which suggests a prospective mechanism by which RON in tumor cells regulates RON expression in macrophages; this mechanism may also be present in BCa (45).
Excitingly, we show macrophage RON signaling supports BCa cell phenotypes by altering the production of cytokines that have a direct effect in tumor cells or in immune cells to inhibit anti-tumor immune responses. RNA-Seq analyses show that RON signaling in macrophages is associated with immunosuppressive and tumor promoting cytokine signaling pathways, whereas loss of RON signaling in macrophages is associated with an anti-tumor immune response and a pro-inflammatory cytokine signaling profile, notably IL-35. Analysis of patient data shows poorer relapse-free survival and distant metastasis-free survival in patients that also have high expression of RON and IL12A (p35). Recent investigations implicate IL-35 as a potent immunosuppressive cytokine associated with Arginase-1 expression (M2 marker) and as a crucial pro-tumor cytokine suppressing T-cell-mediated antitumor immune responses (37). In vivo studies have shown the critical role of IL-35 in regulating tumor progression and metastasis and in mediating leukocyte recruitment (37, 46, 47). Our mechanistic studies demonstrate molecular changes in the IL-35 signaling pathway dependent on RON signaling in macrophages. Co-culture and conditioned media experiments demonstrate a functional role for IL-35 in augmenting mammosphere formation, however, supplementation of IL-35 alone showed no discernable effect. Because the effect is present when using conditioned media rather than only in co-culture, it is unlikely the augmented mammosphere formation is secondary to IL-35 binding to macrophages and then eliciting a downstream effect on mammosphere formation; however, it is conceivable that other secreted factors (present in the secretome of TK−/− macrophages) help to prime tumor cells to respond to IL-35. Further studies examining the functional role and relationship of macrophage-secreted IL-35 and CXCL13 in regulating BCa activities and immunosuppression upon activation of RON are warranted. Future studies wherein RON expression remains intact while IL-35 is knocked out would provide value. Our studies herein utilized primary cells (BMDM) which are not well suited for such an experiment, but generation of an immortalized BMDM line (48) could be used to target IL-35, although multiple genes would require targeting which ultimately adds to the complexity of potential knockout studies.
In summary, these data highlight macrophage-intrinsic RON signaling as a major mediator of breast tumorigenesis metastatic progression by supporting tumoral macrophage recruitment and alterations to the macrophage secretome including production of IL-35 that supports BCSC self-renewal. Associations with immunosuppression via secretory and phagocytic mechanisms were also described and will be the subject for future study.
Materials and Methods
Mice
RON receptor tyrosine kinase (TK) wild type (TK+/+) and deficient (TK−/−), RON TK floxed (TKFL/FL), Lysozyme-Cre (Lys-Cre+) and PyMT mice have been previously described (3, 8, 14, 20, 33). Mice expressing the tamoxifen-inducible Mer-iCre-Mer fusion protein under the control of the macrophage specific mouse colony stimulating factor 1 receptor (Csf1r) promoter (referred to as FVB CSF1R-Cre+ mice), were purchased from The Jackson Laboratory. Inducible macrophage RON deletion was accomplished via implantation of a 90-day release tamoxifen pellet (10mg/pellet, Innovative Research of America) when tumors reached a volume of ~100mm3. Genotyping primers are listed in Supplemental Table S1. Chemical inhibition of RON in PyMT TK+/+ mice was performed with 50 mg/kg/day BMS-777607 (Selleck Chemical) treatment via oral gavage, starting at 8 weeks of age (when palpable tumors reach a measurable size). All mice were in a FVB background, were maintained under specific pathogen-free conditions, and were treated in accordance with protocols approved by the Institutional Animal Care and Use Committee of the University of Cincinnati.
Sample sizes for mice experiments were selected based on published studies. Mice showing abnormal tumor growth against historical kinetics (whereas not plausibly explained by genotype) were excluded and euthanized (examples include very small body size at weaning, microcephaly, etc.). Randomization for LysM-Cre+ mice was not necessary as the controls were of a separate genotype (lacking LysM-Cre) whereas CSF1R-Cre+ mice were randomized into tamoxifen pellet or not using a random number generator. Blinding measures were not considered necessary and not employed.
Tissue histology, immunohistochemistry (IHC), and tumor cell isolations
Mammary tumors and lungs were processed as described (27, 32, 33). Hematoxylin and eosin (H&E) and IHC stainings for BrdU, TUNEL, F4/80, Arginase-1, iNOS, and CD8a were performed as described (3, 27). CD4 (BD) and B220 (Biolegend) stainings were performed under similar protocols.
Cell cultures
The murine R7 BCa cell line was derived from a mammary tumor obtained from a transgenic MMTV-RON mouse (32). Isolation of primary bone marrow cells was performed as described (18). CMG1412 cells were obtained from Dr. Yi Zheng (49). Macrophage colony stimulating factor (MCSF) (18). MCSF containing media was added for 10 days to isolated bone marrow cells to induce macrophage differentiation. Bone marrow derived macrophages (BMDMs) were skewed to the M2 state by adding IL-4 (Peprotech). For M2 BMDM conditioned media (M2 BMDM CM) collection, cells were seeded at an equal density for 24–48 hours in serum free media (SFM). CM from BMDMs was assessed as per manufacturer’s instructions for the mouse cytokine array kit panel A (R&D Systems). All murine cell lines were obtained from sources noted with cells expanded and initial stocks generated following 1–3 passages. Cells were confirmed negative for mycoplasma though PCR before experiments.
Flow cytometry analyses
For co-culture apoptotic studies, R7 cells were labeled with Vybrant™ DiO cell-labeling dye (Invitrogen). DiO-labeled R7 cells were co-cultured either under SFM conditions with TK+/+ M2 or TK−/− M2 BMDMs at a 1:4 ratio or in media containing a 1:1 ratio of M2 BMDM CM to SFM for 24 hours. Cells were stained with Annexin V-APC and Propidium Iodide and analyzed as described (3, 8, 27). Samples were normalized to M2 TK+/+ BMDMs within respective treatment conditions. For proliferation, DiO-labeled R7 cells were co-cultured for 24 hours at a 1:4 ratio with TK+/+ M2 BMDMs or TK−/− M2 BMDMs or in media containing a 1:1 ratio of M2 BMDM CM to SFM, labeled with BrdU, and stained with BrdU-APC (eBiosciences). For both co-cultured proliferation and apoptosis assays, cells were gated on DiO-positivity to select out macrophages within the co-culture. All samples were normalized to TK+/+ within respective treatment conditions (co-culture versus conditioned media). For BCa stem cell marker analyses, dissociated mammary tumor cells were stained with CD24-PE, CD29-FITC, CD31-APC, TER-119-APC (BD Biosciences) and CD45-APC (Biolegend) antibodies, analyzed, and sorted as previously described (8).
Immunodepletion assays
Depletion of p35, EBI3, and p40 from TK+/+ BMDM CM was performed by rotating TK+/+ BMDM CM with 1 μg/ml of p35-antibody (R&D), EBI3-antibody (R&D), or p40-antibody (R&D), overnight followed by adding 30 uL protein A/G agarose beads per mL of CM overnight. Beads were then separated via centrifugation and supernatant sterile filtered. Depletion status was confirmed via immunoblot. Incubation with beads served as control.
Mammosphere (MS) formation assays
Mammosphere formation assays of 50,000 R7 cells either cultured alone or co-cultured at a 1:1 ratio with TK+/+ M2 BMDMs, TK−/− M2 BMDMs, or their respective M2 BMDM CM were performed as described (8). For cytokine treatment, cells were treated every three days with 100ng/mL of rIL-35 or IL-12 (Chimerigen). For depletion studies, cells were cultured in media containing a 1:1 ratio of subunit-depleted M2 TK+/+ BMDM CM to mammosphere media. Mammosphere formation assays of BCSCs isolated from similar sized primary tumors were performed by culturing the same number of cells between groups (8).
Migration assays
Migration assays of R7 cells toward SFM, TK+/+ M2 BMDMs, TK−/− M2 BMDMs, or their respective M2 BMDM CM were performed for up to 24 hours using Boyden chambers (27). A 1:10 ratio of R7 to M2 BMDMs was used for co-culture studies and a 1:1 ratio of M2 BMDM CM to SFM for media studies. The number of R7 cells that migrated toward SFM was subtracted from all groups. The number of R7 cells that migrated to each experimental condition was normalized to the number of R7 cells that migrated toward TK+/+ M2 BMDMs or TK+/+ M2 BMDM CM.
RNA-Seq
RNA was isolated from TK+/+ and TK−/− M2 BMDMs using the TRIzol method (Invitrogen). Sequencing libraries were prepared using the Illumina TruSeq RNA kit and sequenced on the Illumina Hi-Seq 2500 with single-end 50-bp reads. RNA-Seq analysis was performed in GeneSpring NGS software (Agilent Technologies). To assess differential expression, a cutoff of a ≥5-fold difference was applied. Heatmaps of differential gene expression were built through hierarchical clustering using the Pearson Centered similarity measure and the Average linkage rule. Pathway enrichment analysis was performed using ToppGene (50), which provides an enrichment P-value using hypergeometric distribution with false discovery rate (FDR) correction. Data was placed in the NCBI’s Gene Expression Omnibus database (GSE166575). See Supplemental Methods for additional details.
Immunoblot Analyses
Antibodies for western analyses included: phospho-NF-κB1 p105 (S933), NF-κB1 p105/p50, REL B, C-REL, phospho-AKT (S473), AKT, IRF1, IRF8, phospho-p44/42 MAPK (T202/Y204), p44/42 MAPK, phospho-NF-κB p65 (S536), NF-κB p65, phospho-STAT1 (Y701), and STAT1 (Cell Signaling Technology); p35 (R&D); Arginase 1 (BD Transduction Laboratories); MYD88 (Santa Cruz Biotechnology), and C4-ACTIN (Cincinnati Children’s Hospital Medical Center). Secondary antibodies were developed as described (8).
Statistical Analysis
Statistical significance was determined by performing Student’s t-test for pairwise comparisons or ANOVA for comparison of multiple groups; data are expressed as mean ± standard deviation (SD). Significance (*) was set at P<0.05. Metastasis incidence was analyzed using Fisher’s Exact test. RNA sequencing data and associated survival data from Gene Expression Omnibus and The Cancer Genome Atlas were obtained via KM Plotter (51). IL-12A and EBI3 gene expressions were stratified using auto-cutoff functions based on P-value and Hazard Ratio and were analyzed using Log Rank statistics in Kaplan-Meier curves. Statistical tests were selected based on population distribution, data scale, and sample centrality/variability to meet assumptions of tests. Variance between sample groups were found to be similar as tested by ANOVA.
Supplementary Material
Acknowledgements
We would like to thank Vidjaya L. Premkumar, Lennox Brooks, Rebekah Karns, James Davis and Madison Nashu for their technical and bioinformatic assistance.
Financial Support
US Department of Veterans Affairs research grant 1IOBX000803 (SEW); National Institutes of Health grants R01 CA239697 (SEW), T32 CA117846 (SEW, SJRT, NMB, JRB), F31 CA228373 (BGH, SEW) and National Institutes of Diabetes & Digestive & Kidney Diseases grant P30 DK078392.
Footnotes
Conflicts of Interest:
The authors declare no conflicts of interest.
References
- 1.Siegel RL, Miller KD, Fuchs HE, Jemal A. Cancer Statistics, 2021. CA Cancer J Clin. 2021;71(1):7–33. [DOI] [PubMed] [Google Scholar]
- 2.Wellenstein MD, de Visser KE. Cancer-Cell-Intrinsic Mechanisms Shaping the Tumor Immune Landscape. Immunity. 2018;48(3):399–416. [DOI] [PubMed] [Google Scholar]
- 3.Gurusamy D, Gray JK, Pathrose P, Kulkarni RM, Finkleman FD, Waltz SE. Myeloid-specific expression of Ron receptor kinase promotes prostate tumor growth. Cancer Res. 2013;73(6):1752–63. [DOI] [PMC free article] [PubMed] [Google Scholar]
- 4.Lindsten T, Hedbrant A, Ramberg A, Wijkander J, Solterbeck A, Eriksson M, et al. Effect of macrophages on breast cancer cell proliferation, and on expression of hormone receptors, uPAR and HER-2. Int J Oncol. 2017;51(1):104–14. [DOI] [PMC free article] [PubMed] [Google Scholar]
- 5.Singh S, Mehta N, Lilan J, Budhthoki MB, Chao F, Yong L. Initiative action of tumor-associated macrophage during tumor metastasis. Biochim Open. 2017;4:8–18. [DOI] [PMC free article] [PubMed] [Google Scholar]
- 6.Eyob H, Ekiz HA, Derose YS, Waltz SE, Williams MA, Welm AL. Inhibition of ron kinase blocks conversion of micrometastases to overt metastases by boosting antitumor immunity. Cancer Discov. 2013;3(7):751–60. [DOI] [PMC free article] [PubMed] [Google Scholar]
- 7.Korkaya H, Liu S, Wicha MS. Breast cancer stem cells, cytokine networks, and the tumor microenvironment. J Clin Invest. 2011;121(10):3804–9. [DOI] [PMC free article] [PubMed] [Google Scholar]
- 8.Ruiz-Torres SJ, Benight NM, Karns RA, Lower EE, Guan JL, Waltz SE. HGFL-mediated RON signaling supports breast cancer stem cell phenotypes via activation of non-canonical beta-catenin signaling. Oncotarget. 2017;8(35):58918–33. [DOI] [PMC free article] [PubMed] [Google Scholar]
- 9.Iwama A, Wang MH, Yamaguchi N, Ohno N, Okano K, Sudo T, et al. Terminal differentiation of murine resident peritoneal macrophages is characterized by expression of the STK protein tyrosine kinase, a receptor for macrophage-stimulating protein. Blood. 1995;86(9):3394–403. [PubMed] [Google Scholar]
- 10.Wagh PK, Peace BE, Waltz SE. Met-related receptor tyrosine kinase Ron in tumor growth and metastasis. Adv Cancer Res. 2008;100:1–33. [DOI] [PMC free article] [PubMed] [Google Scholar]
- 11.Kulkarni RM, Stuart WD, Waltz SE. Ron receptor-dependent gene regulation of Kupffer cells during endotoxemia. Hepatobiliary Pancreat Dis Int. 2014;13(3):281–92. [DOI] [PMC free article] [PubMed] [Google Scholar]
- 12.Nikolaidis NM, Gray JK, Gurusamy D, Fox W, Stuart WD, Huber N, et al. Ron receptor tyrosine kinase negatively regulates TNFalpha production in alveolar macrophages by inhibiting NF-kappaB activity and Adam17 production. Shock. 2010;33(2):197–204. [DOI] [PMC free article] [PubMed] [Google Scholar]
- 13.Nikolaidis NM, Kulkarni RM, Gray JK, Collins MH, Waltz SE. Ron receptor deficient alveolar myeloid cells exacerbate LPS-induced acute lung injury in the murine lung. Innate Immun. 2011;17(6):499–507. [DOI] [PMC free article] [PubMed] [Google Scholar]
- 14.Stuart WD, Kulkarni RM, Gray JK, Vasiliauskas J, Leonis MA, Waltz SE. Ron receptor regulates Kupffer cell-dependent cytokine production and hepatocyte survival following endotoxin exposure in mice. Hepatology. 2011;53(5):1618–28. [DOI] [PMC free article] [PubMed] [Google Scholar]
- 15.Brunelleschi S, Penengo L, Lavagno L, Santoro C, Colangelo D, Viano I, et al. Macrophage stimulating protein (MSP) evokes superoxide anion production by human macrophages of different origin. Br J Pharmacol. 2001;134(6):1285–95. [DOI] [PMC free article] [PubMed] [Google Scholar]
- 16.Kurihara N, Iwama A, Tatsumi J, Ikeda K, Suda T. Macrophage-stimulating protein activates STK receptor tyrosine kinase on osteoclasts and facilitates bone resorption by osteoclast-like cells. Blood. 1996;87(9):3704–10. [PubMed] [Google Scholar]
- 17.Nanney LB, Skeel A, Luan J, Polis S, Richmond A, Wang MH, et al. Proteolytic cleavage and activation of pro-macrophage-stimulating protein and upregulation of its receptor in tissue injury. J Invest Dermatol. 1998;111(4):573–81. [DOI] [PubMed] [Google Scholar]
- 18.Kulkarni RM, Stuart WD, Gurusamy D, Waltz SE. Ron receptor signaling is protective against DSS-induced colitis in mice. Am J Physiol Gastrointest Liver Physiol. 2014;306(12):G1065–74. [DOI] [PMC free article] [PubMed] [Google Scholar]
- 19.Ray M, Yu S, Sharda DR, Wilson CB, Liu Q, Kaushal N, et al. Inhibition of TLR4-induced IkappaB kinase activity by the RON receptor tyrosine kinase and its ligand, macrophage-stimulating protein. J Immunol. 2010;185(12):7309–16. [DOI] [PMC free article] [PubMed] [Google Scholar]
- 20.Waltz SE, Eaton L, Toney-Earley K, Hess KA, Peace BE, Ihlendorf JR, et al. Ron-mediated cytoplasmic signaling is dispensable for viability but is required to limit inflammatory responses. J Clin Invest. 2001;108(4):567–76. [DOI] [PMC free article] [PubMed] [Google Scholar]
- 21.Chen YQ, Fisher JH, Wang MH. Activation of the RON receptor tyrosine kinase inhibits inducible nitric oxide synthase (iNOS) expression by murine peritoneal exudate macrophages: phosphatidylinositol-3 kinase is required for RON-mediated inhibition of iNOS expression. J Immunol. 1998;161(9):4950–9. [PubMed] [Google Scholar]
- 22.Morrison AC, Correll PH. Activation of the stem cell-derived tyrosine kinase/RON receptor tyrosine kinase by macrophage-stimulating protein results in the induction of arginase activity in murine peritoneal macrophages. J Immunol. 2002;168(2):853–60. [DOI] [PubMed] [Google Scholar]
- 23.Morrison AC, Wilson CB, Ray M, Correll PH. Macrophage-stimulating protein, the ligand for the stem cell-derived tyrosine kinase/RON receptor tyrosine kinase, inhibits IL-12 production by primary peritoneal macrophages stimulated with IFN-gamma and lipopolysaccharide. J Immunol. 2004;172(3):1825–32. [DOI] [PubMed] [Google Scholar]
- 24.Sharda DR, Yu S, Ray M, Squadrito ML, De Palma M, Wynn TA, et al. Regulation of macrophage arginase expression and tumor growth by the Ron receptor tyrosine kinase. J Immunol. 2011;187(5):2181–92. [DOI] [PMC free article] [PubMed] [Google Scholar]
- 25.Wilson CB, Ray M, Lutz M, Sharda D, Xu J, Hankey PA. The RON receptor tyrosine kinase regulates IFN-gamma production and responses in innate immunity. J Immunol. 2008;181(4):2303–10. [DOI] [PubMed] [Google Scholar]
- 26.Wang MH, Cox GW, Yoshimura T, Sheffler LA, Skeel A, Leonard EJ. Macrophage-stimulating protein inhibits induction of nitric oxide production by endotoxin- or cytokine-stimulated mouse macrophages. J Biol Chem. 1994;269(19):14027–31. [PubMed] [Google Scholar]
- 27.Benight NM, Wagh PK, Zinser GM, Peace BE, Stuart WD, Vasiliauskas J, et al. HGFL supports mammary tumorigenesis by enhancing tumor cell intrinsic survival and influencing macrophage and T-cell responses. Oncotarget. 2015;6(19):17445–61. [DOI] [PMC free article] [PubMed] [Google Scholar]
- 28.Hunt BG, Wicker CA, Bourn JR, Lower EE, Takiar V, Waltz SE. MST1R (RON) expression is a novel prognostic biomarker for metastatic progression in breast cancer patients. Breast Cancer Res Treat. 2020;181(3):529–40. [DOI] [PMC free article] [PubMed] [Google Scholar]
- 29.Benight NM, Waltz SE. Ron receptor tyrosine kinase signaling as a therapeutic target. Expert Opin Ther Targets. 2012;16(9):921–31. [DOI] [PMC free article] [PubMed] [Google Scholar]
- 30.McClaine RJ, Marshall AM, Wagh PK, Waltz SE. Ron receptor tyrosine kinase activation confers resistance to tamoxifen in breast cancer cell lines. Neoplasia. 2010;12(8):650–8. [DOI] [PMC free article] [PubMed] [Google Scholar]
- 31.Welm AL, Sneddon JB, Taylor C, Nuyten DS, van de Vijver MJ, Hasegawa BH, et al. The macrophage-stimulating protein pathway promotes metastasis in a mouse model for breast cancer and predicts poor prognosis in humans. Proc Natl Acad Sci U S A. 2007;104(18):7570–5. [DOI] [PMC free article] [PubMed] [Google Scholar]
- 32.Zinser GM, Leonis MA, Toney K, Pathrose P, Thobe M, Kader SA, et al. Mammary-specific Ron receptor overexpression induces highly metastatic mammary tumors associated with beta-catenin activation. Cancer Res. 2006;66(24):11967–74. [DOI] [PubMed] [Google Scholar]
- 33.Peace BE, Toney-Earley K, Collins MH, Waltz SE. Ron receptor signaling augments mammary tumor formation and metastasis in a murine model of breast cancer. Cancer Res. 2005;65(4):1285–93. [DOI] [PubMed] [Google Scholar]
- 34.Choi J, Leung PS, Bowlus C, Gershwin ME. IL-35 and Autoimmunity: a Comprehensive Perspective. Clin Rev Allergy Immunol. 2015;49(3):327–32. [DOI] [PubMed] [Google Scholar]
- 35.Kourko O, Seaver K, Odoardi N, Basta S, Gee K. IL-27, IL-30, and IL-35: A Cytokine Triumvirate in Cancer. Front Oncol. 2019;9:969. [DOI] [PMC free article] [PubMed] [Google Scholar]
- 36.Dambuza IM, He C, Choi JK, Yu CR, Wang R, Mattapallil MJ, et al. IL-12p35 induces expansion of IL-10 and IL-35-expressing regulatory B cells and ameliorates autoimmune disease. Nat Commun. 2017;8(1):719. [DOI] [PMC free article] [PubMed] [Google Scholar]
- 37.Pylayeva-Gupta Y Molecular Pathways: Interleukin-35 in Autoimmunity and Cancer. Clin Cancer Res. 2016;22(20):4973–8. [DOI] [PubMed] [Google Scholar]
- 38.Vignali DA, Kuchroo VK. IL-12 family cytokines: immunological playmakers. Nat Immunol. 2012;13(8):722–8. [DOI] [PMC free article] [PubMed] [Google Scholar]
- 39.Jadus MR, Irwin MC, Irwin MR, Horansky RD, Sekhon S, Pepper KA, et al. Macrophages can recognize and kill tumor cells bearing the membrane isoform of macrophage colony-stimulating factor. Blood. 1996;87(12):5232–41. [PubMed] [Google Scholar]
- 40.Sainz B Jr., Carron E, Vallespinos M, Machado HL. Cancer Stem Cells and Macrophages: Implications in Tumor Biology and Therapeutic Strategies. Mediators Inflamm. 2016;2016:9012369. [DOI] [PMC free article] [PubMed] [Google Scholar]
- 41.Goodridge HS, Harnett W, Liew FY, Harnett MM. Differential regulation of interleukin-12 p40 and p35 induction via Erk mitogen-activated protein kinase-dependent and -independent mechanisms and the implications for bioactive IL-12 and IL-23 responses. Immunology. 2003;109(3):415–25. [DOI] [PMC free article] [PubMed] [Google Scholar]
- 42.Kollet JI, Petro TM. IRF-1 and NF-kappaB p50/cRel bind to distinct regions of the proximal murine IL-12 p35 promoter during costimulation with IFN-gamma and LPS. Mol Immunol. 2006;43(6):623–33. [DOI] [PubMed] [Google Scholar]
- 43.Liu J, Guan X, Tamura T, Ozato K, Ma X. Synergistic activation of interleukin-12 p35 gene transcription by interferon regulatory factor-1 and interferon consensus sequence-binding protein. J Biol Chem. 2004;279(53):55609–17. [DOI] [PubMed] [Google Scholar]
- 44.Hunt BG, Wicker CA, Bourn JR, Lower EE, Takiar V, Waltz SE. MST1R (RON) expression is a novel prognostic biomarker for metastatic progression in breast cancer patients. Breast Cancer Research and Treatment. 2020. [DOI] [PMC free article] [PubMed] [Google Scholar]
- 45.Sullivan C, Brown NE, Vasiliauskas J, Pathrose P, Starnes SL, Waltz SE. Prostate Epithelial RON Signaling Promotes M2 Macrophage Activation to Drive Prostate Tumor Growth and Progression. Mol Cancer Res. 2020;18(8):1244–54. [DOI] [PMC free article] [PubMed] [Google Scholar]
- 46.Lee CC, Lin JC, Hwang WL, Kuo YJ, Chen HK, Tai SK, et al. Macrophage-secreted interleukin-35 regulates cancer cell plasticity to facilitate metastatic colonization. Nat Commun. 2018;9(1):3763. [DOI] [PMC free article] [PubMed] [Google Scholar]
- 47.Sawant DV, Hamilton K, Vignali DA. Interleukin-35: Expanding Its Job Profile. J Interferon Cytokine Res. 2015;35(7):499–512. [DOI] [PMC free article] [PubMed] [Google Scholar]
- 48.De Nardo D, Kalvakolanu DV, Latz E. Immortalization of Murine Bone Marrow-Derived Macrophages. Springer; New York; 2018. p. 35–49. [DOI] [PubMed] [Google Scholar]
- 49.Ito Y, Teitelbaum SL, Zou W, Zheng Y, Johnson JF, Chappel J, et al. Cdc42 regulates bone modeling and remodeling in mice by modulating RANKL/M-CSF signaling and osteoclast polarization. J Clin Invest. 2010;120(6):1981–93. [DOI] [PMC free article] [PubMed] [Google Scholar]
- 50.Chen J, Bardes EE, Aronow BJ, Jegga AG. ToppGene Suite for gene list enrichment analysis and candidate gene prioritization. Nucleic Acids Res. 2009;37(Web Server issue):W305–11. [DOI] [PMC free article] [PubMed] [Google Scholar]
- 51.Györffy B, Lanczky A, Eklund AC, Denkert C, Budczies J, Li Q, et al. An online survival analysis tool to rapidly assess the effect of 22,277 genes on breast cancer prognosis using microarray data of 1,809 patients. Breast cancer research and treatment. 2010;123(3):725–31. [DOI] [PubMed] [Google Scholar]
Associated Data
This section collects any data citations, data availability statements, or supplementary materials included in this article.