

Summary
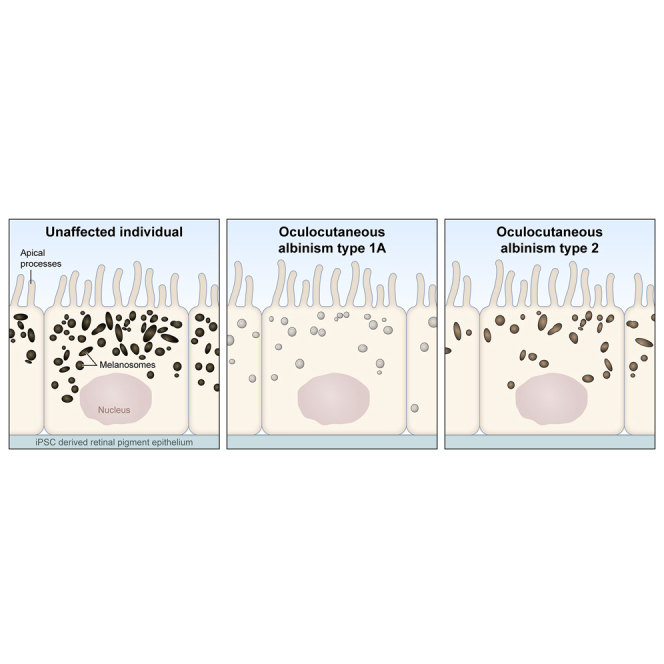
Oculocutaneous albinism (OCA) encompasses a set of autosomal recessive genetic conditions that affect pigmentation in the eye, skin, and hair. OCA patients display reduced best-corrected visual acuity, reduced to absent ocular pigmentation, abnormalities in fovea development, and/or abnormal decussation of optic nerve fibers. It has been hypothesized that improving eye pigmentation could prevent or rescue some of the vision defects. The goal of the present study was to develop an in vitro model for studying pigmentation defects in human retinal pigment epithelium (RPE). We developed a “disease in a dish” model for OCA1A and OCA2 types using induced pluripotent stem cells to generate RPE. The RPE is a monolayer of cells that are pigmented, polarized, and polygonal in shape, located between the neural retina and choroid, with an important role in vision. Here we show that RPE tissue derived in vitro from OCA patients recapitulates the pigmentation defects seen in albinism, while retaining the apical-basal polarity and normal polygonal morphology of the constituent RPE cells.
Keywords: OCA1A, OCA2, iPSC, RPE, melanosomes, albinism
Graphical abstract
Highlights
-
•
We established a human iPSC-based in vitro model for oculocutaneous albinism (OCA)
-
•
iRPE derived from OCA-iPSC retains apical-basal polarity and polygonal morphology
-
•
OCA-iRPE recapitulates the pigmentation defect seen in albinism
-
•
Excess pre-melanosomes and scarce mature melanosomes are found in OCA-iRPE
In this article, Brooks and colleagues establish an iPSC-derived retinal pigment epithelium (iRPE) model of two forms of oculocutaneous albinism, OCA1A and OCA2. Both OCA-iRPE monolayers are morphologically normal, albeit with differences in cellular phenotypes. Pigmentation and melanosome content are abnormal. OCA-iRPE models will help with dissecting the pathways underlying abnormalities in visual system development in albinism and devising novel treatments.
Introduction
Eight different types of oculocutaneous albinism (OCA 1–8; Table S1) have been reported to date that are caused by a set of genes essential for melanin synthesis and/or melanosome biogenesis. Affected individuals display different degrees to no pigmentation, are susceptible to increased risk of skin cancer, have reduced visual acuity, and often experience social stigma (Marçon and Maia, 2019). In all OCA types, two consistent ophthalmic defects accompany pigmentation deficits: foveal hypoplasia (leading to reduced visual acuity) and increased contralateral targeting of retinal ganglion cell (RGC) axons. Currently, the mechanisms underlying these developmental defects are not understood. A few lines of evidence suggest that non-cell autonomous mechanisms are involved in disease pathogenesis. In the eye, the genes associated with OCA are expressed at low levels in the developing and adult neural retina but are highly expressed in the adjacent retinal pigment epithelium (RPE) (Raymond and Jackson, 1995). Furthermore, tyrosinase protein (TYR) and melanin pigment have not been observed in the developing or adult neural retina (Jeffery, 1997; Le et al., 2014) and are present only in the RPE (Beermann et al., 1992). Finally, despite the important role of melanosomes in RPE physiology, no degenerative defects are observed in the RPE of patients with OCA. On the other hand, a significantly increased incidence of UV-radiation-induced skin lesions, including actinic keratosis, squamous cell carcinoma, basal cell carcinoma and rarely, melanoma, has been reported in individuals with OCA (Mabula et al., 2012).
Despite being one of the oldest known genetic conditions (Ballantyne, 2009), all forms of OCA currently remain untreatable, in part, due to the lack of robust small animal models of foveal development and the lack of readily available tissue for mechanistic studies, drug screening, and/or tissue replacement. Observational studies on cadaver eye tissues from OCA patients are rare (Usher, 1920). We found only a single study that performed electron microscopic analysis of human RPE derived from a 13-year-old leukemic patient with the characteristic features of TYR-negative OCA (Fulton et al., 1978). Furthermore, the RPE exists as a monolayer of post-mitotic cells adjacent to the photoreceptors with very limited expansion capability when isolated and cultured in vitro, making mechanistic and high-throughput drug discovery studies in primary tissue technically challenging.
To investigate abnormalities in melanosome formation and melanin accumulation associated with OCA in RPE, as well as to test therapeutic paradigms, we developed a “disease in a dish” model using induced pluripotent stem cells (iPSCs). We differentiated iPSCs reprogrammed from OCA patients' and unaffected individuals' fibroblasts to generate RPE monolayers (iRPE). We focused on the two most prevalent and severe forms of albinism in North America, OCA1A and OCA2, which are caused by recessive mutations in TYR and the P GENE/OCA2, respectively. The iRPE cells differentiated from OCA patients (OCA-iRPE) robustly recapitulated the pigmentation phenotype while maintaining normal morphological features. OCA-iRPE provide a perpetual cell source for basic biological studies on melanogenesis and for drug discovery.
Results
OCA-iRPE recapitulates the pigment deficit phenotype in vitro
Fibroblasts derived from two unrelated OCA1A (cell line OCA1A-1 and OCA1A-2) and two OCA2 (cell line OCA2-1 and OCA2-2) patients, clinically diagnosed and genetically confirmed for having OCA (Figure 1A), were reprogrammed to iPSCs. Two control (CTRL) iPSCs were derived from unrelated, unaffected individuals and have been reported previously (May-Simera et al., 2018). Multiple clones of each of the four OCA-iPSCs were expanded and cryopreserved before characterization for pluripotency. All iPSC lines described in this study exhibited normal karyotype (Figure S1A). Immunostained iPSC colonies from all the lines were positive for the transcription factors OCT-4, NANOG, and SOX-2, and the cell surface markers TRA-1-81, TRA-1-60, and SSEA-4, associated with pluripotency (Figure S1B). Pluripotency of the iPSC lines was further confirmed using in vitro directed differentiation (Figure S2A) and in vivo teratoma formation assays (Figure S2B). All iPSC lines differentiated in vitro expressed markers for ectodermal (OTX-2 and β-III tubulin), mesodermal (brachyury and smooth muscle actin), and endodermal (SOX-17 and alpha fetoprotein) lineages (Figure S2A). Upon injection into immuno-compromised mice, all iPSC lines generated teratomas in vivo, exhibiting derivatives of the three germ layers (Figure S2B).
Figure 1.

RPE derived from OCA1A and OCA2 patients recapitulates pigmentation defects
(A) Mutations detected in the four patients used as donors for generating OCA-iPSC lines.
(B) Control- (CTRL), OCA1A-, and OCA2-iRPE monolayers on 2D trans-well culture system showing differential degrees of pigmentation.
(C) Representative brightfield microscopy images of CTRL-, OCA1A-, and OCA2-iRPE monolayers displaying variable amounts of melanin. Scale bar represents 200 μm.
The OCA-iPSCs were differentiated toward RPE fate using a previously published protocol (Sharma et al., 2019). Following differentiation, iRPE cells were cultured in a two-dimensional (2D) trans-well culture system (Figure 1B) for 6–8 weeks to help the formation of a polarized monolayered epithelial tissue with polygonal cell morphology (Maminishkis et al., 2006). Visual examination and brightfield microscopy revealed the presence of pigmentation in the CTRL-iRPE monolayer, whereas pigmentation in both OCA1A- and OCA2-iRPE was significantly reduced, reminiscent of the OCA patient's ocular phenotype (Figures 1B and 1C). We have previously reported an automated program based on machine learning to quantify pigmentation in iRPE monolayers using live brightfield imaging (Schaub et al., 2020). The analysis confirmed that both types of OCA-iRPE exhibited significantly reduced pigment levels compared to CTRL-iRPE (Schaub et al., 2020). Furthermore, the pigment deficit was more severe in OCA1A-iRPE monolayer compared to OCA2-iRPE (data not shown), as also observed clinically (Karaman, 2008). At least two different clones from each OCA-iPSC line were differentiated to iRPE, and the pigmentation defects were consistent across all clones. OCA2-iRPE developed a brownish pigmentation after long-term culturing (>6 months); however, pigmentation was never observed in OCA1A-iRPE monolayers (Figure 1B). This observation is consistent with OCA2 patients' ophthalmic findings and studies in mouse models of OCA2 (Ishikawa et al., 2015), where an increase in eye pigmentation over time has been reported. On the contrary, no age-associated increase in pigmentation has been observed in the eyes of OCA1A patients (Okulicz et al., 2003).
Total melanosome numbers are reduced in OCA-iRPE
We performed ultrastructure studies using transmission electron microscopy (TEM) to confirm the polarized monolayer organization of iRPE cells and to investigate melanosome defects in OCA1A- and OCA2-iRPE monolayers (Figure 2). We differentiated one clone each of CTRL-iPSCs and two independent clones from each of the two OCA1A- and OCA2-iPSC lines toward iRPE and performed TEM eight weeks post-seeding on trans-well membranes (Figure 2A). In all CTRL- and OCA-iRPE, we observed a similar monolayer organization of RPE cells on the trans-well membrane, with microvilli processes on the apical side (Figure 2A, arrows), basally located nuclei (N), and basal infoldings (Figure 2A, arrowheads). Melanosomes appeared more densely distributed in CTRL-iRPE (42.3 ± 2.5/cell) than in OCA2-iRPE (25.6 ± 3.2/cell) and rare (8.5 ± 0.6/cell) in OCA1A-iRPE, a significant difference with p < 0.0001 (Figures 2A–2C). Based on published TEM observations, melanosomes progress through four developmentally categorized stages (I–IV). Stage I pre-melanosomes contain internal membranous vesicles and irregular fibrous structures that resemble late endosomes. In stage II pre-melanosomes, the intralumenal fibers form regular parallel or concentric arrays that serve as substratum for melanin synthesis and deposition in mature melanosomes (stage III), resulting in their darkening. Stage IV mature melanosomes are densely packed with melanin, appearing homogeneously black (Seiji et al., 1963; Raposo and Marks, 2007). In CTRL-iRPE cells, we observed many heavily pigmented, mature (stage IV) melanosomes that were circular and elliptical in shape (Figure 2C, red arrow and 2D); pre-melanosomes were rarely observed in CTRL-iRPE cells (Figure 2D). In OCA1A-iRPE, we observed only stage I and II pre-melanosomes (Figure 2C, white arrows). Stage III and IV mature melanosomes were never observed in any of the OCA1A-iRPE analyzed (Figures 2C and 2D), even after extended culture. Notably, OCA2-iRPE exhibited both pre-melanosomes (68%) and mature melanosomes (32%; Figure 2D). The presence of mature melanosomes in OCA2-iRPE but not in OCA1A-iRPE suggests that melanin synthesis by TYR and its deposition in pre-melanosome is an essential step toward pre-melanosome maturation. Although there is no direct evidence suggesting that melanin itself is necessary for melanosome maturation, indirect evidence suggests that melanin may be critical for stabilization of preformed pre-melanosomes. Prior research shows that, when human TYR is expressed in the Tyr mutant mouse (c-2J), it rescues melanosomes and pigmentation in the RPE (Gargiulo et al., 2009). Furthermore, publications from our lab have shown that the drug nitisinone can improve pigmentation and melanosomes in a mouse model of albinism (Onojafe et al., 2011) and in humans with OCA1B (Adams et al., 2019). In summary, both types of OCA-iRPE displayed significantly reduced melanosomes, with OCA1A-iRPE exhibiting only pre-melanosomes, and OCA2-iRPE showing both pre- and mature melanosomes.
Figure 2.

RPE derived from OCA1A and OCA2 patients exhibits melanosome defects
(A) Transmission electron microscopy (TEM) microphotographs of control (CTRL)-, OCA1A-, and OCA2-iRPE monolayers on trans-well membranes. Arrows indicate the location of apical processes, and arrowheads indicate the location of basal infoldings. Scale bar represents 2 μm and 10,000x magnification.
(B) Quantification of the number of melanosomes and/or cells in CTRL-iRPE (N = 32), OCA1A-iRPE (N = 20), and OCA2-iRPE (N = 20), where N is the number of unique TEM images. The horizontal lines in the boxblots indicate the median, the boxes indicate the first and third quartiles, and the whiskers indicate the 5th and 95th percentiles. Student's t test was used to determine p values.
(C) Higher magnification TEM microphotographs of CTRL-, OCA1A-, and OCA2-iRPE monolayers on trans-well membranes used for quantification in (B) and (D). Red arrow showing mature and/or stage IV melanosome and white arrows showing pre-melanosomes and/or stage I and II. Scale bar represents 500 nm and 15,000–20,000x magnification.
(D) Quantification of the percentage of pre-melanosome (stage I and II) and mature melanosome (stage III and IV) per cell in CTRL-iRPE (N = 32), OCA1A-iRPE (N = 20), and OCA2-iRPE (N = 20), where N is the number of unique TEM images counted from four different lines in each group and represents pooled data from a single differentiation event of four different lines in each group.
OCA-iRPE exhibits pre-melanosome biogenesis and increased melanosome degradation
Reduction in total melanosomal content in OCA-iRPE could result from two possible scenarios: (1) defects in melanosome biogenesis and/or (2) degeneration of immature melanosomes due to failure in the maturation process. Higher magnification TEM imaging of OCA1A- and OCA2-iRPE pre-melanosomes (stage I and II) was performed to study their formation. In both OCA-iRPE tissues, we observed the presence of intralumenal fibrillar striations (Figure 3A, white arrows), which serve as the matrix for melanin deposition and are a characteristic feature of stage II melanosomes (Seiji et al., 1963). In OCA2-iRPE, we also observed stage III melanosomes with an amorphous core surrounded by intralumenal fibrillar striations (Figure 3A, black arrowhead) and evidence of melanin deposition inside the melanosomes (Figure 3A, black arrow). The PMEL-17 protein is a structural component of intraluminal fibers observed in stage II melanosomes. A punctate staining pattern of PMEL-17 immunoreactivity, acquired using near super-resolution confocal microscopy of a single RPE cell, was observed in CTRL-, OCA1A-, and OCA2-iRPE (Figure 3B). PMEL-17 staining appeared denser in OCA1A- and OCA2-iRPE compared to CTRL-iRPE, in accordance with the presence of a higher number of pre-melanosomes in OCA-iRPE compared with CTRL-iRPE (Figure 2D). Figure S3 shows lower magnification images along with orthogonal view on the top of CTRL and OCA-iRPE monolayers immunostained with PMEL-17. These observations suggest that melanosome biogenesis is not affected, and pre-melanosomes accumulate in OCA1A- and OCA2-iRPE. Based on these observations, we hypothesized that failure of melanin deposition in preformed pre-melanosomes could result in their degradation and removal from the cell.
Figure 3.

OCA1A- and OCA2-iRPE exhibit significantly higher degenerating melanosomes
(A) Transmission electron microscopy (TEM) microphotographs of pre-melanosomes observed in OCA1A- and OCA2-iRPE cells. Scale bar represents 500 nm in both panels. White arrows and black arrowhead show different stages of pre-melanosomes, and black arrow shows a stage III melanosome.
(B) Super-resolution (Zeiss 880 Airyscan) confocal microscopy microphotographs of PMEL-17 immunofluorescence staining in iRPE cells. Scale bar represents 5 μm and 7.5x zoom.
(C) TEM microphotograph of intact stage IV melanosomes (arrows) and degenerating melanosomes (arrowheads) observed in control (CTRL-iRPE) cells. Scale bar represents 500 nm.
(D) Quantification of the percentage of degenerating melanosomes out of the total melanosome counts in iRPE monolayers derived from CTRL (N = 32), OCA1A (N = 20), and OCA2 (N = 20) lines, where N is the number of unique TEM images and represents pooled data from a single differentiation event of four different lines in each group. The horizontal lines in the boxplots indicate the median, the boxes indicate the first and third quartiles, and the whiskers indicate the 5th and 95th percentiles. Student's t test was used to determine p values.
In our TEM studies, we observed a significant proportion of degenerating melanosomes in both OCA-iRPE. We also identified degenerating melanosomes in CTRL-iRPE (Figure 3C, arrowheads), which display a diffused boundary and irregular shape in contrast to normal melanosomes that have a well-defined boundary, spherical or oval shape, and a dense core packed with melanin (Figure 3C, arrows). Compared with CTRL-iRPE, a significantly higher percentage of melanosomes appeared degenerating in OCA1A-iRPE (Figure 3D), which lacks functional TYR and does not synthetize melanin. This suggests that melanin packaging is necessary for maturation and stabilization of melanosomes in OCA1A-iRPE cells. Similarly, we observed a higher number of degenerating melanosomes in OCA2-iRPE compared with CTRL-iRPE (Figure 3D). In conclusion, both OCA-iRPE exhibited more degenerating melanosomes compared with CTRL-iRPE, in accordance with their reduced melanosome content and possibly reflecting a cellular mechanism for removing abnormal melanosomes.
Melanosome maturation is defective in OCA-iRPE
TYR enzyme is transported into preformed pre-melanosomes where it is involved in the synthesis of melanin, which is subsequently deposited on the fibrils (Raposo and Marks, 2007), giving rise to mature melanosomes that are densely packed with melanin (Figure 4A, left panel). In OCA1A-iRPE where the TYR gene is mutated and TYR protein is not functional, we did not observe any evidence of melanin accumulation in the melanosomes (Figure 3A). However, in the OCA2-iRPE where the P gene/OCA2 is mutated and TYR is present, we did observe melanin accumulation (Figure 4A, right panel). Furthermore, although melanosomes matured and attained stage IV morphology in OCA2-iRPE, they were not as densely packed with melanin compared to mature stage IV melanosomes of CTRL-iRPE (Figure 4A). The identification of stage III and Ⅳ melanosomes in OCA2-iRPE was unexpected and suggests that all stages of melanosome biogenesis are functional to some extent in OCA2. We further performed immunofluorescence staining for TYR, which is known to be present on maturing and mature stage III and IV melanosomes (Raposo et al., 2001; Raposo and Marks, 2007), and observed a punctate staining pattern in CTRL- and OCA2-iRPE but not in OCA1A-iRPE, which lacks functional TYR protein (Figure 4B). Western blot analysis of whole cell lysates detected the presence of TYR and P protein/OCA2 in all RPE lines studied (Figure S4). We next immunostained the iRPE monolayer for TYRP2, which is involved in melanin synthesis, known to localize in mature melanosomes (Kalyanasundram et al., 2015), and predicted to be present in CTRL as well as in both OCA-iRPE cells. We observed significantly higher TYRP2-positive punctate fluorescent signal in CTRL-iRPE and OCA2-iRPE compared with OCA1A-iRPE (Figures 4C and S5A), suggesting that in OCA1A-iRPE cells, melanin is not synthesized and accumulated in pre-melanosomes, whereas in OCA2-iRPE, some melanin synthesis and accumulation occurs. The TYRP2 immunofluorescent signal observed in OCA-iRPE was mis-localized either in the cytoplasm or around the nucleus, as shown in higher magnification images of TYRP2 localization pattern (Figure S5B). Lack of heavily pigmented melanosomes and absent punctate staining pattern of TYRP2 in OCA-iRPE suggests later stage maturation defects. We posit that increased degeneration observed in the OCA-iRPE cells could be a way of removing defective melanosomes.
Figure 4.

Differential localization pattern of TYR and TYRP2 proteins in OCA-iRPE
(A) TEM microphotographs of mature melanosomes in control (CTRL) and defective mature melanosomes observed in OCA2-iRPE cells. Scale bar represents 500 nm in both panels.
(B) Confocal microscopy microphotographs of TYR immunofluorescence and (C) of TYRP2 and ZO-1 immunofluorescence staining in iRPE cells. Scale bar represents 5 μm in (B) and 10 μm and 2.5x zoom in (C).
OCA-iRPE forms a polygonal, polarized epithelial monolayer comparable to pigmented iRPE
Characteristic features of RPE monolayers in vivo and in vitro are the hexagonal cell packing and polarization (Maminishkis et al., 2006). Iwai-Takekoshi et al. (2016) performed morphometric analysis of RPE cells of albino mouse and observed significant changes in cell area, solidity, and eccentricity, whereas compactness, perimeter, and form did not differ between albino and pigmented mouse RPE. We recently developed a sensitive method to analyze RPE cell morphometry (Schaub et al., 2020) and performed morphometric analysis on CTRL- and OCA-iRPE immunostained for ZO-1, a protein localized at the apical tight junctions that marks the cell-cell border (Figure 5A, top row, first and second panel). We extracted data for a total of 23 different morphological parameters and found them comparable in CTRL- and OCA-iRPE (Figure 5A). In particular, the polygonality and hexagonality scores of the CTRL- and OCA-iRPE showed no significant differences (Figures 5B and 5C). This was further confirmed by the fact that in both groups, a majority of cells have six neighboring cells (Figure 5D). Area, perimeter, orientation of the cells, and length of the major axis were also similar between CTRL- and OCA-iRPE cells (Figures 5E–5H). Ultimately, morphometric analysis indicated that CTRL- and OCA-iRPE monolayers are indistinguishable.
Figure 5.

Morphological properties of control and OCA-iRPE cells are similar morphometric parameters analyzed in control (CTRL)-, OCA1A-, and OCA2-iRPE monolayers (N = 20,703 cells for each group), where N is represents pooled data from a single differentiation event of four different lines in each group
(A) Segmented cell data (first and second panel) was used to analyze 23 different morphometric parameters (subsequent panels) where individual cells were color coded.
(B–H) The morphological parameters analyzed included the following: (B) polygonality, a measure of how like convex regular polygons each cell is; (C) hexagonality, a measure of how like a hexagon specifically each cell is; (D) neighbors, how many neighbors each cell has; (E) area of the cell; (F) perimeter of the cell; (G) orientation of the cell within the monolayer; and (H) length of major axis of the cell.
The RPE monolayer is located between the photoreceptors on the apical side and the choroid on the basal side. Attainment of apical-basal polarity is necessary for the RPE monolayer to perform its function in the eye (Zou et al., 2008). The polarized organization of CTRL- and OCA-iRPE monolayers was analyzed using immunofluorescence staining for ezrin and collagen IV, which are present on the apical and basal side, respectively (Figure 6A). In orthogonal projections, ezrin staining was localized selectively to the apical side (Figure 6A, red fluorescence) and collagen IV on the basal side (Figure 6A, green fluorescence) of CTRL-, OCA1A-, and OCA2-iRPE monolayers. Although we observed separation of the ezrin (red) and collagen IV (green) signals suggesting apical-basal polarization, the ezrin signal intensity appeared reduced in both OCA1A- and OCA2-1-iRPE monolayers. A characteristic feature of the apical side of the RPE is the presence of processes that serve to increase the surface area interacting with photoreceptor outer segments (Bonilha et al., 2006). We studied the apical processes of CTRL- and OCA-iRPE using scanning electron microscopy (SEM). A dense cover of apical processes was observed in CTRL- and OCA-iRPE suggesting proper morphogenesis at the apical side of all iRPE monolayers (Figure 6B). However, we noted that some apical processes in the OCA1A-iRPE were club-shaped (Figure 6B center panels, white arrow). This abnormal morphology was not observed in OCA2- or CTRL-iRPE. Although the significance of the club-shaped processes is unclear, the difference between OCA1A and OCA2 iRPE suggests they may be related to the degree of hypopigmentation. Because such defects have never been reported in animal models of albinism, we cannot rule out a cell-culture-specific artifact. Altogether, these data suggest that polarization is successfully established in both OCA-iRPE types, despite qualitatively reduced ezrin signal intensity and abnormally shaped apical processes in OCA1A-iRPE.
Figure 6.

Control and OCA-iRPE cells attain proper apical-basal polarization
(A) Confocal microphotographs of ezrin and collagen IV immunofluorescence in orthogonal view in control (CTRL)- and OCA-iRPE. Scale bar represents 10 μm and 2.5x zoom.
(B) Scanning electron microscopy (SEM) microphotographs (top view) of apical processes present on the apical side of iRPE cells. Scale bar represents 10 μm (left column) and 5 μm (right column). The white arrow in the middle right panel denotes club-shaped apical processes observed in OCA1A lines.
Apical junctional integrity is maintained in the OCA2-iRPE monolayer
RPE exhibits specialized junctions on the apical side (Rizzolo, 2007). It has been suggested that albino mouse RPE have cell-cell adhesion defects based upon differences observed in the immunolocalization pattern of the junctional protein P-cadherin (Iwai-Takekoshi et al., 2016). We characterized OCA-iRPE apical tight junctions by immunofluorescence staining with cell junctional markers and transepithelial resistance (TER) measurements. In CTRL-iRPE, we observed strong fluorescent signals for F-actin at the cell borders and apical processes, pan-cadherin signal at the cell borders and in the cytoplasm, whereas ZO-1 and β-catenin were observed predominantly at the cell borders only (Figure 7A). F-actin immunostaining appeared reduced in the apical processes in both OCA1A-iRPE lines but not in OCA2-iRPE (Figure 7A). Pan-cadherin antibody, which detects the conserved domain of E, N, P, and R-cadherin proteins, displayed a variable staining pattern across the different lines. We observed similar staining patterns with the β-catenin antibody, as described by Iwai-Takekoshi et al. (2016), where the fluorescent signal was observed in multiple z planes in both OCA1A- and one of the two OCA2-iRPE monolayers but not in the CTRL-iRPE (Figures 7A and 7B, white arrows). We observed no differences in the staining pattern of ZO-1 protein between CTRL- and OCA-iRPE (Figures 7A and 7B). The apparent increase in cytoplasmic signal for all the observed markers in OCA-iRPE is most likely an artifact due to the reduction or absence of pigmentation. This is also evident from the nuclear staining pattern where the nuclei (blue) are readily visible in OCA-iRPE and somewhat obscured in CTRL-iRPE. To assess junctional integrity in OCA-iRPE, we determined the TER of the RPE monolayers. TER is a measure of electrical resistance across the RPE monolayer and is a sensitive and reliable method to assess the functional integrity of the monolayer. In general, values ≥400Ω·cm2 are considered normal. Control and albinism lines all met this standard, although values for OCA1A iRPE were generally lower than either CTRL or OCA2 lines (Figure 7C). Furthermore, apical tight junctions appeared comparable in CTRL and OCA-iRPE by TEM (Figure S6) with no detectable abnormalities in the OCA1A-iRPE that could explain the lower, yet within norm, TER values.
Figure 7.

Differential localization of pan-cadherin and β-catenin in OCA-iRPE
(A) Confocal microscopy microphotographs of F-Actin, pan-cadherin, ZO-1, and β-catenin immunofluorescence on control (CTRL)- and OCA-iRPE. Scale bar represents 20 μm and 2.5x zoom.
(B) Higher magnification of ZO-1 and β-catenin immunofluorescence on control (CTRL)- and OCA-iRPE monolayers shown in (A). White arrows indicate mis-localized β-catenin staining. Scale bar represents 5 μm.
(C) Transepithelial resistance of iRPE monolayers cultured on trans-well membranes. Purple dots: line 1, Orange dots: line 2. N = 20 unique trans-wells for each group, from four different lines in each group differentiated in a single experiment. The dotted line indicates our lab's lower threshold for healthy RPE (400 Ω·cm2). The horizontal lines in the boxplots indicate the median, the boxes indicate the first and third quartiles, and the whiskers indicate 5th and 95th percentile.
Discussion
OCA1A and OCA2, caused by mutations in TYR and P GENE/OCA2, respectively, are the two most severe and prevalent forms of OCA, with no treatments currently available. Patient-derived iPSC lines can provide a consistent source of human tissue otherwise difficult to obtain. Differentiation into RPE and other cell types including melanocytes (Yang et al., 2011), RGCs (Ji and Tang, 2019), astrocytes (Soubannier et al., 2020), and neurons (D’Aiuto et al., 2014) allow for the establishment of in vitro platforms for drug discovery as well as the investigation of the molecular and cellular basis of developmental events leading to vision defects in OCA. Here, we describe the derivation of iPSC lines from OCA1A and OCA2 patients and their successful differentiation toward iRPE.
Our protocol follows in vivo developmental steps, with a triphasic signaling pathway directing pluripotent cells to RPE cell identity (Sharma et al., 2019). Differentiation starts with the commitment of iPSCs toward RPE-primed neuroectoderm using a dual Smad, canonical Wnt, and FGF inhibition. Subsequently, dual Smad inhibition alone commits the cells to the RPE progenitor stage. Differentiation requires activation of TGF-signaling pathways, and maturation of RPE cells involves downregulation of the canonical Wnt pathway. The first phase of the protocol significantly increases expression of the eye-field transcription factors PAX6, RAX, OTX1, and SIX3. In the second phase, expression of the RPE-specific transcription factors PAX6, MITF, and OTX2 is increased, generating RPE-committed cells. In the third phase, cells mature and start expressing RPE makers like RPE65 (Sharma et al., 2019). We further use a combination of negative selection, differential plating, and monolayer maturing factors to generate a pure RPE (∼100%) monolayer tissue.
Our strategy for RPE differentiation is different from other published protocols that use the embryoid body differentiation method to derive RPE from embryonic stem cells (Limnios et al., 2021). The differentiation protocol developed by Limnios et al. (2021) uses the initial dual Smad and Wnt inhibition strategy similar to ours, followed by Wnt activation for RPE specification, and takes 28 days to generate mature RPE cells. In our monolayer method, we do not re-activate Wnt signaling and obtain RPE cells after 40 days of differentiation, which is in line with human in utero eye development. In another publication (Davis et al., 2017), RPE cell cultures were derived from adult RPE stem cells present in the human eye. Those cells, obtained from donor cadaver eyes, were expanded as primary adherent cultures and allowed to mature in vitro for up to eight weeks in defined medium. Because of their adult origin and because they are already committed to the RPE lineage, the differentiation protocol does not require reproducing the developmental program from pluripotent stem cells to terminally differentiated RPE as it is the case of the protocol we adopted. Notably, adult RPE-stem-cell-derived RPE cells injected subretinally were able to preserve vision in a rat model of RPE cell dysfunction (Davis et al., 2017). These studies further highlight the utility and clinical applications of stem-cell-derived RPE cells.
The OCA-iRPE monolayer faithfully recapitulates the pigmentation defects observed in OCA patients' eyes, making it not only a robust in vitro model of disease, but also a powerful tool to investigate melanosome biogenesis at the cellular level. The lower level of pigmentation observed in OCA-iRPE was the result of reduced pigmented melanosomes in OCA1A and OCA2-iRPE compared with CTRL-iRPE. We hypothesize that the reduced number of mature melanosomes is due in part to degeneration of pre-melanosomes that fail to mature. Our observation of pre-melanosomes in OCA-iRPE suggests their ongoing biogenesis, although we cannot rule out the possibility of defects in the biogenesis itself contributing to a lower melanosome number.
Our data show that pre-melanosomes (stage I and stage II) are formed in OCA1A-iRPE, suggesting that functional TYR protein is dispensable for early melanosome formation. On the other hand, stage I and stage II melanosomes were rarely observed in the iRPE monolayers from unaffected individuals, suggesting a concomitant maturation process. A complete lack of more mature stage III and stage IV melanosomes in OCA1A-iRPE is consistent with previous observations that TYR and/or melanin play an important role in the maturation process of melanosomes (Paterson et al., 2015). Both in the Tyr mutant mouse (c-2J) model (Iwai-Takekoshi et al., 2016) and in tissue samples from human cadaver eye (Fulton et al., 1978), the authors report the presence of immature melanosomes and a lack of mature melanosomes, suggesting our in vitro model robustly recapitulates the in vivo disease biology.
In OCA2-iRPE, we consistently observed melanosomes in stages I–IV with characteristic oval and round shapes. Compared to stage IV mature melanosomes in CTRL-iRPE, the mature melanosomes in the OCA2-iRPE were less densely pigmented, suggesting defects in melanin deposition. In skin and RPE melanosomes, P protein (OCA2) is responsible for chloride-selective anion conductance, thereby regulating melanosomal pH (Bellono et al., 2014). Disruption of P protein/OCA2 function could cause melanosomal pH imbalance, resulting in suboptimal TYR enzymatic activity and melanin deficit (Bellono et al., 2014). Given that we routinely observed stage IV melanosomes in OCA2-iRPE monolayers, we posit that melanosome biogenesis and maturation pathways are functional but not as efficient as in CTRL-iRPE. A recent report demonstrates that SLC45A2 (OCA4) also plays a role in deacidifying melanosomes and is probably the major regulator of this process for later stage melanosomes (Le et al., 2020). In OCA2-iRPE, SLC45A2 may be compensating for a dysfunctional P protein/OCA2, facilitating the stabilization of earlier stage melanosomes and their partial maturation. It is tempting to speculate that small molecule drugs modulating melanosomal pH could be a viable strategy for rescuing pigmentation defects in OCA2-iRPE as a proof of principle for clinical applications, as it has also been reported for lysosomal storage disorders (Nicoli et al., 2019).
Animal models of various types of OCA are well characterized and recapitulate pigmentation defects robustly, shedding light on the cellular nature of these defects (OCA1A: Onojafe et al., 2011; Zhou et al., 2015; Wu et al., 2020; OCA2: Rinchik et al., 1993; Ishikawa et al., 2015; Wu et al., 2020; OCA3: Onojafe et al., 2018; OCA4: Winkler et al., 2014; OCA6: Yousaf et al., 2020; OA1: Incerti et al., 2000). Most of these studies are focused on melanosome biogenesis defects in melanocytes and very few on RPE defects. An advantage of using animal models is the ability to understand retinal development in the pigmented and the albino eyes; conversely, the drawbacks include the lack of a fovea and differences in the retino-tectal targeting in rodents. However, are there differences in the physiology of the RPE between rodents and humans? This question is especially important to address as prior research suggests that the RPE is a developmental regulator of retinogenesis (Raymond and Jackson, 1995; Jeffery, 1998; Martínez-Morales et al., 2004; Bharti et al., 2006; Fuhrmann et al., 2014). Gap junctions located at the interface of RPE and the developing rat neural retina play an essential role in retinal mitosis, and higher mitotic levels are detected in albino retinas that correlate with higher Connexin43 immunostaining (Tibber et al., 2007). Cell-cycle arrest in a population of peripheral RPE cells in albino rats results in multi-nucleated RPE cells (Adams et al., 2010). A higher percentage of large, abnormally shaped RPE cells with large, elliptical, and fragmented nuclei are also visible in the peripheral retina of albino rats, compared to pigmented rats. Recently, Iwai-Takekoshi et al. (2016) reported significantly lower melanosome numbers, localized predominantly toward the apical side of the RPE in the Tyr mutant mouse strain (c-2J). The authors also reported differences in the immunostaining pattern of P-cadherin in pigmented and albino RPE, and suggested cell-cell adhesion defects in albino mouse RPE. We observed a similar staining pattern with pan-cadherin and β-catenin antibodies in both OCA1A- and OCA2-iRPE, but we did not observe compromised junctional integrity as determined by TER measurements of the iRPE monolayer in OCA2-iRPE. In human OCA patients as well, no such defects have been observed or reported (as would be evidenced by retinal fluid accumulation), to the best of our knowledge. Further studies are underway to determine the reason for the partly reduced TER and abnormal junctional protein markers staining pattern in OCA1A-iRPE.
Though valuable for developmental research, animal models of albinism are not suitable for high-throughput drug discovery studies. Currently, there is limited availability of human cell lines for studying melanogenesis and pigmentation defects. We have shown that our in vitro OCA-iRPE model faithfully recapitulates the in vivo biology of the human disease and predict that other differentiated tissues (e.g., melanocytes) derived from OCA-iPSCs will behave similarly. High-throughput drug discovery studies (drug vs. vehicle) could be performed to identify molecules that can rescue the pigmentation defects of OCA-iRPE (e.g., by spectrophotometric measurements), setting the stage for further animal studies. Therefore, the patient-derived OCA1A- and OCA2-iPSCs we generated constitute a renewable and reproducible source of cells for the production of target cell and/or tissue types. In vitro derived OCA tissues and OCA-iRPE will allow deeper understanding of melanogenesis, enable the identification of molecules to rescue pigmentation defects, and further probe for molecular and/or physiologic differences.
Experimental procedures
Reprogramming and characterization of human iPSCs
All human iPSC-related work was approved by NIH institutional review board protocol #11-E1-0245 (NCT01432847), and informed consent was obtained from all subjects. Detailed protocols for reprogramming and characterization are provided in supplemental experimental procedures. In vivo teratoma assay was performed by injecting iPSCs in immuno-compromised mice (NOD-SCID, The Jackson Laboratory), as described earlier (Nelakanti et al., 2015). Karyotyping was performed by Cell Line Genetics (Madison, WI, USA).
Differentiation of iPSCs to RPE
iPSCs were differentiated into RPE (iRPE) using a previously published protocol (Sharma et al., 2019). Detailed protocol for differentiation is provided in supplemental experimental procedures.
Immunostaining of iPSC colonies and iRPE monolayers
Immunostaining of iPSC colonies and iRPE monolayers was performed as previously described (Sharma et al., 2019). Detailed protocols are provided in supplemental experimental procedures.
Scanning electron microscopy and transmission electron microscopy
Detailed protocols for SEM and TEM are provided in supplemental experimental procedures.
Confocal and bright field microscopy
For routine observation of iPSC and iRPE cell cultures and bright field imaging, a Zeiss Vert.A1 (ZEISS, White Plains, NY, USA) inverted microscope was used. Confocal microscopy was performed using ZEISS LSM 880 and 700 microscopes.
Shape metric analysis of iRPE monolayers
Shape metric analysis of cells was performed as previously described (Schaub et al., 2020; Sharma et al., 2019). Detailed protocol is provided in supplemental experimental procedures.
Western blotting
Western blotting of whole cell lysates from iRPE monolayers was performed as previously described (Sharma et al., 2019). Detailed protocol is provided in supplemental experimental procedures.
Author contributions
B.P.B. and A.G. conceived and designed the study. D.A. provided patient primary dermal fibroblast cultures. R.S., A.G., and T.P. performed iPSC work and differentiation studies. D.B. and C.D. helped with maintenance of iPSC and RPE cultures. A.G., R.S., T.P., and C.D. performed experiments. M.A.A. performed transmission electron microscopy and J.C. performed scanning electron microscopy. N.H. performed shape metrics and morphometric analysis. A.G. and T.P. carried out confocal laser scanning microscopy. A.G. and T.C. compiled results and wrote the manuscript. B.P.B. and K.B. contributed reagents, equipment, lab space and supervised the study. B.P.B., K.B., and T.C. corrected and approved the final draft of the manuscript. All the authors contributed, read. and approved the final draft of the manuscript.
Conflict of interests
Dr. Bharti is inventor on a US patent: Method for generating retinal pigment epithelium (RPE) from induced pluripotent stem cells (iPSCs), Patent #: 10480031.
Acknowledgments
We are grateful to the patients and their families for participation. We thank Dr. Robert Farris (NEI, Biological Imaging Core) for expert assistance with confocal laser scanning microscopy and Dr. Maria Mercedes Campos (NEI, Histopathology Core Facility) for teratoma histology and staining. This work was supported by the intramural program of the National Eye Institute/National Institutes of Health, USA (EY000470), Vision for Tomorrow Scientific Research Grant-2017 (The Vision for Tomorrow Foundation) to B.P.B. and A.G., and Pediatric Ophthalmology Career-Starter Research Grants-2018 (Knights Templar Eye Foundation, Inc.) to A.G.
Published: January 11, 2022
Footnotes
Supplemental information can be found online at https://doi.org/10.1016/j.stemcr.2021.11.016.
Supplemental information
References
- Adams D.R., Menezes S., Jauregui R., Valivullah Z.M., Power B., Abraham M., Jeffrey B.G., Garced A., Alur R.P., Cunningham D., et al. One-year pilot study on the effects of nitisinone on melanin in patients with OCA-1B. JCI Insight. 2019;4:e124387. doi: 10.1172/jci.insight.124387. [DOI] [PMC free article] [PubMed] [Google Scholar]
- Adams T., Shahabi G., Hoh-Kam J., Jeffery G. Held under arrest: many mature albino RPE cells display polyploidal features consistent with abnormal cell cycle retention. Exp. Eye Res. 2010;90:368–372. doi: 10.1016/j.exer.2009.10.002. [DOI] [PubMed] [Google Scholar]
- Ballantyne C. What causes albinism? Scientific American. 2009. https://www.scientificamerican.com/article/killing-albinos-tanzania-albinism/
- Beermann F., Schmid E., Schütz G. Expression of the mouse tyrosinase gene during embryonic development: recapitulation of the temporal regulation in transgenic mice. Proc. Natl. Acad. Sci. U S A. 1992;89:2809–2813. doi: 10.1073/pnas.89.7.2809. [DOI] [PMC free article] [PubMed] [Google Scholar]
- Bellono N.W., Escobar I.E., Lefkovith A.J., Marks M.S., Oancea E. An intracellular anion channel critical for pigmentation. Elife. 2014;3:e04543. doi: 10.7554/eLife.04543. [DOI] [PMC free article] [PubMed] [Google Scholar]
- Bharti K., Nguyen M.T.T., Skuntz S., Bertuzzi S., Arnheiter H. The other pigment cell: specification and development of the pigmented epithelium of the vertebrate eye. Pigment Cell Res. 2006;19:380–394. doi: 10.1111/j.1600-0749.2006.00318.x. [DOI] [PMC free article] [PubMed] [Google Scholar]
- Bonilha V.L., Rayborn M.E., Bhattacharya S.K., Gu X., Crabb J.S., Crabb J.W., Hollyfield J.G. Retinal Degenerative Diseases. Springer; 2006. The retinal pigment epithelium apical microvilli and retinal function; pp. 519–524. [DOI] [PMC free article] [PubMed] [Google Scholar]
- D’Aiuto L., Zhi Y., Kumar Das D., Wilcox M.R., Johnson J.W., McClain L., MacDonald M., Di Maio R., Schurdak M., Piazza P., et al. Large-scale generation of human iPSC-derived neural stem cells/early neural progenitor cells and their neuronal differentiation. Organogenesis. 2014;10:365–377. doi: 10.1080/15476278.2015.1011921. [DOI] [PMC free article] [PubMed] [Google Scholar]
- Davis R.J., Alam N.M., Zhao C., Müller C., Saini J.S., Blenkinsop T.A., Mazzoni F., Campbell M., Borden S.M., Charniga C.J., et al. The developmental stage of adult human stem cell-derived retinal pigment epithelium cells influences transplant efficacy for vision rescue. Stem Cell Reports. 2017;9:42–49. doi: 10.1016/j.stemcr.2017.05.016. [DOI] [PMC free article] [PubMed] [Google Scholar]
- Fuhrmann S., Zou C., Levine E.M. Retinal pigment epithelium development, plasticity, and tissue homeostasis. Exp. Eye Res. 2014;123:141–150. doi: 10.1016/j.exer.2013.09.003. [DOI] [PMC free article] [PubMed] [Google Scholar]
- Fulton A.B., Albert D.M., Craft J.L. Human albinism: light and electron microscopy study. Arch. Ophthalmol. 1978;96:305–310. doi: 10.1001/archopht.1978.03910050173014. [DOI] [PubMed] [Google Scholar]
- Gargiulo A., Bonetti C., Montefusco S., Neglia S., Di Vicino U., Marrocco E., Corte M.D., Domenici L., Auricchio A., Surace E.M. AAV-mediated tyrosinase gene transfer restores melanogenesis and retinal function in a model of oculo-cutaneous albinism type I (OCA1) Mol. Ther. 2009;17:1347–1354. doi: 10.1038/mt.2009.112. [DOI] [PMC free article] [PubMed] [Google Scholar]
- Incerti B., Cortese K., Pizzigoni A., Surace E.M., Varani S., Coppola M., Jeffery G., Seeliger M., Jaissle G., Bennett D.C., et al. Oa1 knock-out: new insights on the pathogenesis of ocular albinism type 1. Hum. Mol. Genet. 2000;9:2781–2788. doi: 10.1093/hmg/9.19.2781. [DOI] [PubMed] [Google Scholar]
- Ishikawa A., Sugiyama M., Hondo E., Kinoshita K., Yamagishi Y. Development of a novel pink-eyed dilution mouse model showing progressive darkening of the eyes and coat hair with aging. Exp. Anim. 2015;64:207–220. doi: 10.1538/expanim.14-0101. [DOI] [PMC free article] [PubMed] [Google Scholar]
- Iwai-Takekoshi L., Ramos A., Schaler A., Weinreb S., Blazeski R., Mason C. Retinal pigment epithelial integrity is compromised in the developing albino mouse retina. J. Comp. Neurol. 2016;524:3696–3716. doi: 10.1002/cne.24025. [DOI] [PMC free article] [PubMed] [Google Scholar]
- Jeffery G. The retinal pigment epithelium as a developmental regulator of the neural retina. Eye. 1998;12:499–503. doi: 10.1038/eye.1998.137. [DOI] [PubMed] [Google Scholar]
- Jeffery G. The albino retina: an abnormality that provides insight into normal retinal development. Trends Neurosci. 1997;20:165–169. doi: 10.1016/s0166-2236(96)10080-1. [DOI] [PubMed] [Google Scholar]
- Ji S.L., Tang S.B. Differentiation of retinal ganglion cells from induced pluripotent stem cells: a review. Int. J. Ophthalmol. 2019;12:152. doi: 10.18240/ijo.2019.01.22. [DOI] [PMC free article] [PubMed] [Google Scholar]
- Kalyanasundram J., Chia S.L., Song A.A.L., Raha A.R., Young H.A., Yusoff K. Surface display of glycosylated Tyrosinase related protein-2 (TRP-2) tumour antigen on Lactococcus lactis. BMC Biotechnol. 2015;15:1–10. doi: 10.1186/s12896-015-0231-z. [DOI] [PMC free article] [PubMed] [Google Scholar]
- Karaman A. Oculocutaneous albinism type 1A: a case report. Dermatol. Online J. 2008;14:13. [PubMed] [Google Scholar]
- Le L., Escobar I.E., Ho T., Lefkovith A.J., Latteri E., Haltaufderhyde K.D., Dennis M.K., Plowright L., Sviderskaya E.V., Bennett D.C., et al. SLC45A2 protein stability and regulation of melanosome pH determine melanocyte pigmentation. Mol. Biol. Cell. 2020;31:2687–2702. doi: 10.1091/mbc.E20-03-0200. [DOI] [PMC free article] [PubMed] [Google Scholar]
- Le K.T., Schachter J., Quigley M.G. The role of melanin in protecting the skin and the retina from light damage: a comparative biological framework for age-related macular degeneration. Invest. Ophthalmol. Vis. Sci. 2014;55:627. [Google Scholar]
- Limnios I.J., Chau Y.Q., Skabo S.J., Surrao D.C., O’Neill H.C. Efficient differentiation of human embryonic stem cells to retinal pigment epithelium under defined conditions. Stem Cell Res. Ther. 2021;12:248. doi: 10.1186/s13287-021-02316-7. [DOI] [PMC free article] [PubMed] [Google Scholar]
- Mabula J.B., Chalya P.L., Mchembe M.D., Jaka H., Giiti G., Rambau P., Masalu N., Kamugisha E., Robert S., Gilyoma J.M. Skin cancers among Albinos at a University teaching hospital in Northwestern Tanzania: a retrospective review of 64 cases. BMC Dermatol. 2012;12:1–7. doi: 10.1186/1471-5945-12-5. [DOI] [PMC free article] [PubMed] [Google Scholar]
- Maminishkis A., Chen S., Jalickee S., Banzon T., Shi G., Wang F.E., Ehalt T., Hammer J.A., Miller S.S. Confluent monolayers of cultured human fetal retinal pigment epithelium exhibit morphology and physiology of native tissue. Invest. Ophthalmol. Vis. Sci. 2006;47:3612–3624. doi: 10.1167/iovs.05-1622. [DOI] [PMC free article] [PubMed] [Google Scholar]
- Marçon C.R., Maia M. Albinism: epidemiology, genetics, cutaneous characterization, psychosocial factors. An. Bras. Dermatol. 2019;94:503–520. doi: 10.1016/j.abd.2019.09.023. [DOI] [PMC free article] [PubMed] [Google Scholar]
- Martínez-Morales J.R., Rodrigo I., Bovolenta P. Eye development: a view from the retina pigmented epithelium. Bioessays. 2004;26:766–777. doi: 10.1002/bies.20064. [DOI] [PubMed] [Google Scholar]
- May-Simera H.L., Wan Q., Jha B.S., Hartford J., Khristov V., Dejene R., Chang J., Patnaik S., Lu Q., Banerjee P., et al. Primary cilium-mediated retinal pigment epithelium maturation is disrupted in ciliopathy patient cells. Cell Rep. 2018;22:189–205. doi: 10.1016/j.celrep.2017.12.038. [DOI] [PMC free article] [PubMed] [Google Scholar]
- Nelakanti R.V., Kooreman N.G., Wu J.C. Teratoma formation: a tool for monitoring pluripotency in stem cell research. Curr. Protoc. Stem Cell Biol. 2015;32:4A–8A. doi: 10.1002/9780470151808.sc04a08s32. [DOI] [PMC free article] [PubMed] [Google Scholar]
- Nicoli E.R., Weston M.R., Hackbarth M., Becerril A., Larson A., Zein W.M., Baker P.R., Burke J.D., Dorward H., Davids M., et al. Undiagnosed Diseases Network Lysosomal storage and albinism due to effects of a de novo CLCN7 variant on lysosomal acidification. Am. J. Hum. Genet. 2019;104:1127–1138. doi: 10.1016/j.ajhg.2019.04.008. [DOI] [PMC free article] [PubMed] [Google Scholar]
- Okulicz J.F., Shah R.S., Schwartz R.A., Janniger C.K. Oculocutaneous albinism. J. Eur. Acad. Dermatol. Venereol. 2003;17:251–256. doi: 10.1046/j.1468-3083.2003.00767.x. [DOI] [PubMed] [Google Scholar]
- Onojafe I.F., Adams D.R., Simeonov D.R., Zhang J., Chan C.C., Bernardini I.M., Sergeev Y.V., Dolinska M.B., Alur R.P., Brilliant M.H., et al. Nitisinone improves eye and skin pigmentation defects in a mouse model of oculocutaneous albinism. J. Clin. Invest. 2011;121:3914–3923. doi: 10.1172/JCI59372. [DOI] [PMC free article] [PubMed] [Google Scholar]
- Onojafe I.F., Megan L.H., Melch M.G., Aderemi J.O., Alur R.P., Abu-Asab M.S., Chan C., Bernardini I.M., Albert J.S., Cogliati T., et al. Minimal efficacy of nitisinone treatment in a novel mouse model of oculocutaneous albinism, type 3. Invest. Ophthalmol. Vis. Sci. 2018;59:4945–4952. doi: 10.1167/iovs.16-20293. [DOI] [PMC free article] [PubMed] [Google Scholar]
- Paterson E.K., Fielder T.J., MacGregor G.R., Ito S., Wakamatsu K., Gillen D.L., Eby V., Boissy R.E., Ganesan A.K. Tyrosinase depletion prevents the maturation of melanosomes in the mouse hair follicle. PLoS One. 2015;10:e0143702. doi: 10.1371/journal.pone.0143702. [DOI] [PMC free article] [PubMed] [Google Scholar]
- Raposo G., Marks M.S. Melanosomes-dark organelles enlighten endosomal membrane transport. Nat. Rev. Mol. Cell. Biol. 2007;8:786–797. doi: 10.1038/nrm2258. [DOI] [PMC free article] [PubMed] [Google Scholar]
- Raposo G., Tenza D., Murphy D.M., Berson J.F., Marks M.S. Distinct protein sorting and localization to premelanosomes, melanosomes, and lysosomes in pigmented melanocytic cells. J. Cell Biol. 2001;152:809–823. doi: 10.1083/jcb.152.4.809. [DOI] [PMC free article] [PubMed] [Google Scholar]
- Raymond S.M., Jackson I.J. The retinal pigmented epithelium is required for development and maintenance of the mouse neural retina. Curr. Biol. 1995;5:1286–1295. doi: 10.1016/s0960-9822(95)00255-7. [DOI] [PubMed] [Google Scholar]
- Rinchik E.M., Bultman S.J., Horsthemke B., Lee S.T., Strunk K.M., Spritz R.A., Avidano K.M., Jong M.T.C., Nicholls R.D. A gene for the mouse pink-eyed dilution locus and for human type II oculocutaneous albinism. Nature. 1993;361:72–76. doi: 10.1038/361072a0. [DOI] [PubMed] [Google Scholar]
- Rizzolo L.J. Development and role of tight junctions in the retinal pigment epithelium. Int. Rev. Cytol. 2007;258:195–234. doi: 10.1016/S0074-7696(07)58004-6. [DOI] [PubMed] [Google Scholar]
- Schaub N.J., Hotaling N.A., Manescu P., Padi S., Wan Q., Sharma R., George A., Chalfoun J., Simon M., Ouladi M., et al. Deep learning predicts function of live retinal pigment epithelium from quantitative microscopy. J. Clin. Invest. 2020;130:1010–1023. doi: 10.1172/JCI131187. [DOI] [PMC free article] [PubMed] [Google Scholar]
- Seiji M., Fitzpatrick T.B., Simpson R.T. Chemical composition and terminology of specialized organelles (melanosomes and melanin granules) in mammalian melanocytes. Nature. 1963;197:1082–1084. doi: 10.1038/1971082a0. [DOI] [PubMed] [Google Scholar]
- Sharma R., Khristov V., Rising A., Jha B.S., Dejene R., Hotaling N., Li Y., Stoddard J., Stankewicz C., Wan Q., et al. Clinical-grade stem cell–derived retinal pigment epithelium patch rescues retinal degeneration in rodents and pigs. Sci. Transl. Med. 2019;11:eaat5580. doi: 10.1126/scitranslmed.aat5580. [DOI] [PMC free article] [PubMed] [Google Scholar]
- Soubannier V., Maussion G., Chaineau M., Sigutova V., Rouleau G., Durcan T.M., Stifani S. Characterization of human iPSC-derived astrocytes with potential for disease modeling and drug discovery. Neurosci. Lett. 2020;731:135028. doi: 10.1016/j.neulet.2020.135028. [DOI] [PubMed] [Google Scholar]
- Tibber M.S., Becker D., Jeffery G. Levels of transient gap junctions between the retinal pigment epithelium and the neuroblastic retina are influenced by catecholamines and correlate with patterns of cell production. J. Comp. Neurol. 2007;503:128–134. doi: 10.1002/cne.21388. [DOI] [PubMed] [Google Scholar]
- Usher C.H. Histological examination of an adult human albino's eyeball, with a note on mesoblastic pigmentation in foetal eyes. Biometrika. 1920;13:46–56. [Google Scholar]
- Winkler P.A., Gornik K.R., Ramsey D.T., Dubielzig R.R., Venta P.J., Petersen-Jones S.M., Bartoe J.T. A partial gene deletion of SLC45A2 causes oculocutaneous albinism in Doberman pinscher dogs. PLoS One. 2014;9:e92127. doi: 10.1371/journal.pone.0092127. [DOI] [PMC free article] [PubMed] [Google Scholar]
- Wu K.C., Lv J.N., Yang H., Yang F.M., Lin R., Lin Q., Shen R.J., Wang J.B., Duan W.H., Hu M., et al. Nonhuman primate model of oculocutaneous albinism with TYR and OCA2 mutations. Research. 2020;2020:1658678. doi: 10.34133/2020/1658678. [DOI] [PMC free article] [PubMed] [Google Scholar]
- Yang R., Jiang M., Kumar S.M., Xu T., Wang F., Xiang L., Xu X. Generation of melanocytes from induced pluripotent stem cells. J. Invest. Dermatol. 2011;131:2458–2466. doi: 10.1038/jid.2011.242. [DOI] [PMC free article] [PubMed] [Google Scholar]
- Yousaf S., Sethna S., Chaudhary M.A., Shaikh R.S., Riazuddin S., Ahmed Z.M. Molecular characterization of SLC24A5 variants and evaluation of Nitisinone treatment efficacy in a zebrafish model of OCA6. Pigment Cell Melanoma Res. 2020;33:556–565. doi: 10.1111/pcmr.12879. [DOI] [PMC free article] [PubMed] [Google Scholar]
- Zhou X., Xin J., Fan N., Zou Q., Huang J., Ouyang Z., Zhao Y., Zhao B., Liu Z., Lai S., et al. Generation of CRISPR/Cas9-mediated gene-targeted pigs via somatic cell nuclear transfer. Cell Mol. Life Sci. 2015;72:1175–1184. doi: 10.1007/s00018-014-1744-7. [DOI] [PMC free article] [PubMed] [Google Scholar]
- Zou J., Lathrop K.L., Sun M., Wei X. Intact retinal pigment epithelium maintained by Nok is essential for retinal epithelial polarity and cellular patterning in zebrafish. J. Neurosci. 2008;28:13684–13695. doi: 10.1523/JNEUROSCI.4333-08.2008. [DOI] [PMC free article] [PubMed] [Google Scholar]
Associated Data
This section collects any data citations, data availability statements, or supplementary materials included in this article.