Abstract
Background and Objectives
The central vein sign (CVS), a central linear hypointensity within lesions on T2*-weighted imaging, has been established as a sensitive and specific biomarker for the diagnosis of multiple sclerosis (MS). However, the CVS has not yet been comprehensively studied in newly developing MS lesions. We aimed to identify the CVS profiles of new white matter lesions in patients with MS followed over time and investigate demographic and clinical risk factors associated with new CVS+ or CVS− lesion development.
Methods
In this retrospective longitudinal cohort study, adults from the NIH MS Natural History Study were considered for inclusion. Participants with new T2 or enhancing lesions were identified through review of the radiology report and/or longitudinal subtraction imaging. Each new lesion was evaluated for the CVS. Clinical characteristics were identified through chart review.
Results
A total of 153 adults (95 relapsing-remitting MS, 27 secondary progressive MS, 16 primary progressive MS, 5 clinically isolated syndrome, and 10 healthy; 67% female) were included. Of this cohort, 96 had at least 1 new T2 or contrast-enhancing lesion during median 3.1 years (Q1–Q3: 0.7–6.3) of follow-up; lesions eligible for CVS evaluation were found in 62 (65%). Of 233 new CVS-eligible lesions, 159 (68%) were CVS+, with 30 (48%) individuals having only CVS+, 12 (19%) only CVS−, and 20 (32%) both CVS+ and CVS− lesions. In gadolinium-enhancing (Gd+) lesions, the CVS+ percentage increased from 102/152 (67%) at the first time point where the lesion was observed, to 92/114 (82%) after a median follow-up of 2.8 years. Younger age (OR = 0.5 per 10-year increase, 95% CI = 0.3–0.8) and higher CVS+ percentage at baseline (OR = 1.4 per 10% increase, 95% CI = 1.1–1.9) were associated with increased likelihood of new CVS+ lesion development.
Discussion
In a cohort of adults with MS followed over a median duration of 3 years, most newly developing T2 or enhancing lesions were CVS+ (68%), and nearly half (48%) developed new CVS+ lesions only. Importantly, the effects of edema and T2 signal changes can obscure small veins in Gd+ lesions; therefore, caution and follow-up is necessary when determining their CVS status.
Trial Registration Information
Classification of Evidence
This study provides Class III evidence that younger age and higher CVS+ percentage at baseline are associated with new CVS+ lesion development.
Multiple sclerosis (MS) is a chronic CNS disease, characterized by inflammatory demyelination and neuroaxonal loss.1,2 The clinical diagnosis of MS currently relies on MRI to demonstrate evidence of lesion dissemination in space and time.3,4 MRI is key to the determination of inflammatory disease activity, manifested by an increasing quantity of T2 and/or gadolinium enhancing (Gd+) white matter lesions. An increasing lesion load is associated with worsening disability progression and treatment failure in patients treated with disease-modifying therapy (DMT).5,6
Despite the importance of monitoring lesion load in patients with MS, a variety of etiologies can contribute to the appearance of T2/fluid-attenuated inversion recovery (FLAIR) hyperintense lesions on brain MRI that can mimic MS lesions, such as small vessel disease, migraine, inflammatory vasculopathies, and neuromyelitis optica spectrum disorder.7 Increased prevalence of vascular risk factors in patients with MS has been well established in the literature, along with corresponding increased lesion burden and more advanced brain atrophy compared with healthy controls (HC).8 Similarly, it is not uncommon to observe confounding etiologies of new white matter lesion development, such as migraine or cerebral small vessel disease, in radiologically active patients with MS in clinical practice. Therefore, devising improved methods of differentiating new inflammatory demyelinating MS lesions from lesions due to comorbid small vessel disease or migraine is of high clinical value. Understanding the lesion etiology has important ramifications for determining the need for DMT escalation, as this might be indicated in patients demonstrating breakthrough MS disease activity but not in patients with new non-MS white matter lesion development.
The central vein sign (CVS) is a central linear hypointensity within lesions, visualized on susceptibility-sensitive MRI sequences (such as T2*-weighted scans) and corresponding to the small vein or venule around which the lesion formed.9,10 The CVS has been proposed as a radiologic biomarker and is seen with high frequency in MS lesions,11,12 such that it can effectively differentiate MS from other etiologies associated with nonspecific white matter lesions.13,14 However, whereas the CVS has shown promise in aiding the initial diagnosis of MS based on the evaluation of established lesions, the CVS characteristics of newly appearing T2/FLAIR or Gd+ lesions in MS have not been comprehensively described. In this study, we sought to (1) investigate CVS characteristics of newly developing lesions in MS cases and HCs followed longitudinally; (2) study their relationship with clinical and radiologic measures of disease burden; and (3) describe the frequency of associated DMT changes seen retrospectively in this cohort.
Methods
Standard Protocol Approvals, Registrations, and Patient Consents
Study participants were recruited under the NIH MS Natural History Study (ClinicalTrials.gov number: NCT00001248). The study protocol was approved by the NIH Institutional Review Board, and written informed consent was obtained from all study participants.
Study Population
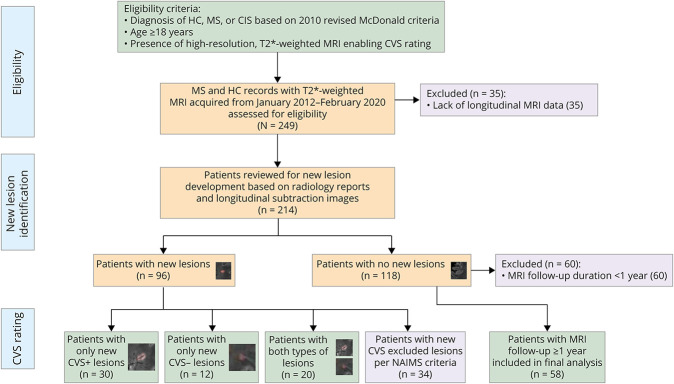
Cases were recruited by unselected convenience sampling from the cohort of patients who underwent clinical and MRI assessments at the NIH Neuroimmunology Clinic between January 1, 2012, and February 20, 2020. MS diagnosis was confirmed by the treating neurologists based on the 2010 revised McDonald criteria.3 Patients who met the following criteria were included in the study: (1) age ≥18 years, (2) clinical diagnosis of relapsing-remitting MS (RRMS), secondary progressive MS (SPMS), primary progressive MS (PPMS), or clinically isolated syndrome (CIS), and (3) underwent longitudinal imaging to determine the presence of new lesions compared with a reference baseline scan. Patients were excluded if they had (1) an unclear diagnosis, for example, possible or probable MS not meeting the 2010 revised McDonald criteria, or (2) lack of dedicated T2*-weighted MRI optimized for CVS assessment. A cohort of HC who had evidence of nonspecific white matter lesions and underwent longitudinal MRI was also included in the study. For cases with no new lesions during follow-up, only those who had follow-up durations greater than 1 year were included in the analysis to allow sufficient observation time to ensure radiologic stability (Figure 1). Medical records were screened to determine demographics, clinical characteristics, medical comorbidities, and DMT changes.
Figure 1. Study Eligibility Criteria and Patient Inclusion Flowchart.
CVS = central vein sign; CIS = clinically isolated syndrome; HC = healthy control; MS = multiple sclerosis; NAIMS = North American Imaging in Multiple Sclerosis Cooperative.
Image Acquisition and Preprocessing
Brain MRI was performed on either Skyra (Siemens Healthineers) or Achieva (Philips Medical Systems) 3T scanners with body transmit and 8- or 32-channel receive head coils. A submillimeter, T2*-weighted, whole brain, 3D segmented-echo-planar imaging sequence was obtained on all study participants (TR, 64 ms; TE, 35 ms; FA, 10°; echo-train length, 15; 0.65-mm isometric voxels for Siemens and 0.55-mm for Philips),9 as well as 3D millimetric T1-weighted magnetization-prepared rapid acquisition of gradient echoes (T1-MPRAGE or T1-MP2RAGE for Siemens and T1-MPRAGE for Philips) and 3D millimetric T2-weighted FLAIR images, as described in detail previously.15,16 T2*-weighted scans were acquired either with or without gadolinium injection (gadobutrol 0.1 mmol/kg), and image gadolinium administration status was extracted from Digital Imaging and Communications in Medicine (DICOM) headers using a custom script implemented using MATLAB, version R2019a (Natick, MA: The MathWorks Inc).
To allow for lesion review and CVS rating at the submillimeter isotropic resolution of the acquired T2*-weighted images, we upsampled the Montreal Neurological Institute (MNI)-152 and International Consortium for Brain Mapping (ICBM) nonlinear symmetric millimetric atlas template (nist.mni.mcgill.ca/?p=904) to the resolution of the T2*-weighted images. Subsequently, the baseline and follow-up T2*-weighted, T1-MP(2)RAGE, and FLAIR images for all included cases were rigidly registered to the upsampled MNI-ICBM brain template at T2*-weighted image resolution. The skull and extracranial tissues were removed using the Multi-cONtrast brain STRipping algorithm17 and corrected for inhomogeneity using the Multiplicative Intrinsic Component Optimization method for bias-field estimation.18 MS lesion segmentation was performed using a deep learning-based method,19 and FLAIR* images, allowing simultaneous visualization of lesions and colocalized veins, were generated by combining the FLAIR and T2*-weighted contrasts as previously described.20
New T2 or Gd+ lesions were identified through 2 separate processes: (1) review of the official MRI radiology report by a single expert neuroradiologist (D.S.R.) or (2) subtraction image processing and review to identify newly forming lesions (new lesions identified by either of these approaches were included).21,22 Briefly, to generate subtraction images for new lesion detection, we first performed Kernel Density Estimation–based normalization of the median value for each individual's entire longitudinal skull-stripped FLAIR image stack. Next, the last FLAIR time point included in the study was used as reference for element-wise subtraction of all prior time points, up to and including the baseline scan. Each new white matter lesion, identified based on radiology report or subtraction imaging, was evaluated for the presence of a central vein by a single trained rater (V.L.), who was blinded to the clinical status of the cases (Figure 2). Newly forming confluent lesions or lesions with multiple or eccentric intralesional veins were excluded from the analysis per the North American Imaging in Multiple Sclerosis Cooperative (NAIMS) criteria.11 Baseline CVS percentages were generated for all cases by 2 trained blinded raters (V.L. and O.A.).
Figure 2. Longitudinal Evolution of Newly Developing CVS+ and CVS− Lesions in Multiple Sclerosis.
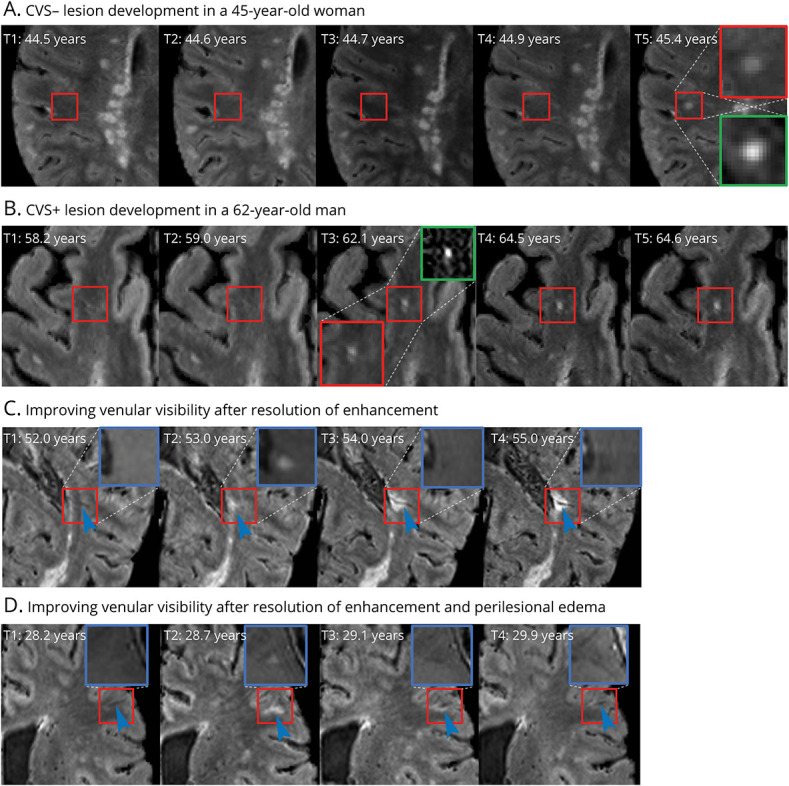
A and B depict examples of new CVS− and CVS+ lesion development, respectively. Red insets show magnified views of the lesion on FLAIR*, in which central veins appear as hypointense dots or lines, and green insets depict magnified views of the lesion on longitudinal subtraction imaging. C and D show examples of gadolinium-enhancing lesions with poor initial venular visibility, despite the vein being present on scans obtained before lesion formation. Venular visibility gradually improves following resolution of enhancement and intra-/perilesional edema (blue arrowheads). Blue insets show magnified views of corresponding postgadolinium T1-weighted images. CVS = central vein sign; FLAIR = fluid-attenuated inversion recovery.
Statistical Methods
Quantile-quantile plots and Shapiro-Wilk tests were used to assess the normality of distributions. Comparisons of non-normally distributed continuous variables were conducted via the Wilcoxon rank-sum test. Normally distributed variables were compared using the 1-way analysis of variance test. Categorical variables were compared via the Pearson χ2 test or Fisher exact test. Multivariable logistic regression was used to model predictors of central vein positive or negative new lesion formation. Models were adjusted for age at baseline MRI, sex, race, T2*-weighted gadolinium status, and follow-up duration. Similarly, multilevel logistic regression models were used to assess the effects of lesion location and size on the likelihood of observing CVS+ lesions, accounting for within-subject correlation across lesions. Statistical significance was set at p < 0.05. All statistical analyses were conducted using R, version 3.6.2, and Stata, version 13 (StataCorp, College Station, TX).
Data Availability
Anonymized data can be made available on reasonable email request to the corresponding author Dr. Omar Al-Louzi; omar.al-louzi@cshs.org or. Requesters will be asked to detail proposed use, and a data sharing agreement will need to be completed.
Results
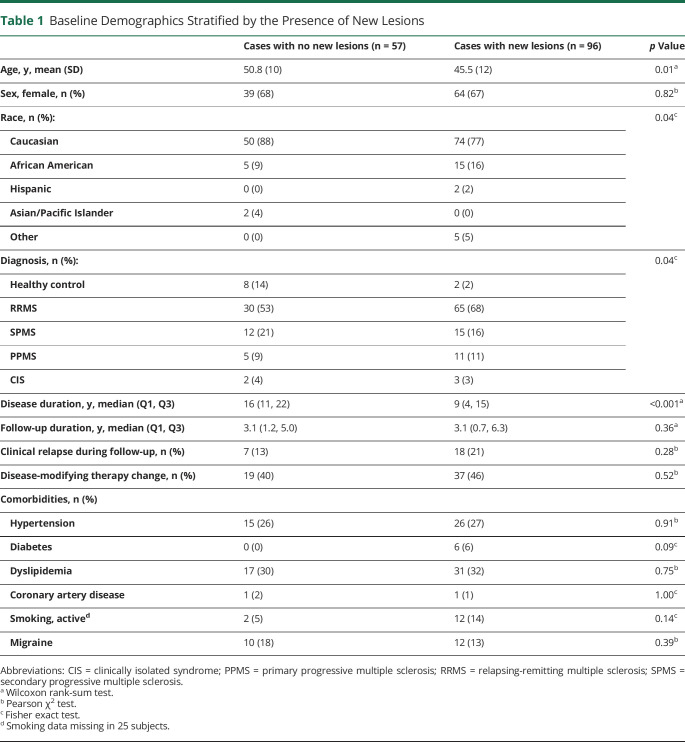
A total of 138 adults with MS (95 RRMS, 27 SPMS, 16 PPMS), 5 CIS, and 10 HCs with longitudinal follow-up allowing the determination of new lesion development were included in this study. Of these, 96 (63%) developed a new lesion over the study period, including 2 HC, both of whom developed new CVS− lesions (Figure 1). For cases with new lesions, 71 (74%) were identified through the radiology report and 25 (26%) through review of the longitudinal subtraction imaging. Not surprisingly, compared with those who were radiologically stable, cases with new lesions were more likely to be younger (mean age 46 vs 51 years, p = 0.01), have RRMS (68% vs 53%, p = 0.03), and have shorter disease duration (median 9 vs 16 years, p < 0.001). Relapse rates, follow-up duration, and vascular comorbidity prevalence were similar between the groups with vs without new lesions (Table 1). T2*-weighted images were acquired following gadolinium administration in 115/227 scans (51%) for cases with no new lesions vs 257/477 (54%) scans for cases who developed new lesions (p = 0.42).
Table 1.
Baseline Demographics Stratified by the Presence of New Lesions
New Lesion CVS Characteristics
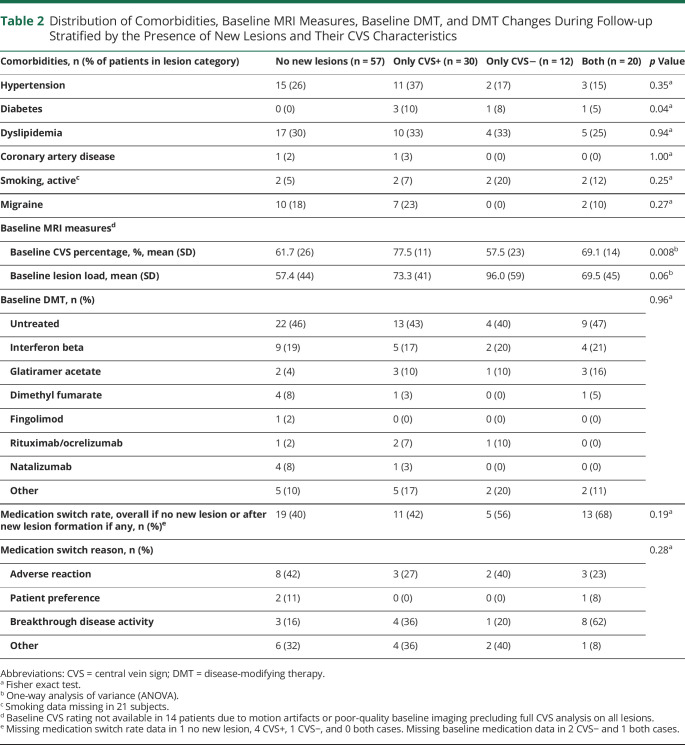
Altogether, 420 new lesions were detected in 96 cases (2 HC, 91 MS, and 3 CIS). Among these, 34 cases (35%) developed only lesions that were excluded per NAIMS criteria, leaving 62 (65%) cases and 233 new lesions eligible for CVS analysis (68% CVS+, 32% CVS−). Most new CVS+ (92/159; 58%) and CVS− (37/74; 50%) lesions were in the subcortical region; however, a lower proportion of new CVS+ lesions were observed in the juxta-/leukocortical region (eTable 1; eFigure 1, Panel A, links.lww.com/NXI/A678). Newly developing CVS+ lesions were more likely to be larger than CVS− lesions (mean volume 59 vs 33 mm3, p < 0.001). In cases with new CVS eligible lesions, 30 developed only CVS+ lesions, 12 developed only CVS− lesions, and 20 developed both types over the follow-up duration (Figure 1). Cases with only new CVS+ lesions had a higher frequency of diabetes (Table 2); however, this was not significant after Bonferroni correction for multiple comparisons, and rates of the remaining vascular comorbidities were similar between the groups (eFigure 1, Panel B).
Table 2.
Distribution of Comorbidities, Baseline MRI Measures, Baseline DMT, and DMT Changes During Follow-up Stratified by the Presence of New Lesions and Their CVS Characteristics
Effect of Gadolinium Enhancement on CVS Characteristics
Of the new lesions eligible for CVS analysis, 152/233 (65%) were Gd+ at the time point at which the lesion was first observed. Of the Gd+ lesions, 102/152 (67%) were CVS+ at the first time point compared with 57/81 (70%) CVS+ status in nonenhancing lesions (p = 0.61). Follow-up imaging was available for 114 (75%) of Gd+ lesions, with a median duration of 2.8 years between the time point at which the lesion was first observed and last available time point (range 0.2–7 years). Gadolinium enhancement had resolved at the last available time point in all lesions examined. The CVS+ percentage of previously Gd+ lesions increased to 82% (92/114) at time points after gadolinium enhancement had resolved, which on visual inspection appeared to be driven in most cases by improvement in the extent of edema and accompanying T2 hyperintense signal changes obscuring small vessels within these lesions (Figures 2, C and D).
Clinical Characteristics in Relation to CVS Status of New Lesions
DMT changes occurred at similar rates between cases who did and did not develop new lesions (Table 1). In individuals with new lesions, DMT changes after new lesion formation only were analyzed. The most frequent reason for DMT change was breakthrough disease activity for the only-CVS+ and CVS+/CVS− groups, as opposed to adverse DMT reactions in the only-CVS− group (Table 2). There was no difference between groups in Expanded Disability Status Scale, walking speed, or upper extremity or cognitive functions (eTable 2, links.lww.com/NXI/A678). Of interest, individuals with only new CVS+ lesions had a higher baseline CVS+ percentage compared with the other groups (Table 2).
Risk Factors for CVS-Stratified New Lesion Formation
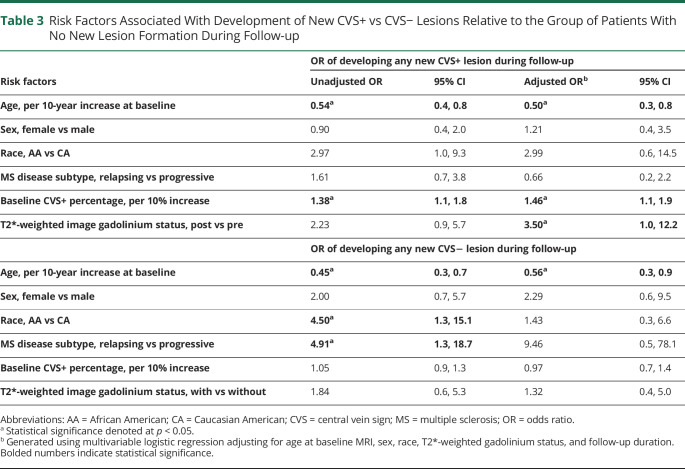
Multivariable logistic regression analyses showed several notable variables associated with modulation of the risk of CVS+ and/or CVS− development over time. The likelihood of CVS+ lesion development increased with younger age (OR = 0.5 per 10-year increase in age, 95% CI = 0.3–0.8) and higher baseline CVS+ percentage (OR = 1.5 per 10% increase in baseline CVS+ percentage, 95% CI = 1.1–1.9), adjusting for sex, race, T2*-weighted gadolinium status, and follow-up duration (Figure 3). Sex, race, and MS disease subtype were not associated with risk of CVS+ lesion development (Table 3). Although there was a relationship between the odds of any new CVS− lesion formation and younger age at study inclusion (OR = 0.4, 95% CI = 0.2–0.8), this association appeared to be driven by the cases who developed both CVS+ and CVS− lesions over time and was not present in a sensitivity analysis of cases who formed new CVS− lesions only (OR = 0.8, 95% CI = 0.4–1.6; eTable 3, links.lww.com/NXI/A678). An increased size of newly developing lesions was associated with a slightly higher likelihood of being CVS+ (OR 1.07 per each 10 mm3 increase in lesion volume, 95% CI 1.0–1.1). In addition, new juxta/leukocortical lesions had a lower OR of CVS+ status compared with subcortical/deep WM or periventricular lesions after adjusting for lesion size (OR = 0.4, 95% CI = 0.2–0.8, eTable 1). No statistically significant differences were observed between pairwise comparisons for other lesion locations.
Figure 3. New CVS+ Lesion Development in Multiple Sclerosis Is Associated With Younger Age and Higher Baseline CVS Percentage.
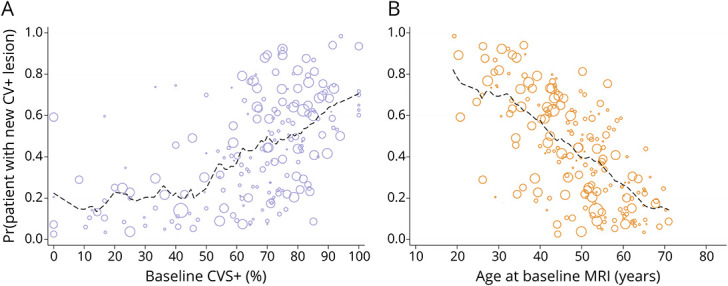
Relationship between fitted probabilities of new CVS+ lesion development generated using multivariate logistic regression, adjusted for age, sex, race, T2*-weighted image gadolinium status, follow-up duration, and baseline CVS+ percentage (A), as well as age at baseline MRI (B). The dimension of each circle is proportional to the duration of MRI follow-up in years. Dashed lines depict a moving average of the probabilities across a span of 10% (A) or 10 years (B). CVS = central vein sign.
Table 3.
Risk Factors Associated With Development of New CVS+ vs CVS− Lesions Relative to the Group of Patients With No New Lesion Formation During Follow-up
Classification of Evidence
The primary objectives of this study were to study the CVS characteristics of newly developing MS lesions and examine their relationship with clinical and radiologic measures of disease activity. This study provides Class III evidence that younger age and higher CVS+ percentage at baseline are associated with new CVS+ lesion development.
Discussion
We characterized the CVS profile of new T2 and/or gadolinium-enhancing lesions in adults followed longitudinally in a single-center natural history study of MS. As expected, individuals who developed new lesions were younger and more likely to have RRMS. Furthermore, new lesions were more frequent in African Americans, consistent with prior reports describing a more active MS disease course in this cohort.23,24 Of the new lesions that were eligible for CVS analysis, 68% were CVS+, which is in line with the overall rates of cross-sectional baseline CVS+ percentage previously described in MS, illustrating how these percentages evolve from the accumulation of new, primarily CVS+, lesions over time.10,12 In contrast, neurologically normal HC with nonspecific T2/FLAIR hyperintensities on baseline MRI were less likely to form new lesions over time compared to MS cases; in the 2 HC who formed new lesions, both lesions were CVS−, consistent with their lower baseline CVS+ percentage.
The CVS has been proposed as a sensitive and specific radiologic biomarker for the diagnosis of MS. Previous cross-sectional studies have described thresholds based on the percentage of CVS+ lesions obtained cross-sectionally, such as the 40% rule, as a highly sensitive and specific biomarker for the diagnosis of MS.10,25,26 Our results build on this by showing that a higher baseline CVS+ percentage is indeed predictive of the risk of developing new CVS+ lesions over time at the cohort level. This finding suggests the presence of patient-level factors associated with a higher propensity for formation of perivenular lesions over time or perhaps prominent overall venular conspicuity. A corollary is that in patients with a high CVS+ percentage, the development of a new CVS− lesion should be considered as an outlier event and a flag to investigate potential coexistence of other etiologies associated with T2/FLAIR hyperintense lesion development. This is particularly important if a change in DMT is being considered based on radiologic disease breakthrough. In fact, our results show that whereas DMT switches after new lesion formation did not differ between the groups with vs without new lesions, the most common reason cited for DMT change in individuals with only CVS+ and both types of lesions was breakthrough disease activity. This contrasts with the group with no new lesions, in which adverse reactions were more commonly listed (Table 2). Although DMT switch rates in this study were determined retrospectively and thus clinicians were unaware of the CVS status of new lesions at the time of DMT switch, this analysis provides an interesting opportunity for future prospective studies to investigate the impact of DMT change or escalation on the likelihood of new CVS+ or CVS− lesion formation longitudinally in patients with active MS.
Previous studies have shed light on the association between cardiovascular risk factors and increased lesion burden in MS.8 Although a clear pathogenic process has not been identified, recent studies have suggested that vascular risk factors worsen MS disease severity, possibly due to their proinflammatory effects.27 Furthermore, vascular risk factors are also associated with a higher risk of cerebral small vessel disease, which in turn could increase the risk of developing predominantly CVS− T2/FLAIR hyperintensities on MRI.28 Recently, a cross-sectional retrospective analysis noted that older age, hypertension, smoking, diabetes, and obesity were associated cross-sectionally with a lower percentage of CVS+ lesions in MS.29 Extending on this prior work, increasing age in this study was associated with a lower likelihood of developing new CVS+ lesions longitudinally. There were no associations between other vascular risk factors and risk of new CVS+ or CVS− lesion development, except for diabetes being more frequent in those with only new CVS+ lesions, but this effect lost significance after adjustment for multiple comparisons. Of interest, newly developing juxta/leukocortical lesions in this study had a lower OR of CVS+ compared with subcortical or periventricular lesions, which is in line with previous studies demonstrating a lower CVS percentage within juxtacortical lesions vs periventricular and deep white matter lesions cross-sectionally.30 Whether this result has a radiological (poorer visibility of juxtacortical veins) or biological (different mechanism of lesion formation) explanation is uncertain, but we favor the former possibility.
When examining newly developing lesions in MS, analysis is effectively restricted to a small subset of lesions present in a proportion of radiologically active patients31,32; therefore, it is plausible that our study was not sufficiently powered to detect the influence of vascular risk factors longitudinally. Another interesting possibility is that a minority of newly forming lesions in MS (including in patients with no overt vascular risk factors) are truly nonperivenular and that this phenomenon is more common in those with a relatively lower baseline CVS+ percentage. Given that the pathophysiology of focal white matter inflammatory demyelination in MS is thought to be perivenular, such a finding, if confirmed, should prompt detailed analysis of the process by which those lesions form, as done previously for perivenular lesions.33 Alternatively, current MRI techniques may be imperfectly sensitive to the CVS, particularly in the setting of new lesion formation; possible reasons could include intralesional edema reducing the apparent size of intralesional veins34 or gadolinium itself interfering with vein detection. Indeed, in this cohort, the venular visibility within Gd+ lesions was proportionately lower compared with nonenhancing lesions. Importantly, when the same lesions were examined at later time points following the resolution of enhancement and/or intra-/perilesional edema, a higher proportion of central veins was observed, indicating the need for caution and follow-up when attributing development of a Gd-enhancing or very recent CVS− lesion to a cause other than MS.
Despite the strengths of our study, it is not without limitations. Most participants in our study had RRMS, and our study was therefore underpowered to study the characteristics of newly developing lesions in progressive MS. In addition, as mentioned above, our results investigating the influence of vascular risk factors on newly developing lesions were limited by the small number of cases with newly developing lesions who had comorbid vascular disease. This highlights the need for larger, multicenter studies with longer durations of follow-up to fully interrogate the longitudinal effects of vascular risk factors on new lesion development in MS stratified by CVS status.
In summary, our study describes the characteristics of newly developing lesions in MS along with associated risk factors. Patients who developed new lesions were more likely to be younger and have a RRMS diagnosis with shorter disease duration. Furthermore, we identified a link between baseline CVS+ percentage and the likelihood of development of new CVS+ lesions over time, suggesting that patients tend to develop lesions longitudinally that match their overall baseline CVS proportion. These results underscore the need for prospective studies examining the influence of DMT changes on the likelihood of new lesion development stratified by CVS characteristics and the impact of vascular risk factors. Ultimately, this will inform and lay the groundwork for the implementation of the CVS as a radiologic biomarker in the evaluation of patients with breakthrough MS disease activity and underscores its potential in guiding clinical practice.
Acknowledgment
The authors thank all the research volunteers who made this study possible and all those who helped perform this project. They specifically acknowledge the contributions of Frances Andrada and Jennifer Dwyer from the NINDS Neuroimmunology Clinic to the recruitment, care, and collection of clinical data from the study participants. They also thank Dr. John Ostuni and the NINDS information technology department for help with servers and software maintenance and the staff of the Functional Magnetic Resonance Facility (FMRIF) and radiology department technicians who acquired MRI data. This study used the computational resources of the Biowulf system at the NIH, Bethesda, MD (https://hpc.nih.gov/).
Glossary
- CIS
clinically isolated syndrome
- CVS
central vein sign
- DMT
disease-modifying therapy
- FLAIR
fluid-attenuated inversion recovery
- Gd+
gadolinium enhancing
- HC
healthy control
- ICBM
International Consortium for Brain Mapping
- MNI
Montreal Neurologic Institute
- MS
multiple sclerosis
- NAIMS
North American Imaging in Multiple Sclerosis
- PPMS
primary progressive MS
- RRMS
relapsing-remitting MS
- SPMS
secondary progressive MS
Appendix. Authors
Footnotes
Class of Evidence: NPub.org/coe
Contributor Information
Omar Al-Louzi, Email: oallouzi1@gmail.com.
Vijay Letchuman, Email: vijay.letchuman@nih.gov.
Sargis Manukyan, Email: sargis.manukyan@nih.gov.
Erin S. Beck, Email: erin.beck@nih.gov.
Snehashis Roy, Email: snehashis.roy@gmail.com.
Joan Ohayon, Email: ohayonj@ninds.nih.gov.
Dzung L. Pham, Email: dzung.pham@nih.gov.
Irene Cortese, Email: corteseir@ninds.nih.gov.
Pascal Sati, Email: pascal.sati@cshs.org.
Study Funding
This work was supported by the Intramural Research Program of the NINDS/NIH, National Multiple Sclerosis Society (NMSS)-American Brain Foundation Clinician Scientist Development Award (FAN-1807-32163) to O. Al-Louzi and NMSS grant (RG-1907-34570) to D.L. Pham. V. Letchuman was supported by the Foundation of the Consortium of Multiple Sclerosis Centers and the NIH Medical Research Scholars Program (a public-private partnership supported jointly by the NIH and contributions to the Foundation for the NIH from the Doris Duke Charitable Foundation, Genentech, the American Association for Dental Research, and the Colgate-Palmolive Company). E.S. Beck is supported by a National Multiple Sclerosis Society Career Transition Fellowship (TA-1805-31038).
Disclosure
O. Al-Louzi, V. Letchuman, S. Manukyan, E.S. Beck, S. Roy, J. Ohayon, D.L. Pham, I. Cortese, and P. Sati have no disclosures pertaining to the work presented. D.S. Reich received research funding from Vertex Pharmaceuticals and Sanofi-Genzyme, unrelated to the current project. Go to Neurology.org/NN for full disclosures.
References
- 1.Reich DS, Lucchinetti CF, Calabresi PA. Multiple sclerosis. N Engl J Med. 2018;378(2):169-180. [DOI] [PMC free article] [PubMed] [Google Scholar]
- 2.Thompson AJ, Baranzini SE, Geurts J, Hemmer B, Ciccarelli O. Multiple sclerosis. Lancet. 2018;391(10130):1622-1636. [DOI] [PubMed] [Google Scholar]
- 3.Polman CH, Reingold SC, Banwell B, et al. Diagnostic criteria for multiple sclerosis: 2010 revisions to the McDonald criteria. Ann Neurol. 2011;69(2):292-302. [DOI] [PMC free article] [PubMed] [Google Scholar]
- 4.Thompson AJ, Banwell BL, Barkhof F, et al. Diagnosis of multiple sclerosis: 2017 revisions of the McDonald criteria. Lancet Neurol. 2018;17(2):162-173. [DOI] [PubMed] [Google Scholar]
- 5.Li DK, Held U, Petkau J, et al. MRI T2 lesion burden in multiple sclerosis: a plateauing relationship with clinical disability. Neurology. 2006;66(9):1384-1389. [DOI] [PubMed] [Google Scholar]
- 6.Sormani MP, Bruzzi P. MRI lesions as a surrogate for relapses in multiple sclerosis: a meta-analysis of randomised trials. Lancet Neurol. 2013;12(7):669-676. [DOI] [PubMed] [Google Scholar]
- 7.Calabrese M, Gasperini C, Tortorella C, et al. “Better explanations” in multiple sclerosis diagnostic workup: a 3-year longitudinal study. Neurology. 2019;92(22):E2527-E2537. [DOI] [PMC free article] [PubMed] [Google Scholar]
- 8.Kappus N, Weinstock-Guttman B, Hagemeier J, et al. Cardiovascular risk factors are associated with increased lesion burden and brain atrophy in multiple sclerosis. J Neurol Neurosurg Psychiatry. 2016;87(2):181-187. [DOI] [PubMed] [Google Scholar]
- 9.Sati P, Thomasson DM, Li N, et al. Rapid, high-resolution, whole-brain, susceptibility-based MRI of multiple sclerosis. Mult Scler. 2014;20(11):1464-1470. [DOI] [PMC free article] [PubMed] [Google Scholar]
- 10.Tallantyre EC, Dixon JE, Donaldson I, et al. Ultra-high-field imaging distinguishes MS lesions from asymptomatic white matter lesions. Neurology. 2011;76(6):534-539. [DOI] [PMC free article] [PubMed] [Google Scholar]
- 11.Sati P, Oh J, Constable RT, et al. The central vein sign and its clinical evaluation for the diagnosis of multiple sclerosis: a consensus statement from the North American Imaging in Multiple Sclerosis Cooperative. Nat Rev Neurol. 2016;12(12):714-722. [DOI] [PubMed] [Google Scholar]
- 12.Bhandari A, Xiang H, Lechner-Scott J, Agzarian M. Central vein sign for multiple sclerosis: a systematic review and meta-analysis. Clin Radiol. 2020;75(6):479-e15. [DOI] [PubMed] [Google Scholar]
- 13.Suh CH, Kim SJ, Jung SC, Choi CG, Kim HS. The “central vein sign” on T2*-weighted images as a diagnostic tool in multiple sclerosis: a systematic review and meta-analysis using individual patient data. Sci Rep. 2019;9(1):18188. [DOI] [PMC free article] [PubMed] [Google Scholar]
- 14.Castellaro M, Tamanti A, Pisani AI, Pizzini FB, Crescenzo F, Calabrese M. The use of the central vein sign in the diagnosis of multiple sclerosis: a systematic review and meta-analysis. Diagnostics (Basel). 2020;10(12):1025. [DOI] [PMC free article] [PubMed] [Google Scholar]
- 15.Absinta M, Sati P, Masuzzo F, et al. Association of chronic active multiple sclerosis lesions with disability in vivo. JAMA Neurol. 2019;76(12):1474-1483. [DOI] [PMC free article] [PubMed] [Google Scholar]
- 16.Absinta M, Vuolo L, Rao A, et al. Gadolinium-based MRI characterization of leptomeningeal inflammation in multiple sclerosis. Neurology. 2015;85(1):18-28. [DOI] [PMC free article] [PubMed] [Google Scholar]
- 17.Roy S, Butman JA, Pham DL. Robust skull stripping using multiple MR image contrasts insensitive to pathology. Neuroimage. 2017;146:132-147. [DOI] [PMC free article] [PubMed] [Google Scholar]
- 18.Li C, Gore JC, Davatzikos C. Multiplicative intrinsic component optimization (MICO) for MRI bias field estimation and tissue segmentation. Magn Reson Imaging. 2014;32(7):913-923. [DOI] [PMC free article] [PubMed] [Google Scholar]
- 19.Roy S, Butman JA, Reich DS, Calabresi PA, Pham DL. Multiple sclerosis lesion segmentation from brain MRI via fully convolutional neural networks. 2018. arxiv.org/abs/1803. Accessed March 16, 2020.
- 20.Sati P, George IC, Shea CD, Gaitán MI, Reich DS. FLAIR*: a combined MR contrast technique for visualizing white matter lesions and parenchymal veins. Radiology. 2012;265(3):926-932. [DOI] [PMC free article] [PubMed] [Google Scholar]
- 21.Moraal B, Meier DS, Poppe PA, et al. Subtraction MR images in a multiple sclerosis multicenter clinical trail setting. Radiology. 2009;250(2):506-514. [DOI] [PMC free article] [PubMed] [Google Scholar]
- 22.Olson J, Pham DL, Reich DS, Butman JA. Making a Difference, an Integrated PACS Workflow for Evaluating Longitudinal Changes across Serial Imaging, Vol 11601. SPIE-Intl Soc Optical Eng; 2021:24. doi: 10.1117/12.2582209. [DOI] [Google Scholar]
- 23.Caldito NG, Saidha S, Sotirchos ES, et al. Brain and retinal atrophy in African-Americans versus Caucasian-Americans with multiple sclerosis: a longitudinal study. Brain. 2018;141(11):3115-3129. [DOI] [PMC free article] [PubMed] [Google Scholar]
- 24.Giovannoni G. Disease-modifying treatments for early and advanced multiple sclerosis: a new treatment paradigm. Curr Opin Neurol. 2018;31(3):233-243. [DOI] [PubMed] [Google Scholar]
- 25.Mistry N, Dixon J, Tallantyre E, et al. Central veins in brain lesions visualized with high-field magnetic resonance imaging: a pathologically specific diagnostic biomarker for inflammatory demyelination in the brain. JAMA Neurol. 2013;70(5):623-628. [DOI] [PubMed] [Google Scholar]
- 26.Maggi P, Absinta M, Sati P, et al. The “central vein sign” in patients with diagnostic “red flags” for multiple sclerosis: a prospective multicenter 3T study. Mult Scler J. 2020;26(4):421-432. [DOI] [PMC free article] [PubMed] [Google Scholar]
- 27.Geraldes R, Juryńczyk M, dos Passos G, et al. Distinct influence of different vascular risk factors on white matter brain lesions in multiple sclerosis. J Neurol Neurosurg Psychiatry. 2020;91(4):388-391. [DOI] [PubMed] [Google Scholar]
- 28.Mistry N, Abdel-Fahim R, Samaraweera A, et al. Imaging central veins in brain lesions with 3-T T2∗-weighted magnetic resonance imaging differentiates multiple sclerosis from microangiopathic brain lesions. Mult Scler. 2016;22(10):1289-1296. [DOI] [PubMed] [Google Scholar]
- 29.Guisset F, Lolli V, Bugli C, et al. The central vein sign in multiple sclerosis patients with vascular comorbidities. Mult Scler 2021:27(7):1057-1065. [DOI] [PubMed] [Google Scholar]
- 30.Kilsdonk ID, Lopez-Soriano A, Kuijer JPA, et al. Morphological features of MS lesions on FLAIR* at 7 T and their relation to patient characteristics. J Neurol. 2014;261(7):1356-1364. [DOI] [PubMed] [Google Scholar]
- 31.Erdélyi-Bõtor S, Aradi M, Kamson DO, et al. Changes of migraine-related white matter hyperintensities after 3 years: a longitudinal MRI study. Headache. 2015;55(1):55-70. [DOI] [PubMed] [Google Scholar]
- 32.Van Dijk EJ, Prins ND, Vrooman HA, Hofman A, Koudstaal PJ, Breteler MMB. Progression of cerebral small vessel disease in relation to risk factors and cognitive consequences: Rotterdam scan study. Stroke. 2008;39(10):2712-2719. [DOI] [PubMed] [Google Scholar]
- 33.Gaitán MI, Shea CD, Evangelou IE, et al. Evolution of the blood-brain barrier in newly forming multiple sclerosis lesions. Ann Neurol. 2011;70(1):22-29. [DOI] [PMC free article] [PubMed] [Google Scholar]
- 34.Gaitán MI, De Alwis MP, Sati P, Nair G, Reich DS. Multiple sclerosis shrinks intralesional, and enlarges extralesional, brain parenchymal veins. Neurology. 2013;80(2):145-151. [DOI] [PMC free article] [PubMed] [Google Scholar]
Associated Data
This section collects any data citations, data availability statements, or supplementary materials included in this article.
Data Availability Statement
Anonymized data can be made available on reasonable email request to the corresponding author Dr. Omar Al-Louzi; omar.al-louzi@cshs.org or. Requesters will be asked to detail proposed use, and a data sharing agreement will need to be completed.


