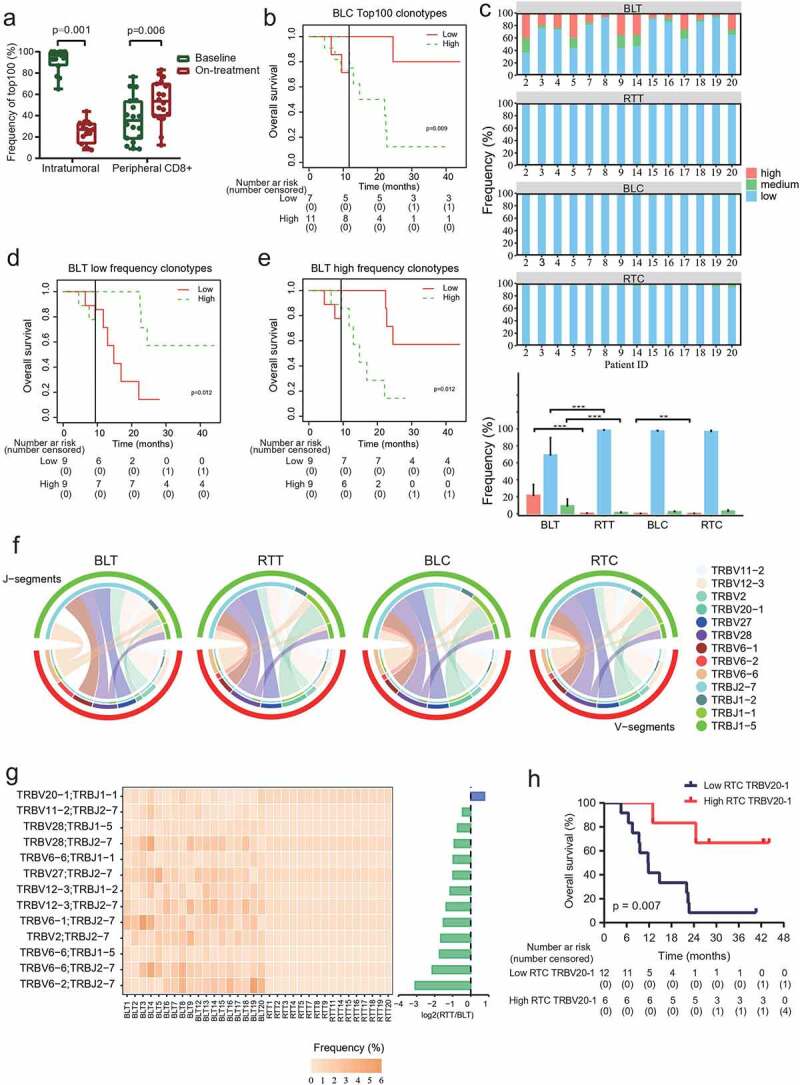
Figure 5.

Clonotype redistribution during combination treatment.
(a) Total frequencies of top 100 clonotypes in tumors or peripheral CD8+ T cells before and during treatment. N = 15 paired tumor tissues, and 18 paired peripheral CD8+ T cells. (b) Landmark analysis of overall survival among patients in frequencies of top 100 clones in baseline peripheral CD8+ T cell. (c) Different frequencies of clonotypes during treatment. The upper four graphics showed the proportions of high-frequency, medium-frequency, and low-frequency clonotypes in tumors or peripheral CD8+ T cells from each patient before and during treatment. Low-frequency clones, ≤0.01%. Medium-frequency clones, 0.01% to 0.1%. High-frequency clones, ≥0.1%. N = 14. (d and e) Landmark analysis of overall survival among patients in low-frequency clonotypes (d) and high-frequency clonotypes (e) in baseline tumors. (f) Variable-Joining (V/J) gene utilization profiles of TCRβ (TRB) in tumors or peripheral CD8+ T cells before and during treatment. V-J pairs identified in all tumors and peripheral CD8+ T cell samples were included in the analysis. BLT, BLC and RTC, N = 18 each. RTT, N = 16. (g) Frequencies of V/J gene profiles of TRB in tumors from each patient before and during treatment. V-J pairs identified in all tumors were included in the analysis. (h) Kaplan–Meier estimates of overall survival among patients with TRBV20-1 in the peripheral CD8+ T cells during treatment. BLT and BLC, baseline tumor tissues and peripheral CD8+ T cells. RTT and RTC, tumor tissues and peripheral CD8+ T cells after 40 Gy radiation and 2 rounds of camrelizumab. P < .05, significant difference.
