

Abstract
Sorghum bicolor, a photosynthetically efficient C4 grass, represents an important source of grain, forage, fermentable sugars, and cellulosic fibers that can be utilized in myriad applications ranging from bioenergy to bioindustrial feedstocks. Sorghum’s efficient fixation of carbon per unit time per unit area per unit input has led to its classification as a preferred biomass crop highlighted by its designation as an advanced biofuel by the U.S. Department of Energy. Due to its extensive genetic diversity and worldwide colonization, sorghum has considerable diversity for a range of phenotypes influencing productivity, composition, and sink/source dynamics. To dissect the genetic basis of these key traits, we present a sorghum carbon-partitioning nested association mapping (NAM) population generated by crossing 11 diverse founder lines with Grassl as the single recurrent female. By exploiting existing variation among cellulosic, forage, sweet, and grain sorghum carbon partitioning regimes, the sorghum carbon-partitioning NAM population will allow the identification of important biomass-associated traits, elucidate the genetic architecture underlying carbon partitioning and improve our understanding of the genetic determinants affecting unique phenotypes within Poaceae. We contrast this NAM population with an existing grain population generated using Tx430 as the recurrent female. Genotypic data are assessed for quality by examining variant density, nucleotide diversity, linkage decay, and are validated using pericarp and testa phenotypes to map known genes affecting these phenotypes. We release the 11-family NAM population along with corresponding genomic data for use in genetic, genomic, and agronomic studies with a focus on carbon-partitioning regimes.
Keywords: nested association mapping, pericarp color, genome-wide association study, genotype-by-sequencing, carbon-partitioning, multiparental populations, MPP
Introduction
Current plant resources leveraged for rapid carbon accumulation often target C4 grasses due to their highly efficient photosynthetic pathways that effectively assimilate carbon (Carpita and McCann 2008). The C4 photosynthetic pathway is more efficient at using light, water, and nutrient resources for assimilating CO2 than the C3 photosynthetic pathway (Sage and Monson 1998). This is a result of biochemical and anatomical modifications that allow CO2 to be concentrated in bundle sheath cells of the leaf, supporting greater rates of carboxylation and lower rates of oxygenation by RuBisCO (Sage and Monson 1998; Edwards et al. 2010; Ermakova et al. 2020). Plants exhibiting C4 photosynthesis account for approximately 25% of terrestrial photosynthesis but compose only about 3% of all vascular plants (Edwards et al. 2010). With grasses composing approximately 60% of C4 species and capable of rapidly accumulating significant biomass, they are prime candidates for maximizing carbon acquisition and biomass allocation (Edwards et al. 2010; Olson et al. 2012).
Grass species with C4 photosynthesis such as maize (Zea mays L.), pearl millet [Pennisetum glaucum (L.) R. Br.], sorghum [Sorghum bicolor (L.) Moench], sugarcane (Saccharum officinarum L.), and switchgrass (Panicum virgatum L.) are among the most prominent grasses utilized in bioenergy production due to their high yields, water-use efficiency, and leaf-level nitrogen-use efficiency (Rooney et al. 2007; Byrt et al. 2011). C4 plants can achieve a higher leaf area production rate at lower leaf nitrogen levels, less fertilizer may also be used, thereby reducing nitrous oxide emissions—a major constituent of global greenhouse gases (Sage and Zhu 2011). Similarly, grasses provide the vast majority of direct and indirect calories for people worldwide (Pingali 2015), and scientists have historically targeted the mechanisms of domestication (Doebley et al. 2006), inflorescence improvement (Krizek and Fletcher 2005), and increased yield (Wallace et al. 2018), which are all entirely or partly tied to the plant’s reproductive capacity (Huang et al. 2016; Nadolska-Orczyk et al. 2017; Hunt et al. 2018; Juliana et al. 2019). However, this hyper-intense focus on plant reproductive architecture and higher harvest index in the 20th century may have precluded a more holistic understanding of sink/source dynamics and compositional components (MacNeill et al. 2017).
Sorghum offers excellent water-use efficiency (Enciso et al. 2015), nitrogen-use efficiency (Gardner et al. 1994), genomic simplicity (Paterson et al. 2009; Goodstein et al. 2012), phenotypic diversity (Calviño and Messing 2012), has established genomic tools and resources (Brenton et al. 2016; McCormick et al. 2018; Boyles et al. 2019; Mace et al. 2019), and sorghum can serve as a dual-purpose crop (van der Weijde et al. 2013). The original domestication of sorghum in the Sahel region of sub-Saharan Africa—and potentially additional domestication events (Paterson et al. 1997)—combined with its subsequent worldwide distribution across both latitudinal and longitudinal gradients have created immense genetic and phenotypic diversity which various cultures and communities have continued to propagate, select, and utilize for both profit and livelihood (Morris et al. 2013a; Lasky et al. 2015; Smith et al. 2019). This selection process has resulted in the diversification of sorghum into five botanical races (bicolor, caudatum, durra, guinea, and kafir) based on a combination of panicle architecture and seed characteristics as well as the definition of multiple types based on final process utilization (Klein et al. 2015). The different types may be classified based on variations in carbohydrate—i.e., carbon—partitioning regimes, and these types include:
cellulosic sorghum (carbon primarily partitioned to the stem)—originally bred in the 1920s (Vinall et al. 1936), again in the 1970s (Lipinsky and Kresovich 1980), and most recently in the 2010s—is mainly produced for cellulosic fibers that can be incorporated into bioenergy and bioindustrial processes (Rooney et al. 2007)
forage sorghum (leaves), which is utilized in forage or silage systems for ruminant agricultural production (Bhattarai et al. 2019)
grain (starch) sorghum is the most prevalent among the sorghum types and used for feed and food (Boyles et al. 2016; Sapkota et al. 2020), but may also be used in ethanol production through the conversion of starch stored in the grain (Wu et al. 2010)
sweet (nonstructural sugars) sorghum is selected and bred for the extraction of simplified sugars (i.e., sucrose, fructose, and glucose) in the stem (Murray et al. 2009; Brenton et al. 2020)
While differences in carbon partitioning, translocation, and storage are also common among the other grasses, the mechanisms mediating these differences on a broad scale are unclear (Vogel 2008; MacNeill et al. 2017; Hartmann et al. 2020).
In contrast to the varying ploidy levels in sugarcane (2n = 20 to 200), sorghum is a diploid species (2n = 20) with an approximately 730 Mb genome making it a simpler model for genomic research, and in contrast to maize, sweet sorghum can both yield high biomass and has been intensively bred to accumulate fermentable sugars—primarily sucrose—in their stems (Calviño and Messing 2012). Both corn and sugarcane are also very energy and water intensive, whereas sorghum’s high water-use efficiency allows it to be grown on marginal or nonarable land (Ali et al. 2008). The accumulation of fermentable sugars in sweet sorghum is beneficial since ethanol produced from cellulose has a higher production cost compared to ethanol produced from fermentable sugars (Calviño and Messing 2012). Sweet and cellulosic sorghums demonstrate a significant range in compositional traits and are amendable to significant modifications in carbon partitioning between structural and nonstructural carbohydrate composition (Zhao et al. 2009; Mullet et al. 2014; Brenton et al. 2016).
Nested association mapping (NAM) populations are a type of multiparent population generated by crossing several diverse founders with one recurrent parent (Buckler et al. 2009; Ladejobi et al. 2016). Because the chance of recombination is lower over short genetic distances and a specific number of generations, the genomes of the resulting recombinant inbred-lines (RILs) contain chromosomal segments that are a mixture of their parental genomes (Stich 2009). In contrast to diversity panels, NAM populations require a fewer number of SNPs for whole-genome scans, have higher statistical power, are less sensitive to genetic heterogeneity, and use marker information more efficiently while maintaining high-allele richness (Yu and Buckler 2006). As such, NAM populations have been used in a variety of plant systems including maize (Yu et al. 2008; McMullen et al. 2009), barley (Maurer et al. 2015), wheat (Bajgain et al. 2016), rice (Fragoso et al. 2017), Brassica napus (Hu et al. 2018), and sorghum (Marla et al. 2019).
The development of the Sorghum Carbon-Partitioning NAM (CP-NAM) population involved the collection of phenotypically and genetically diverse accessions from the Sorghum Bioenergy Association Panel (BAP) (Brenton et al. 2016; Flinn et al. 2020) such that all five of the major botanical races are represented as well as the four major types. Several of these accessions are also photoperiod sensitive. Photoperiod sensitivity is well-documented in sorghum (Quinby 1967; Major et al. 1990; Rooney and Aydin 1999) and is known to be regulated by at least six maturity genes, Ma1–Ma6 (Rooney and Aydin 1999). Photoperiod sensitive sorghum do not transition to reproductive growth until day lengths fall below approximately 12 h 20 min, allowing for the increased accumulation of structural and nonstructural carbohydrates (Rooney and Aydin 1999). As such, these accessions represent extremes in their ability to accumulate and partition carbon.
The recurrent parent, Grassl, was selected due to its ability to accumulate substantial biomass and fermentable carbohydrates per unit time and area (Kresovich et al. 1988). Grassl is also highly resistant to Peronosclerospora sorghi and Puccinia purpurea, resistant to Sporisorium [Sphacelotheca] reiliana and tolerant to the maize dwarf mosaic virus (Kresovich et al. 1988). The construction of this NAM complements the existing sorghum resources and the ongoing reference genome assemblies, pan-genomics projects, and database development which should increase the utility and accessibility for researchers worldwide (Boyles et al. 2019). The incorporation of photoperiod sensitive, nontemperately adapted material provides germplasm that is not confounded by the prevalence of dwarfing and photoperiod insensitive alleles (Wang et al. 2020). Here, we perform a quality assessment of the CP-NAM as a genomic resource and validate the population for use in genomic studies using pericarp and testa phenotypes as positive controls to map known genes affecting these phenotypes.
Materials and methods
Plant materials and phenotyping
The CP-NAM parents were grown in Florence, South Carolina, at the Clemson University Pee Dee Research and Education Center in 2013 and 2014 with two complete randomized blocks planted each year as a part of work done by Brenton et al. (2016). As mature plant height exceeded irrigation pivot height in many accessions, irrigation was halted approximately 90 days after planting. Seed treatment was performed as described in Brenton et al. (2016). The selected traits included anthesis date, stalk weight, leaf weight, panicle weight, juice weight, brix, wet weight, dry weight, total weight, plant height, acid detergent fiber, neutral detergent fiber, nonfibrous carbohydrates, lignin, and water-soluble carbohydrates (Table 2 and Supplementary Table S1) (Brenton et al. 2016). Plant height was measured at physiological maturity or harvest from the stalk base to either the panicle apex or the shoot apical meristem apex in the event a panicle did not develop. Samples were dried at 40 °C to a constant weight before measuring dry weight. Compositional data were generated from dried samples using a Perten DA7250 near-infrared spectroscopy (NIR) instrument (https://www.perten.com) as described in Brenton et al. (2016). The CP-NAM parent PI329311 is not represented in the agronomic data due to an inability to acquire sufficient germplasm.
Table 2.
CP-NAM parent agronomic and physiological traits
| Accessiona | Days to Harvest | Stalk weight (kg) | Leaf weight (kg) | Panicle weight (kg)b | Brix | WSC (%DM) |
|---|---|---|---|---|---|---|
| PI154844 | 163.25 5.19 | 2.57 1.01 | 0.39 0.15 | 0.14 0.07 | 12.95 1.67 | − |
| PI22913 | 122.67 2.31 | 1.31 0.4 | 0.17 0.04 | 0.14 0.03 | 13.9 0.95 | 27.4 |
| PI229841 | 136 18.97 | 1.05 0.26 | 0.19 0.07 | 0.24 0.06 | 10.35 3.41 | 16.48 3.33 |
| PI297130 | 158.5 4.95 | 2.59 | 0.43 0.1 | − | 11.8 0.99 | 24.92 1.8 |
| PI297155 | 114 7.66 | 0.56 0.08 | 0.16 0.08 | 0.14 0.06 | 6.33 1.55 | − |
| PI506069 | 159 7.07 | 2.13 | 0.44 0.11 | − | 7.9 0.28 | 10.03 5.3 |
| PI508366 | 156 | 2.38 | 0.4 0.1 | − | 6.35 0.07 | 12.1 3.61 |
| PI510757 | 157 2.83 | 2.56 | 0.55 0.01 | − | 7.15 2.9 | 25.91 1.55 |
| PI563295 | 138.25 14.34 | 1.87 0.6 | 0.24 0.07 | 0.16 0.08 | 14.38 3.55 | 31.84 9.51 |
| PI586454 | 114.25 8.42 | 1.18 0.31 | 0.2 0.05 | 0.12 0.04 | 11.73 1.86 | − |
| PI655972 | 110.5 3.7 | 0.49 0.03 | 0.14 0.04 | 0.13 0.07 | 8.78 2.35 | 9.5 2.32 |
Cells contain the mean the standard deviation for each trait where replicate data were available. Single-replicate data do not contain standard deviations, and missing data are represent by “−.”
PI329311 did not have adequate germplasm for inclusion.
Photoperiod sensitive lines did not produce panicles.
A total of 11 RIL families were generated using diverse sorghum lines and female Grassl (Table 1), which resulted in approximately 200–274 individuals for each RIL family between diverse sorghum lines including bicolor, caudatum, durra, guinea, kafir, kafir-bicolor, and female Grassl (Table 3). Plant accessions were obtained through the Agricultural Research Service-Germplasm Resources Information Network (ARS-GRIN) (http://www.ars-grin.gov). Families derived from PI329311 and PI510757 were crossed in Puerto Vallarta, Mexico in the winter of 2012. All other crosses were made in the winter of 2013. The F1s were grown out in Florence, South Carolina the following summers—2012 for the two families above and 2013 for the rest. Subsequent generations were grown in Puerto Vallarta each year. The panicles of each generation were bagged to prevent outcrossing and ensure selfing. The F6 RILs were phenotyped for testa pigmentation and pericarp color where three seeds were selected to represent each line. Pericarp color was visually assessed and categorized as red, brown, yellow, or white (Supplementary Figure S1). Subsequently, the grain was split with a razor blade, and the testa was visually inspected for the presence or absence of pigmentation (Choi et al. 2019).
Table 1.
NAM parent characteristics
| Common name | Accession | Race | Origin | Sorghum type | Pericarpa | Testab |
|---|---|---|---|---|---|---|
| Grassl | PI154844 | Caudatum | Uganda | Cellulosic | r | y |
| Chinese Amber | PI22913 | Bicolor | China | Sweet | b | y |
| IS 2382 | PI229841 | Kafir | South Africa | Grain | r | y |
| IS 13613 | PI297130 | Caudatum | Uganda | Cellulosic | w | y |
| IS 13633 | PI297155 | Kafir | Uganda | Grain | r | y |
| IS 11069 | PI329311 | Durra | Ethiopia | Cellulosic | y | n |
| Mbonou | PI506069 | Guinea-bicolor | Togo | Cellulosic | y | n |
| MA 38 | PI508366 | Guinea | Mali | Cellulosic | w | n |
| AP79-714 | PI510757 | Durra | Cameroon | Cellulosic | w | n |
| Rio | PI563295 | Durra-caudatum | Maryland, USA | Sweet | w | y |
| Leoti | PI586454 | Kafir-bicolor | Hungary | Sweet | r | y |
| Pink Kafir | PI655972 | Kafir | Kansas, USA | Forage | w | n |
The characteristics of each NAM parent include the common name, USDA plant introduction numbers, botanical race, original source of germplasm, type as defined in the introduction, pericarp color, and presence or absence of pigmentation within the testa layer.
b, brown; r, red; y, yellow, and w, white.
y, pigmented and n, not pigmented.
Table 3.
RIL family statistics
| Male parent | No. indiv. | No. markers | Avg. inbreeding coefficient |
|---|---|---|---|
| PI22913 | 203 | 9,258 | 0.62 |
| PI229841 | 209 | 7,422 | 0.60 |
| PI297130 | 243 | 8,770 | 0.60 |
| PI297155 | 216 | 7,470 | 0.61 |
| PI329311 | 240 | 9,460 | 0.58 |
| PI506069 | 204 | 7,756 | 0.59 |
| PI508366 | 232 | 7,097 | 0.63 |
| PI510757 | 274 | 7,193 | 0.58 |
| PI563295 | 245 | 6,656 | 0.56 |
| PI586454 | 200 | 8,038 | 0.57 |
| PI655972 | 223 | 7,430 | 0.63 |
The columns from left to right are the male parent plant introduction number (column 1), the total number of individuals (column 2), markers in each family (column 3), and the average inbreeding coefficient (column 4).
Genotype-by-sequencing data production and processing
Genotyping by sequencing (GBS) data were generated at the University of Wisconsin using leaf tissue collected from 2-week-old seedlings for each individual at the F6 generation. DNA was extracted using a modified CTAB protocol and double-digested using the enzymes PstI and MspI, which improve the fidelity of SNP markers, are better at reducing genomic complexity and generate a more uniform library than ApeKI (Poland et al. 2012; Thurber et al. 2013). GBS libraries were single-end sequenced using an Illumina HiSeq2500 sequencer except for one plate which was sequenced on a NovaSeq6000 resulting in 100-bp reads. GBS were processed using Tassel version 5.2.52 (Bradbury et al. 2007) following the GBS version 2 pipeline procedures (Glaubitz et al. 2014). Tags were aligned to the BTx623 version 3.1 annotated reference genome (McCormick et al. 2018), obtained from Phytozome (Goodstein et al. 2012), using BWA version 0.7.17 (Li and Durbin 2010). Beagle version 5.1 was used to impute missing genotype data in the variant call format (VCF) file resulting from the Tassel pipeline (Browning et al. 2018). Prior to mapping, SNPs were pruned using Plink (–indep 50 5 2) to reduce the number of associations derived from SNPs within LD blocks.
SNP density plots were generated using R-CMplot version 3.6.0 (https://github.com/YinLiLin/R-CMplot). The inbreeding coefficient, nucleotide diversity and Tajima’s D were calculated on family-specific VCFs using VCFtools version 0.1.16 (Danecek et al. 2011). Nucleotide diversity and Tajima’s D (–window 100000) were plotted in R (R Core Team 2019) by chromosome for each family (Supplementary Figures S6 and S7). The effects of SNPs were predicted using snpEff (Cingolani et al. 2012) and plotted using MultiQC (Ewels et al. 2016), and linkage disequilibrium (LD) statistics were calculated using Plink v1.90b6.10 (Purcell et al. 2007). The LD decay plot was generated using PopLDdecay (Zhang et al. 2019) with a 300 kb window and custom R scripts were LD decay was estimated for individual chromosomes as well as genome-wide (Hu et al. 2019). The sorghum reference genome was also in silico digested using restriction sites for the enzymes PstI (CTGCA—G) and MspI (C—CGG) using a custom R script adapted from Hu et al. (2019), and the segment lengths from the digestion were obtained using the R package SimRAD (Lepais and Weir 2014) and plotted using a custom CPython script (Van Rossum and Drake 2009) and the package seaborn (Waskom et al. 2017).
NAM population contrast and structure
Data for the Tx430 grain NAM was accessed from Dryad (Hu et al. 2019) and filtered using the individuals unique to the Tx430 grain NAM (Bouchet et al. 2017). The variants for both the Tx430 grain and CP-NAM had the reference alleles corrected using a custom script (https://github.com/jlboat/CP-NAM) before merging the populations using VCFtools (Danecek et al. 2011). The merged variants were filtered using VCFtools for <20% missing data, and the common SNPs were used to assess genotypic diversity between the two populations. Principal component analysis (PCA) was performed on the individual and merged populations using SNPRelate (Zheng et al. 2012). In the CP-NAM PCA plot, Grassl is represented by “x” for clarity.
Population structure was estimated from the pruned SNPs using ADMIXTURE (Alexander and Lange 2011). Fivefold cross-validation was used to determine the optimal number of ancestral populations, K, by selecting the model that had the lowest cross-validation error (K = 15; Supplementary Figure S11). The Q matrix of the selected model—representing the ancestry fractions of individuals—was then sorted by ancestry coefficient for each subpopulation such that individuals with coefficients >50% were assigned to the corresponding subpopulation. Subpopulations were classified as Q1–Q15 as determined by the column containing the sorted ancestry coefficient. This classification was used to represent ancestral admixture of individuals in the CP-NAM PCA.
Quantitative trait loci mapping
The imputed genotype matrix was filtered to create a separate VCF file for each RIL family using VCFtools (Danecek et al. 2011). Variants with minor allele frequency (MAF) <0.05 and missing data (>0.3) were removed from each family using VCFtools before converting RIL genotypes to ABH format using Genotype-Corrector (Miao et al. 2018), where A and B alleles were derived from parents A and B, respectively, and H represents a heterozygous marker call. Pseudomarkers were inserted into the genetic map at 1 cM intervals prior to calculating conditional genotype probabilities. The conditional probabilities of the true genotypes were estimated using a hidden Markov model for each RIL family with a genotyping error rate of 0.0001 and Haldane’s mapping function (Kosambi 2016). Quantitative trait loci (QTL) were mapped for each RIL family using both Haley-Knott regression (Haley and Knott 1992) and a linear mixed model accounting for relationships among individuals using a random polygenic effect using R qtl2 version 0.22 (Broman et al. 2019). Kinship matrices were calculated using the allele probabilities and incorporated into a linear mixed model genome scan performed using along with pericarp phenotypic data (Broman et al. 2019). Due to reduced noise in the linear mixed model results, Haley-Knott regression results are not discussed.
Genome-wide association studies
The software GEMMA version 0.98.1 (Zhou and Stephens 2014) was used for genome-wide association studies (GWAS). The imputed VCF file containing the entire NAM was converted to Plink format using VCFtools (Danecek et al. 2011) before using Plink (Purcell et al. 2007) to generate the accompanying phenotype files. GEMMA was then used to calculate a standardized relatedness matrix—where the genotype data are standardized before estimating a relatedness matrix (Astle and Balding 2009)—for linear mixed modeling on the filtered data (–miss = 0.3 –maf = 0.05) (Zhou and Stephens 2014). Models were initially run with principal components (PCs) as covariates. However, the inclusion of PCs did not alter associated variants. As a result, all models described did not contain PCs. Univariate and multivariate models were run to determine the effects of testa pigmentation on the mapping of pericarp color. Where univariate linear mixed models were fit using the following form:
where y is a vector of pericarp colors for n individuals; W is a matrix of covariates including a column of 1 s for estimating the intercept; is a vector of the corresponding coefficients; x is an n-vector of genotypes; β is the effect size of the marker; u is a vector of random effects; is a vector of errors; is the variance of the residual errors; λ is the ratio between the two variance components; K is a known n × n standardized relatedness matrix (Zhou and Stephens 2014).
Models included a univariate model using pericarp color with all phenotypes, a univariate model with binary encodings for the yellow phenotype—where yellow is 1 and all other phenotypes are 0, a univariate pericarp model with testa pigmentation as a covariate, a univariate model with pericarp color and testa pigmentation covariate based on three pericarp colors (red, yellow, and white), and a multivariate model using both pericarp color and testa pigmentation. Where the multivariate linear mixed model was fit using the following form:
where Y is a n × d vector of n individuals and d phenotypes—namely pericarp color and testa pigmentation; W is a vector of 1 s to estimate the intercept; A is a matrix of the corresponding coefficients; x is an n-vector of genotypes; β is a d-vector of marker effect sizes for the d phenotypes; U is an n × d matrix of random effects; and E is an n × d matrix of errors (Zhou and Stephens 2014). Manhattan and Q-Q plots were generated using R-CMplot version 3.6.0 (https://github.com/YinLiLin/R-CMplot).
Data availability
Raw GBS data are available at the European Nucleotide Archive under the project accession PRJEB40592. The Tx430 NAM data were accessed from dryad at doi: 10.5061/dryad.63h8fd4 (Hu et al. 2019). Scripts are available on GitHub (https://github.com/jlboat/CP-NAM) under MIT License. Code freezes are available for BWA and PopLDdecay via Singularity containers (Kurtzer et al. 2017) and were executed using Singularity version 3.5.3. Containers may be directly pulled from SingularityHub: https://singularity-hub.org/collections/2877. Supplemental materials available at figshare: https://figshare.com/s/0ba752156d0cb7fb6404. CP-NAM seeds are available upon request.
Results
CP-NAM parent carbon-partitioning diversity
The CP-NAM parents were selected due to the broad phenotypic variance of their carbon-partitioning traits (Table 2 and Supplementary Table S1). The selected traits capture the primary above-ground carbon-partitioning regimes represented by the major sorghum types. The overall distribution of each phenotype was largely consistent across years and replicates (Supplementary Figure S2), and the phenotypic distributions across all accessions was quite broad (Supplementary Figure S3). Due to the photoperiod sensitivity of many of the parental accessions, significant quantities of structural and carbohydrates are accumulated across both stems and leaves, and appreciable nonstructural carbohydrates are stored within the stems (Table 2 and Supplementary Table S1). Accessions that did not flower (i.e., photoperiod sensitive accessions) were not included in the panicle weight data since they never produced panicles.
In silico digestion and single-nucleotide polymorphisms
The complete NAM population genotypic data contained 144,087 SNPs after imputation of the original SNP calls, which corresponds to an average density of one SNP per 5 kb. The subtelomeric SNP density was higher than the pericentromeric regions (Supplementary Figures S4 and S5). To assess the putative restriction sites for PstI and MspI restriction enzymes, the BTx623 reference genome was in silico digested (Supplementary Figures S6 and S7), and as seen with SNP density, restriction sites were primarily concentrated in subtelomeric regions with gaps surrounding centromeric regions. The patterns of nucleotide diversity were largely consistent across families with greater diversity seen around centromeres (Supplementary Figure S8). Similarly, patterns of Tajima’s D statistics were more variable around centromeres and typically positive across all families and chromosomes except for some regions showing strong directional selection (Supplementary Figure S9). The effects of all SNPs were analyzed using snpEff (Cingolani et al. 2012) and plotted using MultiQC (Ewels et al. 2016) (Supplementary Data 1). The overall transition-transversion ratio was 1.649 with about half of the variant effects occurring upstream or downstream of known loci, approximately 20% of effects falling into intergenic regions, and the remaining 30% occurring within genic regions. The impacts of most effects were predicted to be modifier effects (85%) with the remaining effects distributed approximately equally among low, moderate, and high impact (5% each). The LD decay was estimated for individual chromosomes as well as genome-wide (Figure 1). The genome-wide LD decays to r2 < 0.2 around 100 kb, and Chr 6 exhibits consistently higher LD compared to the other chromosomes.
Figure 1.
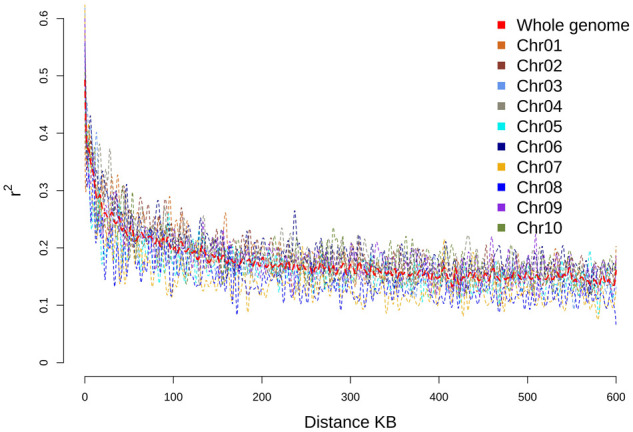
Linkage decay (Pearson’s correlation coefficient squared) plotted against the distance in kilobases across the genome.
Validating RIL families
Pruning reduced the number of SNPs from 144,087 to 57,603, and after filtering SNPs with a MAF < 0.05, that number was further reduced to 38,682. Marker counts for individual families ranged from about 7000 to over 9000, and the average inbreeding coefficients were approximately 0.6 for all families (Table 3). Among the RILs, all families had at least one QTL for pericarp color except for the PI229841, PI297155, and PI586454 RILs (Supplementary Tables S2 and S3; Supplementary Figures S29–S39). Most families had a QTL located on Chr 4 (62.4 Mb), but there were also hits on Chr 1 (PI508366 and PI563295 RILs), two (PI508366 RILs), seven (PI297130 and PI506069 RILs), and nine (PI655972 RILs). Notably, the PI563295 RILs had a significant QTL spanning 23 Mb on Chr 1 for pericarp color. Because QTL mapping results closely overlapped GWAS results, all genetic mapping results discussed henceforth with be based on GWAS results.
NAM population contrast and structure
For further quality control, a PCA was performed for the CP-NAM. As expected, RILs were oriented toward their corresponding parents, which is indicative of the genetic mosaicism within these lines (Figure 2). The first 10 PCs account for 34.7% of the genomic variation with the first two PCs explaining 7.80 and 6.18% of the variation, respectively. Similarly, a PCA was conducted using the set of common SNPs (8289) between the Tx430 grain NAM and the CP-NAM (Supplementary Figure S10) to compare the genetic differences between the two populations. Substantial variation was observed both within and between the NAM populations (Supplementary Figures S11 and S12). The first PC clearly separated the two NAM populations and accounted for 19% of the variance—substantially higher than the 7.5% for the first PC of individual NAM populations—while the second PC accounted for 5% of the variance (Supplementary Figure S11). The distribution of common SNPs between the two NAM populations was similar across the genome (Supplementary Figure S10) as compared to the distribution within the CP-NAM alone (Supplementary Figures S4 and S5).
Figure 2.
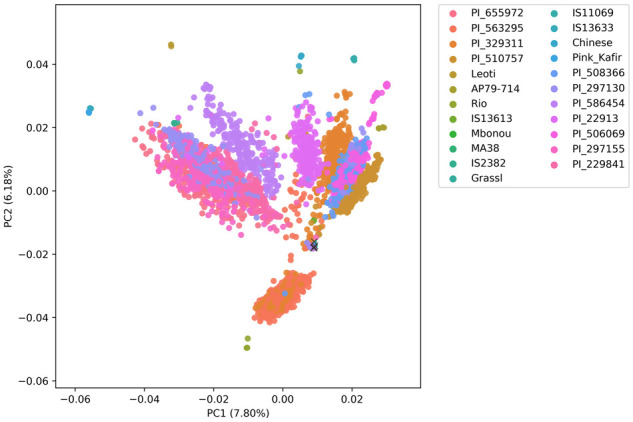
Principal component analysis plot using the whole CP-NAM population. Parents are labeled with the common name. The individual samples of the recurrent parent, Grassl, are additionally labeled with “x.” Each RIL family is represented by the male parent PI.
Analysis of population admixture resulted in the identification of 15 ancestral populations within the CP-NAM (Figure 3). Multiple subgroups were identified within the major sorghum botanical races. When the ancestral population classification was superimposed over the CP-NAM PCA, admixture among RIL families is clearly identifiable (Figure 4).
Figure 3.
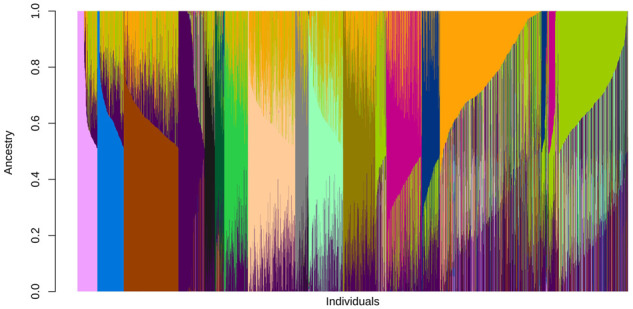
Genome-wide, population admixture of the CP-NAM. Individuals (x-axis) are shown as vertical bars colored in proportion to their estimated ancestry within each cluster (y-axis) based upon 15 ancestral populations (K = 15) where each genetically distinct ancestral population is given a unique color.
Figure 4.

CP-NAM PCA with admixture coloration. Individuals were classified as Q1–Q15 as determined by the proportion of ancestral admixture. Cells 1–11 represent individual RIL families represented by the paternal identifier while the 12th cell contains the entire CP-NAM population.
Genome-wide association studies
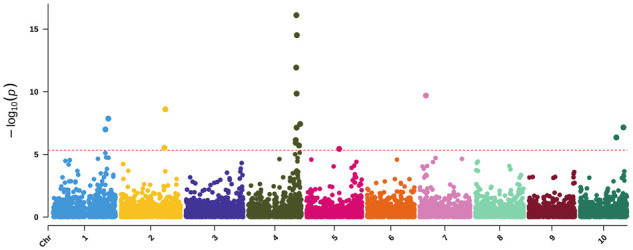
Univariate GWAS for pericarp color
The GWAS for the entire NAM population identified six significant peaks across four chromosomes. Chromosome one contained a single broad peak—also identified by the PI563295 RILs QTL mapping—that was somewhat resolved by binary encoding for yellow pericarp (as described below). Two hits were identified on Chr 2 (at 6,940,113 and 57,797,411), and the most significantly associated SNP was near 62 Mb on Chr 4 (62,215,490 bp; 3.76E-31). There were also two hits on Chr 7 (9,097,206 and 44,198,228 bp) (Figure 5 and Supplementary Figure S14). We also mapped all pericarp colors with testa as a covariate to account for the spread of tannin from the testa layer and the traditional (red, yellow, and white) colors, but the differences were minimal compared to three GWAS discussed here (Supplementary Figures S15 and S16).
Figure 5.
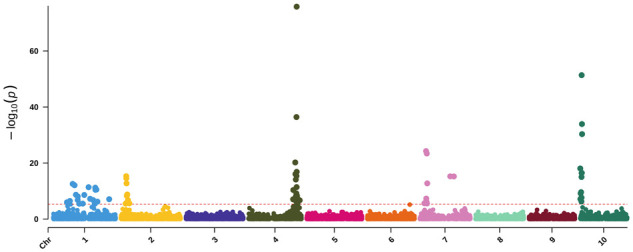
Univariate GWAS for pericarp pigmentation. The −log10 P-values (y-axis) are plotted against the position on each chromosome (x-axis). Each circle represents a SNP, and the red dashed line represents the Bonferroni-corrected threshold.
Univariate GWAS for yellow pericarp
Since the GWAS containing all phenotypes failed to identify the yellow seed1 (y1) locus (Sobic.001G397900), the phenotypes were then given binary encodings for yellow pericarp color. With binary phenotypes for yellow pericarp color, we were able to identify a peak near y1 (Figure 6, Supplementary Figure S18; Table 4) and increase the significance for the second peak on Chr 2 (57,797,411 bp) identified in the standard encoding GWAS. The hit on Chr 4 is the same SNP as that for the univariate pericarp mapping. The SNP on Chr 7 (9,097,206 bp) mapped in the univariate GWAS for all pericarp colors is within a 1 Mb proximity of the SNP on chromosome seven (8,111,484 bp) mapped here and highly correlated (r2 = 0.83). The additional SNP on Chr 10 (56,346,032 bp) falls within a QTL (56,223,543–56,564,728 bp) previously identified when mapping endosperm carotenoid content—though the exact gene regulating the trait is unclear (Fernandez et al. 2008; Mace et al. 2019).
Figure 6.
Univariate GWAS for binary encoding of yellow pericarp pigmentation. The −log10 P-values (y-axis) are plotted against the position on each chromosome (x-axis). Each circle represents a SNP, and the red dashed line represents the Bonferroni-corrected threshold.
Table 4.
Top associations from the NAM GWAS
| Model | Chromosome | Position | Wald P-value | Genes |
|---|---|---|---|---|
| Univariate Pericarp | 1 | − | − | <block too large> |
| Univariate Pericarp | 2 | 6,940,113 | 1.23E-10 | tan2 |
| Univariate Pericarp | 2 | 57,797,411 | 2.26E-06 | Classical Z locus; Sobic.002G190000 |
| Univariate Pericarp | 4 | 62,215,490 | 3.76E-31 | tan1 |
| Univariate Pericarp | 7 | 9,097,206 | 4.86E-15 | Unknown |
| Univariate Pericarp | 7 | 44,198,228 | 2.66E-08 | Unknown |
| Univariate Yellow | 1 | 71,320,809 | 1.39E-08 | y1 |
| Univariate Yellow | 2 | 57,797,411 | 2.50E-09 | Classical Z locus; Sobic.002G190000 |
| Univariate Yellow | 4 | 62,215,490 | 7.70E-17 | tan1 |
| Univariate Yellow | 7 | 8,111,484 | 2.00E-10 | Unknown |
| Univariate Yellow | 10 | 56,346,032 | 6.96E-08 | Putative carotenoid regulator |
| Multivariate Pericarp | 1 | − | − | <block too large> |
| Multivariate Pericarp | 2 | 6,940,113 | 5.00E-16 | tan2 |
| Multivariate Pericarp | 4 | 62,215,490 | 3.82E-37 | tan1 |
| Multivariate Pericarp | 4 | 62,463,940 | 1.55E-76 | tan1 |
| Multivariate Pericarp | 6 | 55,070,387 | 6.89E-06 | Putatively tt16 ortholog |
| Multivariate Pericarp | 7 | 8,111,484 | 5.54E-25 | Unknown |
| Multivariate Pericarp | 7 | 39,531,969 | 5.51E-16 | Unknown |
| Multivariate Pericarp | 7 | 44,198,228 | 6.02E-16 | Unknown |
| Multivariate Pericarp | 10 | 1,948,816 | 4.30E-52 | waxy |
For each significant association, the model, chromosome containing the SNP, SNP position, wald t-test P-value, and putative gene in LD with the significant SNP are identified.
Multivariate GWAS for pericarp color and testa pigmentation
Multivariate GWAS for the entire NAM population had peaks similar to those identified in the univariate analyses (Figure 7; Table 4) with the exception of novel peaks on chromosomes six and 10. The peak on Chr 6 (55,070,387 bp) is close to a known QTL (55,653,174–55,805,785 bp) mapped using brown grain pigmentation (Rhodes et al. 2014). The multivariate GWAS identified two SNPs around 42 Mb on Chr 7, one of which is the same SNP as the univariate GWAS (Chr7:44,198,228 bp). These two SNPs were highly correlated with each other (r2 = 0.97) even though there is approximately 5 Mb between them. Last, a peak at Chr10 (1,948,816 bp) was identified, which was unique to the multivariate analysis.
Figure 7.
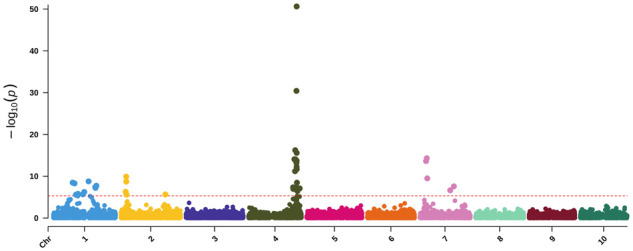
Multivariate GWAS for pericarp color and testa pigmentation. The −log10 P-values (y-axis) are plotted against the position on each chromosome (x-axis). Each circle represents a SNP, and the red dashed line represents a Bonferroni-corrected threshold.
Discussion
Sorghum was domesticated around 5,000 years ago and has since become a major cereal crop and the primary crop of arid zones (De Wet and Harlan 1971; Smith et al. 2019). Sorghum has historically been valued as a crop for its stem sugars and grain (Wall and Blessin 1970; Subramanian et al. 1987)—with improvement focusing on a single nonstructural carbohydrate either sucrose or starch, respectively (Murray et al. 2008; Saballos 2008) and more recently as a source of biomass (Murray et al. 2008). In contrast to some other C4 grains and grasses, sorghum production can be successful in low- and high-input agriculture due to its ability to grow in marginal soils, and it serves as a dual-purpose crop due to the production of both grain and stem sugars (Calviño and Messing 2012). The diverse carbon-partitioning regimes of sorghum provide a unique opportunity to study the processes underlying source-sink relationships in the C4 grasses. In addition, the genetic properties of sorghum such as its compact, diploid genome (730 Mb) (Paterson et al. 2009), the availability of genetic and genomic resources (Brenton et al. 2016; McCormick et al. 2018; Boyles et al. 2019; Mace et al. 2019) and broad phenotypic variability (Morris et al. 2013a) further establish sorghum as a vital crop for not only bioenergy (Calviño and Messing 2012) but also carbon partitioning more generally (Slewinski 2012).
As the cost of developing genomic resources has continued to decline, sorghum has seen an increase in publicly available genomic resources (Boyles et al. 2019). Genetic mapping populations are designed to effectively dissect the genomic architecture underlying specific traits, and sorghum mapping population resources include diversity panel (Morris et al. 2013a; Brenton et al. 2016), grain NAM (Bouchet et al. 2017; Marla et al. 2019), multiparent advanced generation intercross (Ongom and Ejeta 2018) and mutagenized populations (Xin et al. 2008; Addo-Quaye et al. 2018). As the number of available populations increases, newly established populations should demonstrate unique utility, whether that be easier management, improved throughput, a specific phenotypic focus, or better statistical design. For instance, all four, alternative sorghum NAMs focus on grain sorghum (Boyles et al. 2019), and the CP-NAM uniquely allows for the genetic dissection of pathways facilitating carbon-partitioning regimes that may be exploited for bioenergy traits as well. The CP-NAM parents were selected from the BAP to maximize the phenotypic and genetic diversity of their carbon-partitioning traits. Preliminary phenotypic characterization of the parents was done as a part of Brenton et al. (2016). These phenotypes covered a variety of agronomic and physiological traits (Supplementary Figures S2 and S3; Table 2 and Supplementary Table S1) and demonstrate substantial diversity among the CP-NAM parents. In particular, the CP-NAM parents are able to accumulate significantly more structural and nonstructural carbohydrates than grain sorghum due to the inclusion of photoperiod sensitive lines (Rooney and Aydin 1999; Brenton et al. 2016). The accumulation of carbon is also variable across the parts of the plants with parental accessions differentially allocating carbon to the various sinks (Table 2).
To further distinguish this population, we provide a comparison of the CP-NAM to an existing, publicly available sorghum grain NAM population developed with RTx430 as the recurrent parent (Bouchet et al. 2017). We selected Tx430 NAM because it was not a backcross NAM as two of the existing NAM populations are, and of the two remaining sorghum NAMs, Tx430 was the only population with publicly available variants at the time of writing. These NAM populations were both sequenced using GBS and share 8289 SNPs in common with <20% missing data (Supplementary Figures S10 and S11). While the Tx430 grain NAM used ApeKI restriction digest, we utilized a double digest using the enzymes PstI and MspI, which improve the fidelity of SNP markers, are better at reducing genomic complexity and generate a more uniform library than ApeKI (Supplementary Figures S6 and S7) (Poland et al. 2012; Thurber et al. 2013). The two populations are both genotypically diverse (Supplementary Figure S11) and yet distinct as the first principal component (PC1), which explains over 19% of the variation, effectively separates the two populations. The CP-NAM also exhibits significant diversity across families as demonstrated by nucleotide diversity (Supplementary Figure S8), Tajima’s D (Supplementary Figure S9), and PCA (Figure 2).
Population structure was also assessed to determine the degree of ancestral genetic admixture captured by the CP-NAM (Figure 3). Cross-validation identified 15 major ancestral populations represented in the CP-NAM with notable admixture occurring even within RIL families (Figure 4). This admixture is evident across different sorghum races and the major sorghum types—revealing that the CP-NAM captures a notable portion of sorghum diversity. The RIL families from PI329311, PI510757, PI563295, and PI655972, exhibit the strongest degree of population subdivision relative to the other RILs and represent three of the four major sorghum types. RILs derived from paternal bicolor races (i.e., PI22913 and PI506069) also demonstrate higher admixture than RILs derived from other races such as kafir (i.e., PI229841 and PI229155), which is known to be geographically limited and exhibits stronger genetic bottleneck (Deu et al. 2006; Klein et al. 2008; Sapkota et al. 2020). The representation of historical admixture within the CP-NAM permits the elucidation of the mechanisms regulating carbon partitioning among the various sorghum types since their initial divergence. As LD influences the resolution at which we can identify trait mapping and informs breeding decisions, the LD decay was estimated for individual chromosomes as well as genome-wide (Figure 1). The genome-wide LD decays to r2 < 0.2 around 100 kb, and Chr 6 exhibits consistently higher LD compared to the other chromosomes, which is consistent with previous findings concerning limited recombination on Chr 6 (Hu et al. 2019) and a high degree of synteny between sorghum and Oryza sativa L. (Kim et al. 2005).
Sorghum pericarp and testa pigmentation are well-characterized domestication traits, which are regulated by a few loci (Zhang et al. 2015) and therefore serve as good quality-control targets for genetic validation of new genomic resources (Morris et al. 2013b). Sorghum seed color phenotypes vary based upon carotenoid and polyphenol compounds present within the corresponding kernel layers (Rhodes et al. 2014). The primary pericarp colors—red, yellow, and white—are regulated by the R and y1 loci, but due to additional loci that further modulate pericarp color such as I (intensifier), S (spreader), and Z (mesocarp thickness), pericarp color also comes in black, brown, orange, and pink as well as ranges of those colors varying in tint, shade or even spotted (Dykes et al. 2013; Rhodes et al. 2014).
Condensed tannins—a subtype of polyphenol—strongly contribute to kernel pigments in sorghum grain and are regulated by two loci—traditionally known as B1 and B2 but recently identified as, which corresponds to tannin 1 (tan1) [Sobic.004G280800; (Wu et al. 2012)] and tannin 2 (tan2) [Sobic.002G076600; (Wu et al. 2019)] – with duplicate recessive interaction. When either locus contains homozygous recessive alleles, condensed tannins fail to accumulate within the sorghum grain (Wu et al. 2019) which otherwise confer a brown pigmentation to grains. Brown pericarp, in particular, is associated with significantly higher proanthocyanidin concentrations (Rhodes et al. 2014) and may be used to predict the nutritional value of sorghum grains since brown seed color is associated with anti-nutritive compounds such as tannins which also confer a bitter taste (Sedghi et al. 2012; Ebadi et al. 2019). Similarly, the y1 locus encodes a MYB family transcription factor that regulates phlobaphene—another phenolic compound—biosynthesis (orthologous to Arabidopsis tt2) yielding a yellow pericarp while loss of function confers a white color (Ibraheem et al. 2010; Rhodes et al. 2014), and the R locus confers a red tint to the pericarp but only with dominant y1 (Doggett 1987).
By employing a variety of phenotypic encodings as well as univariate and multivariate GWAS, we were able to identify a number of these well-established loci as well as three additional loci. The univariate pericarp color GWAS (Figure 5) resulted in six peaks across four chromosomes. The lack of distinct peaks on Chr 1 has been previously observed when mapping 3-deoxyanthocyanid concentrations—associated with grain pigmentation (Rhodes et al. 2014)—and pericarp color where precise mapping of the y1 gene, in particular, can prove difficult (Morris et al. 2013b). The two hits for pericarp color on Chr 2 likely correspond to (tan2) (Sobic.002G076600) for the first SNP (Mace and Jordan 2010; Wu et al. 2019) while the hit around 58 Mb—previously identified by Rhodes et al. (2014) when mapping grain color and Hu et al. (2019) using mesocarp thickness—corresponds to Sobic.002G190000. Here, mapping of binary phenotypes based on yellow pericarp color circumvents issues associated with brown phenotypes that simply removing brown failed to resolve. Brown pericarp is known to mask the expression of R and y1 genes—located on chromosomes three and one, respectively—because the phenotype is generated by the spread of tannin from the testa layer (Morris et al. 2013b). As such, we additionally performed a multivariate GWAS with both pericarp and testa pigmentation (Figure 7). However, we were unable to map the R locus—possibly due to the potentially complicating pericarp phenotypes present in this population.
Using a multivariate GWAS for both pericarp and testa color, we were able to identify tan1 and tan2 loci (Figure 7). Both loci along with the region near Chr10:56,346,032 previously associated with carotenoid content, Sobic.006G213900 on Chr 6 and y1 regulate polyphenolic compounds, and most of these genes are known components of the flavonoid pathway (Rhodes et al. 2014). The presence of these compounds directly affects kernel color. Sobic.006G213900 encodes a MADS-box transcription factor orthologous to Arabidopsis transparent testa 16 (tt16), while the peak at Chr10 (1,948,816 bp) may correspond to waxy (Sobic.010G022600), which encodes a glycosyl-transferase orthologous to Arabidopsis granule-bound starch synthase 1 (Figure 7). All GWAS had a peak for tan1, which commonly occurs due to the strong effect of tannin content on pericarp color (Wu et al. 2012). Similarly, identification of Sobic.002G190000—a gene encoding a zinc-finger protein that colocalizes with the classical Z locus, which is known to regulate mesocarp thickness (Wu et al. 2019)—is consistent with the impact of mesocarp thickness on perceived kernel color (Mace and Jordan 2010; Hu et al. 2019). Both locations on Chr 7 were previously associated with inflorescence traits with the earlier peak (Chr7:9,097,206 bp) falling within a QTL for inflorescence width and the later SNP (Chr7:44,198,228 bp) associating with dry inflorescence weight (Zhang et al. 2015). It is possible that the identified SNPs are either novel sources of variation or are in LD with known inflorescence traits. Last, the putative identification of waxy in the multivariate GWAS may result from either differing starch concentrations or composition in the grain or the SNP may simply fall within a common linkage block. The alleles putatively associated with waxy segregated in PI22913 and PI586454 RIL families both of which are sweet sorghums with bicolor and kafir-bicolor racial backgrounds. It may be that as more carbon is allocated to starch production and concentrations increase, pericarp color may lighten since pure starch is white. The impacts of alterations in carbon partitioning may confer either large systemic changes—as seen between different sorghum types—or small changes—as even a trait as innocuous as perceived pericarp color could be subject to change.
We created a NAM population in sorghum that specifically captures the contrasting phenotypic traits needed to characterize, define, and model the complexities of carbon fixation, translocation, and utilization within an amendable model system. The dynamics of these carbon partitioning features can all be captured by this population because it incorporates every sorghum type in a structured population that can be used for traditional linkage or association mapping, eQTL studies, or physiological and agronomic modeling experiments (Guo et al. 2010; Slewinski 2012; Irving 2015). Each type is defined by its own source/sink relationship and compositional construction which influences plant metabolism, photosynthetic capability, and carbon fixation and sequestration potential (Irving 2015). As more emphasis is placed on the role of agronomy, management, and crop selection in carbon sequestration, a suitable model will be needed to fully elucidate the complex interactions that define the carbon costs and benefits of cropping options, especially as it relates to sorghum (Popp et al. 2011; Hammer et al. 2019).
In summary, the CP-NAM provides unique benefits to researchers and scientists seeking to understand, characterize, and exploit plant systems to increase overall productivity and tailor agronomic crops for specific usages that ultimately increase the availability of nutritious food and sustainable feedstocks to address both the shortage of arable land and the continuous release of greenhouse gas emissions from human activities. The creation and characterization of this population addresses the fundamental lack of genomic resources for nonfood usages of crop species and shifts focus from the entrenched emphasis on grain production to a more robust system tailored to overall productivity, which could ultimately lead to yield gains in food and feed production. The CP-NAM can serve as a fundamental resource to explicate the relationship among carbon fixation, sequestration, and productivity to create crops for both the traditional and future needs of agricultural production.
Acknowledgments
Computational analyses were performed on Clemson University’s Palmetto Cluster, and we thank the staff who assisted with cluster and software maintenance.
J.L.B. and Z.B. wrote the manuscript. J.L.B. performed all computational analyses. M.M., R.B., and Z.B. developed the population. M.M. managed field experiments and seed regenerations. K.E.J., S.D., and S.S. collected phenotypes. N.S. and E.C. generated and collected GBS data. G.M. and S.K. conceptualized, developed, and implemented the study design.
Funding
This project was funded in part by the Department of Energy’s Advanced Research Project Agency award number DE-AR0000595 and the United States Department of Agriculture grant 2011-67009-30594.
Conflicts of interest: None declared.
Literature cited
- Addo-Quaye C, Tuinstra M, Carraro N, Weil C, Dilkes BP.. 2018. Whole-genome sequence accuracy is improved by replication in a population of mutagenized sorghum. G3 (Bethesda). 8:1079–1094. [DOI] [PMC free article] [PubMed] [Google Scholar]
- Alexander DH, Lange K.. 2011. Enhancements to the ADMIXTURE algorithm for individual ancestry estimation. BMC Bioinformatics. 12:246. [DOI] [PMC free article] [PubMed] [Google Scholar]
- Ali ML, Rajewski JF, Baenziger PS, Gill KS, Eskridge KM, et al. 2008. Assessment of genetic diversity and relationship among a collection of US sweet sorghum germplasm by SSR markers. Mol Breed. 21:497–509. [Google Scholar]
- Astle W, Balding DJ.. 2009. Population structure and cryptic relatedness in genetic association studies. Statist Sci. 24:451–471. [Google Scholar]
- Bajgain P, Rouse MN, Tsilo TJ, Macharia GK, Bhavani S, et al. 2016. Nested association mapping of stem rust resistance in wheat using genotyping by sequencing. PLoS ONE 11:e0155760. [DOI] [PMC free article] [PubMed] [Google Scholar]
- Bhattarai B, Singh S, West CP, Saini R.. 2019. Forage potential of pearl millet and forage sorghum alternatives to corn under the Water-Limiting conditions of the texas high plains: A review. Crop Forage Turfgrass Manag. 5:190058. [Google Scholar]
- Bouchet S, Olatoye MO, Marla SR, Perumal R, Tesso T, et al. 2017. Increased power to dissect adaptive traits in global sorghum diversity using a nested association mapping population. Genetics 206:573–585. [DOI] [PMC free article] [PubMed] [Google Scholar]
- Boyles RE, Brenton ZW, Kresovich S.. 2019. Genetic and genomic resources of sorghum to connect genotype with phenotype in contrasting environments. Plant J. 97:19–39. [DOI] [PubMed] [Google Scholar]
- Boyles RE, Cooper EA, Myers MT, Brenton Z, Rauh BL, et al. 2016. Genome-wide association studies of grain yield components in diverse sorghum germplasm. Plant Genome 9:1–17. [DOI] [PubMed] [Google Scholar]
- Bradbury PJ, Zhang Z, Kroon DE, Casstevens TM, Ramdoss Y, et al. 2007. TASSEL: software for association mapping of complex traits in diverse samples. Bioinformatics 23:2633–2635. [DOI] [PubMed] [Google Scholar]
- Brenton ZW, Cooper EA, Myers MT, Boyles RE, Shakoor N, et al. 2016. A genomic resource for the development, improvement, and exploitation of sorghum for bioenergy. Genetics 204:21–33. [DOI] [PMC free article] [PubMed] [Google Scholar]
- Brenton ZW, Juengst BT, Cooper EA, Myers MT, Jordan KE, et al. 2020. Species-Specific duplication event associated with elevated levels of nonstructural carbohydrates in Sorghum bicolor. G3 (Bethesda). 10:1511–1520. [DOI] [PMC free article] [PubMed] [Google Scholar]
- Broman KW, Gatti DM, Simecek P, Furlotte NA, Prins P, et al. 2019. R/qtl2: software for mapping quantitative trait loci with High-Dimensional data and multiparent populations. Genetics 211:495–502. [DOI] [PMC free article] [PubMed] [Google Scholar]
- Browning BL, Zhou Y, Browning SR.. 2018. A One-Penny imputed genome from Next-Generation reference panels. Am J Hum Genet. 103:338–348. [DOI] [PMC free article] [PubMed] [Google Scholar]
- Buckler ES, Holland JB, Bradbury PJ, Acharya CB, Brown PJ, et al. 2009. The genetic architecture of maize flowering time. Science 325:714–718. [DOI] [PubMed] [Google Scholar]
- Byrt CS, Grof CPL, Furbank RT.. 2011. C4 plants as biofuel feedstocks: optimising biomass production and feedstock quality from a lignocellulosic perspective free access. J Integr Plant Biol. 53:120–135. [DOI] [PubMed] [Google Scholar]
- Calviño M, Messing J.. 2012. Sweet sorghum as a model system for bioenergy crops. Curr Opin Biotechnol. 23:323–329. [DOI] [PubMed] [Google Scholar]
- Carpita NC, McCann MC.. 2008. Maize and sorghum: genetic resources for bioenergy grasses. Trends Plant Sci. 13:415–420. [DOI] [PubMed] [Google Scholar]
- Choi SC, Kim JM, Lee YG, Kim C.. 2019. Antioxidant activity and contents of total phenolic compounds and anthocyanins according to grain colour in several varieties of Sorghum bicolor (l.) moench. Cereal Res. Commun. 47:228–238. [Google Scholar]
- Cingolani P, Platts A, Wang LL, Coon M, Nguyen T, et al. 2012. A program for annotating and predicting the effects of single nucleotide polymorphisms, SnpEff: SNPs in the genome of drosophila melanogaster strain w1118; iso-2; iso-3. Fly (Austin). 6:80–92. [DOI] [PMC free article] [PubMed] [Google Scholar]
- Danecek P, Auton A, Abecasis G, Albers CA, Banks E, et al. 2011. The variant call format and VCFtools. Bioinformatics 27:2156–2158. [DOI] [PMC free article] [PubMed] [Google Scholar]
- Deu M, Rattunde F, Chantereau J.. 2006. A global view of genetic diversity in cultivated sorghums using a core collection. Genome 49:168–180. [DOI] [PubMed] [Google Scholar]
- De Wet JMJ, Harlan JR.. 1971. The origin and domestication of Sorghum bicolor. Econ Bot. 25:128–135. [Google Scholar]
- Doebley JF, Gaut BS, Smith BD.. 2006. The molecular genetics of crop domestication. Cell 127:1309–1321. [DOI] [PubMed] [Google Scholar]
- Doggett H. 1987. Sorghum Second Edition. New York, NY: John Wiley & Sons, Inc. [Google Scholar]
- Dykes L, Rooney WL, Rooney LW.. 2013. Evaluation of phenolics and antioxidant activity of black sorghum hybrids. J Cereal Sci. 58:278–283. [Google Scholar]
- Ebadi MR, Sedghi M, Akbari Moghaddam Kakhki R.. 2019. Accurate prediction of nutritional value of sorghum grain using image analysis. Br Poult Sci. 60:154–160. [DOI] [PubMed] [Google Scholar]
- Edwards EJ, Osborne CP, Strömberg CAE, Smith SA, Bond WJ, et al. 2010. The origins of C4 grasslands: integrating evolutionary and ecosystem science. Science 328:587–591. [DOI] [PubMed] [Google Scholar]
- Enciso J, Jifon J, Ribera L, Zapata SD, Ganjegunte GK.. 2015. Yield, water use efficiency and economic analysis of energy sorghum in south Texas. Biomass Bioenergy 81:339–344. [Google Scholar]
- Ermakova M, Danila FR, Furbank RT, von Caemmerer S.. 2020. On the road to C4 rice: advances and perspectives. Plant J. 101:940–950. [DOI] [PMC free article] [PubMed] [Google Scholar]
- Ewels P, Magnusson M, Lundin S, Käller M.. 2016. MultiQC: summarize analysis results for multiple tools and samples in a single report. Bioinformatics 32:3047–3048. [DOI] [PMC free article] [PubMed] [Google Scholar]
- Fernandez MGS, Hamblin MT, Li L, Rooney WL, Tuinstra MR, et al. 2008. Quantitative trait loci analysis of endosperm color and carotenoid content in sorghum grain. Crop Sci. 48:1732–1743. [Google Scholar]
- Flinn B, Dale S, Disharoon A, Kresovich S.. 2020. Comparative analysis of in vitro responses and regeneration between diverse bioenergy sorghum genotypes. Plants 9:248. [DOI] [PMC free article] [PubMed] [Google Scholar]
- Fragoso CA, Moreno M, Wang Z, Heffelfinger C, Arbelaez LJ, et al. 2017. Genetic architecture of a rice nested association mapping population. G3 (Bethesda) 7:1913–1926. [DOI] [PMC free article] [PubMed] [Google Scholar]
- Gardner JC, Maranville JW, Paparozzi ET.. 1994. Nitrogen use efficiency among diverse sorghum cultivars. Crop Sci. 34:728–733. [Google Scholar]
- Glaubitz JC, Casstevens TM, Lu F, Harriman J, Elshire RJ, et al. 2014. TASSEL-GBS: a high capacity genotyping by sequencing analysis pipeline. PLoS ONE 9:e90346. [DOI] [PMC free article] [PubMed] [Google Scholar]
- Goodstein DM, Shu S, Howson R, Neupane R, Hayes RD, et al. 2012. Phytozome: a comparative platform for green plant genomics. Nucleic Acids Res. 40:D1178–D1186. [DOI] [PMC free article] [PubMed] [Google Scholar]
- Guo B, Sleper DA, Beavis WD.. 2010. Nested association mapping for identification of functional markers. Genetics 186:373–383. [DOI] [PMC free article] [PubMed] [Google Scholar]
- Haley CS, Knott SA.. 1992. A simple regression method for mapping quantitative trait loci in line crosses using flanking markers. Heredity (Edinburgh). 69:315–324. [DOI] [PubMed] [Google Scholar]
- Hammer G, McLean G, Doherty A, van Oosterom E, Chapman S.. 2019. Sorghum crop modeling and its utility in agronomy and breeding. Sorghum 58:215–239. [Google Scholar]
- Hartmann H, Bahn M, Carbone M, Richardson AD.. 2020. Plant carbon allocation in a changing world–challenges and progress: introduction to a virtual issue on carbon allocation. New Phytol. 227:981–988. [DOI] [PubMed] [Google Scholar]
- Hu J, Guo C, Wang B, Ye J, Liu M, et al. 2018. Genetic properties of a nested association mapping population constructed with Semi-Winter and spring oilseed rapes. Front Plant Sci. 9:1740. [DOI] [PMC free article] [PubMed] [Google Scholar]
- Hu Z, Olatoye MO, Marla S, Morris GP.. 2019. An integrated Genotyping-by-Sequencing polymorphism map for over 10,000 sorghum genotypes. Plant Genome 12:180044. [DOI] [PubMed] [Google Scholar]
- Huang X, Yang S, Gong J, Zhao Q, Feng Q, et al. 2016. Genomic architecture of heterosis for yield traits in rice. Nature 537:629–633. [DOI] [PubMed] [Google Scholar]
- Hunt CH, Eeuwijk FA, Mace ES, Hayes BJ, Jordan DR.. 2018. Development of genomic prediction in sorghum. Crop Sci. 58:690–700. [Google Scholar]
- Ibraheem F, Gaffoor I, Chopra S.. 2010. Flavonoid phytoalexin-dependent resistance to anthracnose leaf blight requires a functional yellow seed1 in Sorghum bicolor. Genetics 184:915–926. [DOI] [PMC free article] [PubMed] [Google Scholar]
- Irving LJ. 2015. Carbon assimilation, biomass partitioning and productivity in grasses. Collect FAO Agric. 5:1116–1134. [Google Scholar]
- Juliana P, Poland J, Huerta-Espino J, Shrestha S, Crossa J, et al. 2019. Improving grain yield, stress resilience and quality of bread wheat using large-scale genomics. Nat Genet. 51:1530–1539. [DOI] [PubMed] [Google Scholar]
- Kim J-S, Islam-Faridi MN, Klein PE, Stelly DM, Price HJ, et al. 2005. Comprehensive molecular cytogenetic analysis of sorghum genome architecture: distribution of euchromatin, heterochromatin, genes and recombination in comparison to rice. Genetics 171:1963–1976. [DOI] [PMC free article] [PubMed] [Google Scholar]
- Klein RR, Miller FR, Dugas DV, Brown PJ, Burrell AM, et al. 2015. Allelic variants in the PRR37 gene and the human-mediated dispersal and diversification of sorghum. Theor Appl Genet. 128:1669–1683. [DOI] [PubMed] [Google Scholar]
- Klein RR, Mullet JE, Jordan DR, Miller FR, Rooney WL, et al. 2008. The effect of tropical sorghum conversion and inbred development on genome diversity as revealed by high-resolution genotyping. Crop Sci. 48:12. [Google Scholar]
- Kosambi DD. 2016. D.D. Kosambi: The estimation of map distances from recombination values. In: Ramaswamy R., editor. Selected Works in Mathematics and Statistics. New Delhi: Springer India. p. 125–130. [Google Scholar]
- Kresovich S, Miller FR, Monk RL, Dominy RE, Broadhead DM.. 1988. Registration of ‘grassl’ sweet sorghum. Crop Sci. 28:194–195. [Google Scholar]
- Krizek BA, Fletcher JC.. 2005. Molecular mechanisms of flower development: an armchair guide. Nat Rev Genet. 6:688–698. [DOI] [PubMed] [Google Scholar]
- Kurtzer GM, Sochat V, Bauer MW.. 2017. Singularity: Scientific containers for mobility of compute. PLoS ONE 12:e0177459. [DOI] [PMC free article] [PubMed] [Google Scholar]
- Ladejobi O, Elderfield J, Gardner KA, Gaynor RC, Hickey J, et al. 2016. Maximizing the potential of multi-parental crop populations. Appl Transl Genom. 11:9–17. [DOI] [PMC free article] [PubMed] [Google Scholar]
- Lasky JR, Upadhyaya HD, Ramu P, Deshpande S, Hash CT, et al. 2015. Genome-environment associations in sorghum landraces predict adaptive traits. Sci Adv. 1:e1400218. [DOI] [PMC free article] [PubMed] [Google Scholar]
- Lepais O, Weir JT.. 2014. SimRAD: an R package for simulation-based prediction of the number of loci expected in RADseq and similar genotyping by sequencing approaches. Mol Ecol Resour. 14:1314–1321. [DOI] [PubMed] [Google Scholar]
- Li H, Durbin R.. 2010. Fast and accurate long-read alignment with Burrows-Wheeler transform. Bioinformatics 26:589–595. [DOI] [PMC free article] [PubMed] [Google Scholar]
- Lipinsky ES, Kresovich S.. 1980. Sorghums as energy crops. Technical report. OH: Battelle Columbus Labs.
- Mace E, Innes D, Hunt C, Wang X, Tao Y, et al. 2019. The sorghum QTL atlas: a powerful tool for trait dissection, comparative genomics and crop improvement. Theor Appl Genet. 132:751–766. [DOI] [PubMed] [Google Scholar]
- Mace ES, Jordan DR.. 2010. Location of major effect genes in sorghum (Sorghum bicolor (l.) moench). Theor Appl Genet. 121:1339–1356. [DOI] [PubMed] [Google Scholar]
- MacNeill GJ, Mehrpouyan S, Minow MA, Patterson JA, Tetlow IJ, et al. 2017. Starch as a source, starch as a sink: the bifunctional role of starch in carbon allocation. J Exp Bot. 68:4433–4453., [DOI] [PubMed] [Google Scholar]
- Major D, Rood S, Miller F.. 1990. Temperature and photoperiod effects mediated by the sorghum maturity genes. Crop Sci. 30:305–310. [Google Scholar]
- Marla SR, Burow G, Chopra R, Hayes C, Olatoye MO, et al. 2019. Genetic architecture of chilling tolerance in sorghum dissected with a nested association mapping population. G3 Genes Genomes Genetics 9:4045–4057., [DOI] [PMC free article] [PubMed] [Google Scholar]
- Maurer A, Draba V, Jiang Y, Schnaithmann F, Sharma R, et al. 2015. Modelling the genetic architecture of flowering time control in barley through nested association mapping. BMC Genomics 16:290. [DOI] [PMC free article] [PubMed] [Google Scholar]
- McCormick RF, Truong SK, Sreedasyam A, Jenkins J, Shu S, et al. 2018. The Sorghum bicolor reference genome: improved assembly, gene annotations, a transcriptome atlas, and signatures of genome organization. Plant J. 93:338–354. [DOI] [PubMed] [Google Scholar]
- McMullen MD, Kresovich S, Villeda HS, Bradbury P, Li H, et al. 2009. Genetic properties of the maize nested association mapping population. Science 325:737–740. [DOI] [PubMed] [Google Scholar]
- Miao C, Fang J, Li D, Liang P, Zhang X, et al. 2018. Genotype-Corrector: improved genotype calls for genetic mapping in F2 and RIL populations. Sci Rep. 8: [DOI] [PMC free article] [PubMed] [Google Scholar]
- Morris GP, Ramu P, Deshpande SP, Hash CT, Shah T, et al. 2013a. Population genomic and genome-wide association studies of agroclimatic traits in sorghum. Proc Natl Acad Sci USA. 110:453–458. [DOI] [PMC free article] [PubMed] [Google Scholar]
- Morris GP, Rhodes DH, Brenton Z, Ramu P, Thayil VM, et al. 2013b. Dissecting Genome-Wide association signals for Loss-of-Function phenotypes in sorghum flavonoid pigmentation traits. G3 (Bethesda). 3:2085–2094. [DOI] [PMC free article] [PubMed] [Google Scholar]
- Mullet J, Morishige D, McCormick R, Truong S, Hilley J, et al. 2014. Energy sorghum–a genetic model for the design of C4 grass bioenergy crops. J Exp Bot. 65:3479–3489., [DOI] [PubMed] [Google Scholar]
- Murray SC, Rooney WL, Hamblin MT, Mitchell SE, Kresovich S.. 2009. Sweet sorghum genetic diversity and association mapping for brix and height. Plant Genome 2:48–62. [Google Scholar]
- Murray SC, Sharma A, Rooney WL, Klein PE, Mullet JE, et al. 2008. Genetic improvement of sorghum as a biofuel feedstock: I. QTL for stem sugar and grain nonstructural carbohydrates. Crop Sci. 48:2165–2179. [Google Scholar]
- Nadolska-Orczyk A, Rajchel IK, Orczyk W, Gasparis S.. 2017. Major genes determining yield-related traits in wheat and barley. Theor Appl Genet. 130:1081–1098. [DOI] [PMC free article] [PubMed] [Google Scholar]
- Olson SN, Ritter K, Rooney W, Kemanian A, McCarl BA, et al. 2012. High biomass yield energy sorghum: developing a genetic model for C4 grass bioenergy crops. Biofuels Bioprod Bioref. 6:640–655. [Google Scholar]
- Ongom PO, Ejeta G.. 2018. Mating design and genetic structure of a Multi-Parent advanced generation intercross (MAGIC) population of sorghum (Sorghum bicolor (l.) moench). G3 (Bethesda). 8:331–341. [DOI] [PMC free article] [PubMed] [Google Scholar]
- Paterson AH, Bowers JE, Bruggmann R, Dubchak I, Grimwood J, et al. 2009. The Sorghum bicolor genome and the diversification of grasses. Nature 457:551–556. [DOI] [PubMed] [Google Scholar]
- Paterson AH, Schertz KF, Lin Y-R, 1997. Case history in plant domestication: Sorghum, an example of cereal evolution, pp. 187–196. , Molecular Dissection of Complex Traits, edited by Paterson AH and Li Z. CRC Press LLC, Florida. [Google Scholar]
- Pingali P. 2015. Agricultural policy and nutrition outcomes – getting beyond the preoccupation with staple grains. Food Sec. 7:583–591. [Google Scholar]
- Poland JA, Brown PJ, Sorrells ME, Jannink J-L.. 2012. Development of High-Density genetic maps for barley and wheat using a novel Two-Enzyme Genotyping-by-Sequencing approach. PLoS ONE 7:e32253. [DOI] [PMC free article] [PubMed] [Google Scholar]
- Popp M, Nalley L, Fortin C, Smith A, Brye K.. 2011. Estimating net carbon emissions and agricultural response to potential carbon offset policies. Agronomy J. 103:1132–1143. [Google Scholar]
- Purcell S, Neale B, Todd-Brown K, Thomas L, Ferreira MAR, et al. 2007. PLINK: a tool set for whole-genome association and population-based linkage analyses. Am J Hum Genet. 81:559–575., [DOI] [PMC free article] [PubMed] [Google Scholar]
- Quinby JR. 1967. The Maturity Genes of Sorghum. Advances in Agronomy. 19:267–305. [Google Scholar]
- R Core Team 2019. R: A Language and Environment for Statistical Computing. Vienna, Austria: R Foundation for Statistical Computing. [Google Scholar]
- Rhodes DH, Hoffmann L, Rooney WL, Ramu P, Morris GP, et al. 2014. Genome-Wide association study of grain polyphenol concentrations in global sorghum [Sorghum bicolor (l.) moench] germplasm. J Agric Food Chem. 62:10916–10927. [DOI] [PubMed] [Google Scholar]
- Rooney WL, Aydin S.. 1999. Genetic control of a photoperiod-sensitive response in Sorghum bicolor (l.) moench. Crop Sci. 39:397–400. [Google Scholar]
- Rooney WL, Blumenthal J, Bean B, Mullet JE.. 2007. Designing sorghum as a dedicated bioenergy feedstock. Biofuels, Bioprod Bioref. 1:147–157. [Google Scholar]
- Saballos A. 2008. Development and utilization of sorghum as a bioenergy crop. In: Vermerris W, editor. Genetic Improvement of Bioenergy Crops. New York, NY: Springer New York. p. 211–248. [Google Scholar]
- Sage RF, Monson RK.. 1998. C4 Plant Biology. Elsevier, San Diego, California. [Google Scholar]
- Sage RF, Zhu X-G.. 2011. Exploiting the engine of C4 photosynthesis. J Exp Bot. 62:2989–3000. [DOI] [PubMed] [Google Scholar]
- Sapkota S, Boyles R, Cooper E, Brenton Z, Myers M, et al. 2020. Impact of sorghum racial structure and diversity on genomic prediction of grain yield components. Crop Sci. 60:132–148, [Google Scholar]
- Sedghi M, Golian A, Soleimani-Roodi P, Ahmadi A, Aami-Azghadi M.. 2012. Relationship between color and tannin content in sorghum grain: application of image analysis and artificial neural network. Rev Bras Cienc Avic. 14:57–62. [Google Scholar]
- Slewinski TL. 2012. Non-structural carbohydrate partitioning in grass stems: a target to increase yield stability, stress tolerance, and biofuel production. J Exp Bot. 63:4647–4670. [DOI] [PubMed] [Google Scholar]
- Smith O, Nicholson WV, Kistler L, Mace E, Clapham A, et al. 2019. A domestication history of dynamic adaptation and genomic deterioration in sorghum. Nat Plants 5:369–379. [DOI] [PubMed] [Google Scholar]
- Stich B. 2009. Comparison of mating designs for establishing nested association mapping populations in maize and Arabidopsis thaliana. Genetics 183:1525–1534. [DOI] [PMC free article] [PubMed] [Google Scholar]
- Subramanian V, Eswara Prasada Rao K, Mengesha MH, Jambunathan R.. 1987. Total sugar content in sorghum stalks and grains of selected cultivars from the world germplasm collection. J Sci Food Agric. 39:289–295. [Google Scholar]
- Thurber CS, Ma JM, Higgins RH, Brown PJ.. 2013. Retrospective genomic analysis of sorghum adaptation to temperate-zone grain production. Genome Biol. 14:R68. [DOI] [PMC free article] [PubMed] [Google Scholar]
- van der Weijde T, Alvim Kamei CL, Torres AF, Vermerris W, Dolstra O, et al. 2013. The potential of C4 grasses for cellulosic biofuel production. Front Plant Sci. 4:107. [DOI] [PMC free article] [PubMed] [Google Scholar]
- Van Rossum G, Drake FL.. 2009. Introduction to Python 3: (Python Documentation Manual Part 1). CreateSpace Independent Publishing Platform, Scotts Valley, California.
- Vinall HN, Martin JH, Stephens JC.. 1936. Identification, history, and distribution of common sorghum varieties. U.S. Dept. of Agriculture, Technical Bulletin No.506, Washington, D. C.
- Vogel J. 2008. Unique aspects of the grass cell wall. Curr Opin Plant Biol. 11:301–307. [DOI] [PubMed] [Google Scholar]
- Wall JS, Blessin CW.. 1970. Composition of sorghum plant and grain. Sorghum Production and Utilization. AVI Publishers, Westport, Connecticut. [Google Scholar]
- Wallace JG, Rodgers-Melnick E, Buckler ES.. 2018. On the road to breeding 4.0: Unraveling the good, the bad, and the boring of crop quantitative genomics. Annu Rev Genet. 52:421–444. [DOI] [PubMed] [Google Scholar]
- Wang X, Hunt C, Cruickshank A, Mace E, Hammer G, et al. 2020. The impacts of flowering time and tillering on grain yield of sorghum hybrids across diverse environments. Agronomy 10:135. [Google Scholar]
- Waskom M, Botvinnik O, O’Kane D, Hobson P, Lukauskas S, et al. 2017. mwaskom/seaborn: v0.8.1
- Wu X, Staggenborg S, Propheter JL, Rooney WL, Yu J, et al. 2010. Features of sweet sorghum juice and their performance in ethanol fermentation. Industrial Crops Products 31:164–170. [Google Scholar]
- Wu Y, Guo T, Mu Q, Wang J, Li X, et al. 2019. Allelochemicals targeted to balance competing selections in African agroecosystems. Nat Plants 5:1229–1236. [DOI] [PubMed] [Google Scholar]
- Wu Y, Li X, Xiang W, Zhu C, Lin Z, et al. 2012. Presence of tannins in sorghum grains is conditioned by different natural alleles of tannin1. Proc Natl Acad Sci USA. 109:10281–10286. [DOI] [PMC free article] [PubMed] [Google Scholar]
- Xin Z, Wang ML, Barkley NA, Burow G, Franks C, et al. 2008. Applying genotyping (TILLING) and phenotyping analyses to elucidate gene function in a chemically induced sorghum mutant population. BMC Plant Biol. 8:103. [DOI] [PMC free article] [PubMed] [Google Scholar]
- Yu J, Buckler ES.. 2006. Genetic association mapping and genome organization of maize. Curr Opin Biotechnol. 17:155–160. [DOI] [PubMed] [Google Scholar]
- Yu J, Holland JB, McMullen MD, Buckler ES.. 2008. Genetic design and statistical power of nested association mapping in maize. Genetics 178:539–551. [DOI] [PMC free article] [PubMed] [Google Scholar]
- Zhang C, Dong S-S, Xu J-Y, He W-M, Yang T-L.. 2019. PopLDdecay: a fast and effective tool for linkage disequilibrium decay analysis based on variant call format files. Bioinformatics 35:1786–1788. [DOI] [PubMed] [Google Scholar]
- Zhang D, Kong W, Robertson J, Goff VH, Epps E, et al. 2015. Genetic analysis of inflorescence and plant height components in sorghum (panicoidae) and comparative genetics with rice (oryzoidae). BMC Plant Biol. 15:107. [DOI] [PMC free article] [PubMed] [Google Scholar]
- Zhao YL, Dolat A, Steinberger Y, Wang X, Osman A, et al. 2009. Biomass yield and changes in chemical composition of sweet sorghum cultivars grown for biofuel. Field Crops Res. 111:55–64. [Google Scholar]
- Zheng X, Levine D, Shen J, Gogarten SM, Laurie C, et al. 2012. A high-performance computing toolset for relatedness and principal component analysis of SNP data. Bioinformatics 28:3326–3328. [DOI] [PMC free article] [PubMed] [Google Scholar]
- Zhou X, Stephens M.. 2014. Efficient multivariate linear mixed model algorithms for genome-wide association studies. Nat Methods 11:407–409. [DOI] [PMC free article] [PubMed] [Google Scholar]
Associated Data
This section collects any data citations, data availability statements, or supplementary materials included in this article.
Data Availability Statement
Raw GBS data are available at the European Nucleotide Archive under the project accession PRJEB40592. The Tx430 NAM data were accessed from dryad at doi: 10.5061/dryad.63h8fd4 (Hu et al. 2019). Scripts are available on GitHub (https://github.com/jlboat/CP-NAM) under MIT License. Code freezes are available for BWA and PopLDdecay via Singularity containers (Kurtzer et al. 2017) and were executed using Singularity version 3.5.3. Containers may be directly pulled from SingularityHub: https://singularity-hub.org/collections/2877. Supplemental materials available at figshare: https://figshare.com/s/0ba752156d0cb7fb6404. CP-NAM seeds are available upon request.