

Abstract
Organophosphate esters (OPEs) have been detected within car interior dust, suggesting that the indoor microenvironment of vehicles may represent a potential route of human exposure to OPEs. We recently showed that people with longer commutes are exposed to higher concentrations of tris(1,3-dichloro-2-isopropyl)phosphate (TDCIPP) – a widely used OPE – and other studies have suggested that dust removal may lead to lower exposure to chemicals. Therefore, the overall objective of this study was to determine if a decrease in interior car dust results in mitigation of personal OPE exposure. Participants (N = 49) were asked to wear silicone wristbands, and a subset of them wiped interior parts at the front of their vehicles prior to one study week (N = 25) or both study weeks (N = 11). There were no significant differences in total OPE concentrations (77.79–13,660 ng/g) nor individual OPE concentrations (0.04–4852.81 ng/g) across the different wiping groups nor in relation to participant residence ZIP codes and AC/Heater usage. These findings suggest that higher exposure to TDCIPP for participants with longer commutes may be independent of dust located on interior parts at the front of the vehicle. Therefore, our study demonstrates that there is a need for research on the potential contribution of other sources of TDCIPP exposure within car interiors.
Keywords: Organophosphate esters, Silicone wristband, TDCIPP, Car interiors, Dust
1. Introduction
The American Community Survey (ACS) by the US Census Bureau reported that approximately 87% of Americans use their personal vehicles to commute to work, and studies have shown that higher commute times are associated with urban population density (Zhu et al., 2017). While the average American spends 53 min commuting per day, areas with higher population density – such as New Jersey, Massachusetts, Maryland, New York, and California – experience commute times of at least 60 min per day (U.S Census Bureau). Therefore, a large part of the American population spends a significant amount of time within their vehicles, potentially spanning over many years.
The interior of a personal vehicle is an indoor microenvironment and, due to its limited space, chemicals emitted from the interior of a vehicle have the potential to be concentrated (Faber and Brodzik, 2017). Indeed, volatile organic compounds, flame retardants, perfluoroalkyl compounds, phthalates, particulate matter, organochlorines, polychlorinated biphenyls, polycyclic aromatic hydrocarbons, and nicotine (Chien, 2007; Geiss et al., 2009; Goosey and Harrad, 2011; Stuart et al., 2008; Zulauf et al., 2019; Ali et al., 2013, 2021) have been detected in car interior air and dust, suggesting that people who spend a large amount of time in their vehicles may be exposed to elevated concentrations of these contaminants relative to non-commuters. Although the use of chemicals in products, including vehicles, is regulated by the Toxic Substances Control Act (TSCA) in the United States, the release of chemicals from vehicle parts and subsequent impact on air quality within car interiors are not monitored nor regulated. Furthermore, while the US Environmental Protection Agency (EPA) and Occupational Safety and Health Administration (OSHA) regulate outdoor (ambient) air quality and indoor air quality within the workplace, respectively, vehicles are, similar to residences, considered personal space and lack regulations controlling indoor air quality (US EPA; WHO, 2010). As a result, there is a large gap in our knowledge about personal exposure within vehicles and more research is needed to measure human exposure to chemicals within indoor microenvironments of car interiors.
Silicone wristbands have been used as passive samplers to measure exposure to chemicals within indoor environments (Hammel et al., 2016; Levasseur et al., 2021) and have shown to be positively correlated with both hand wipes and active air samplers (Hammel et al., 2020; Wang et al., 2019). As wristband chemical levels correlate well with both urinary and serum biomarkers, wristbands enable assessment of both inhalation and dermal routes of exposure and, as such, are useful for measuring human exposure to chemicals via air and dust (Hammel et al., 2016, 2018). This is particularly relevant for semi-volatile organic compounds (SVOCs) that readily partition from the gas phase to particulates (e.g., dust and airborne particles) and vice versa, contributing to persistence within the indoor environment (Adamkiewicz et al., 2011). Organophosphate esters (OPEs) represent a class of SVOCs that are used as flame retardants to meet Federal Motor Vehicle Safety Standard (FMVSS) No. 302 – a vehicle-specific federal flammability standard – and, as a result, are frequently detected within car interior dust (Abdallah and Covaci, 2014; Ali et al., 2013; Brandsma et al., 2014; Brommer et al., 2012; Harrad et al., 2016). As a result, OPE concentrations within indoor dust are consistently lower than OPE concentrations detected within car interior dust (Abdallah and Covaci, 2014; Ali et al., 2013; Brandsma et al., 2014; Brommer et al., 2012; Brommer and Harrad, 2015; Carignan et al., 2013; Harrad et al., 2016; Zhou et al., 2017). A number of studies have also found that OPEs may induce carcinogenesis, neurotoxicity, endocrine disruption, and developmental/reproductive toxicity (Behl et al., 2015; Farhat et al., 2014; McGee et al., 2013; Moser et al., 2015; van der Veen and de Boer, 2012). As such, there is increasing concern regarding elevated exposure to OPEs as a function of spending longer times within a vehicle.
Previously, we showed that longer commutes are associated with increased human exposure to tris(1,3-dichloro-2-isopropyl)phosphate (TDCIPP), a widely used OPE that is carcinogenic and listed on California’s Proposition 65 list. However, to our knowledge, no studies have evaluated the contribution of interior car dust to personal OPE exposure. As removal of dust within indoor environments may lead to lower exposure to chemicals (Dixon et al., 1999; Gibson et al., 2019; Roberts et al., 2009), the US EPA recommends wiping and vacuuming the interior of cars to reduce personal OPE exposure (EPA, 2016). Therefore, the overall objective of this study was to 1) characterize the potential contribution of interior car dust to personal OPE exposure using silicone wristbands and 2) determine if a decrease in interior car dust results in mitigation of personal OPE exposure (including TDCIPP) for participants who spend a significant amount of time in their personal vehicles.
2. Materials and methods
2.1. Study design
Study participants (N = 49) were recruited in January and February 2020 from the University of California, Riverside. Participants were eligible for the study if they 1) were at least 19 years old; 2) commuted between one to 2 h roundtrip to campus using their personal vehicle; 3) did not use other forms of transportation to commute to campus; 4) were willing to wear a silicone wristband continuously for two separate fiveday durations; and 5) were willing to complete ten 1-min online questionnaires. All study protocols and materials used for this study were approved by UCR’s Institutional Review Board (IRB Number: HS-19–309), and each participant provided informed consent prior to enrolling in the study.
Once participants enrolled in the study, they were distributed across four groups that determined when the participants wiped their car interiors. The participants were distributed to ensure limited demographic, vehicle, and commuting variability across the different study groups. The participants were instructed to use 10 wipes to clean the dashboard cover, air vents, steering wheel, instrument panel, wiper switch/turn signal, temperature and radio controls, outside the glove compartment, and gear shift according to a “wiping checklist” (Table S1), and participants were provided with one pack of identical Armor-All Cleaning Wipes (20/participant). Participants were only asked to wipe interior parts at the front of the vehicle rather than wipe and vacuum the remaining parts of the vehicle interior (e.g., car seats, windows, carpet, etc.) since 1) wristbands were expected to be in close proximity to dust at the front of the vehicle during both study weeks and 2) our objective was to streamline and standardize a wiping protocol rather than asking study participants to clean and vacuum the entire vehicle interior once or twice within a two-week study period. Participants within Group 1 did not wipe for both weeks; participants within Group 2 did not wipe the first week but did wipe the second week; participants within Group 3 wiped the first week but not the second week; and participants within Group 4 wiped for both weeks. As the study ran from Saturday to Wednesday for both weeks, Groups 2–4 participants wiped their car interior only once on the Friday before initiation of study Week 1 and/or 2 and not during the entire duration of the study.
2.2. Wristband collection
Green wristbands were purchased as a single size from 24HourWristbands.Com (https://24hourwristbands.com/) (Houston, TX, USA) and, using previously described procedures (Hammel et al., 2016; Reddam et al., 2020), wristbands were solvent-cleaned with multiple Soxhlet extractions before being wrapped in combusted aluminum foil and placed in Ziploc bags (one wristband per bag). Participants were asked to wear wristbands continuously for a 5-d period, including during bathing, sleeping, and other daily activities, for two consecutive weeks (one wristband per week per participant). Participants were asked to wear the wristbands continuously in order to mimic dermal exposure to OPEs. At the end of each week, participants re-wrapped their wristband in aluminum foil, and then placed the wrapped wristband in the originally provided Ziploc bag. Six cleaned wristbands were used as field blanks to account for potential OPEs present within wristbands as well as OPE exposure during shipping and handling. Field blanks were un-wrapped once for 30 s at room temperature on the third floor of the Science Laboratories 1 Building at UCR, and then re-wrapped with the same aluminum foil. Participant wristbands and field blanks were stored at −20 °C until overnight shipment on dry ice to Duke University (Durham, NC, USA) for extraction and analysis.
2.3. Questionnaires and calculation of commute and ventilation scores
Study participants completed an initial recruitment survey. In this survey, participants were asked to provide demographic information (age, gender, ethnicity, residence ZIP codes, and household income), commuting information (length of commute and method of commuting), and personal vehicle information (upholstery material, year, mileage, make and model of car and time of last car interior cleaning) (Table S2). During the study, participants completed ten short online surveys (one daily survey, resulting in five daily surveys per study week). Participants were asked how long they drove their vehicle; if they were the passenger or the driver; if they used any other forms of transportation; and if they used the AC/heater (and, if so, for how long) within their car.
The amount of time a participant spent in a mode of transportation was used to calculate their total commute score. Each time bracket was assigned a daily commute score: <30 min was assigned 1; 30–60 min was assigned 2; 60–90 min, 90–120 min and 120–180 min were assigned 3; and >180 min was assigned 4.60–90 min, 90–120 min and 120–180 min were all assigned 3 in order to ensure that calculation of the commute score was consistent with our previously conducted study (Reddam et al., 2020). Daily commute scores were then summed to obtain the total commute score for each participant. The amount of time a participant used the AC/heater was used to calculate their total ventilation score. Similar to total commute score, each time bracket was assigned a daily ventilation score: no AC/heater use was assigned 0; <30 min was assigned 1; 30–60 min was assigned 2; 60–180 min was assigned 3; and >180 min was assigned 4. The daily ventilation scores were then summed to obtain the total ventilation score for each participant.
2.4. Extraction and analysis of OPEs from wristbands
Wristbands were extracted and analyzed using previously described protocols (Reddam et al., 2020). Briefly, wristbands were cut into ~1-in fragments and the mass of each sample was recorded (~0.8 g per wristband). The wristband fragments were transferred to a clean glass centrifuge tube. Wristband fragments were then spiked with isotopically-labelled internal standards, and extracted via sonication in 10 mL of a 50:50 (v:v) mixture of hexane:dichloromethane for 15 min. The extraction was repeated three times and extracts were combined. Each sample extract was concentrated to ~1.0 mL using purified nitrogen gas prior to column chromatography. Extracts were then purified using 8 g of water deactived 100–200 mesh Acros Organics Florisil (Thermo Fisher Scientific, Waltham, MA, USA). An F1 fraction (40 mL hexane) and F2 fraction (40 mL ethyl acetate) were eluted and collected, and the F1 and F2 extracts were combined and concentrated to 1 mL. Samples were then concentrated to near dryness, reconstituted in 1 mL of hexane, and spiked with an additional set of isotopically labelled standards prior to mass spectrometry analysis in order to measure recovery of internal standards (Tables S3 and S4).
All samples were analyzed for organophosphate esters using a Q Exactive GC hybrid quadrupole-Orbitrap GC-MS/MS system (Thermo Fisher Scientific, Waltham, MA, USA). The QE-GC was equipped with a TraceGOLD TG-5HT GC Column capillary column (30 m × 0.25 mm ID,0.25 μm film thicknesses) (Thermo Fisher Scientific, Waltham, MA, USA) with helium as the carrier gas flowing at 1.3 mL/min. The Programmable Temperature Vaporizer (PTV) Inlet was operated in Split injection mode with a 1 μL injection and a split ratio of 10. The GC oven temperature program was 80 °C for 2 min, 80–250 °C at 20 °C/min, 250–260 °C at 1.5 °C/min, 260–300 °C at 25 °C/min, hold at 300 °C for 12 min, 300–320 °C at 25 °C/min, and a final hold for 15 min (total run time = 47 min). For this analysis, the QE-GC was operated in full scan Electron Ionization (EI) mode with an automatic gain control (AQC) of 1e6, a maximum IT of 200 ms, and a mass resolution of 60,000 (at m/z 200). Samples were run with a scan range of 35–750 m/z from 4 to 30 min (i.e., turned off before final oven ramp) and quantified using the Tracefinder software.
Field blanks (solvent-cleaned wristbands; N = 6) and lab blanks (solvent; N = 5) were processed and analyzed with each batch of wristbands for quality assurance and quality control. No significant differences were detected between field and lab blanks; therefore, field blanks were used to estimate method detection limits (MDLs). MDLs were calculated using three times the standard deviation of the field blank responses, or a value equal to ten times the signal-to-noise (i.e., the instrument detection limit) if the analyte was not detected in the field blanks. MDLs for all target OPEs are available in the supporting information (Table S5) and were generally at or below 3 ng/g for OPEs with the exception of TCIPP and EHDPP. Recoveries for all OPE surrogate standards are reported in Table S5.1, and the average across all OPE surrogate standards was 91.5 ± 15.5% (median: 92.3%). Each analyte concentration (in ng of analyte per g wristband) was calculated with a five-point calibration curve and an appropriately isotopically labelled standard. All target analytes had linearity (R2) >0.93 with a majority >0.99. All samples were recovery-corrected and blank-subtracted.
2.5. Statistical analyses
A general linear model (GLM) and Tukey’s post-hoc test (α = 0.05) was performed using RStudio (PBC, Boston, MA, https://www.rstudio.com) to identify significant differences among study groups/weeks and demographic data (age, gender, ethnicity, or household income), commuting information (length of commute and commute score), or personal vehicle information (upholstery material, mileage, and last car interior cleaning). As OPE concentrations across all participant wristbands displayed a log-normal distribution, a heat map based on log10- transformed concentrations for all OPEs was generated within Morpheus (Broad Institute, Cambridge, MA, USA), and hierarchical clustering was performed using the Euclidean distance and complete linkage method for the rows. Using RStudio, a GLM and Tukey’s post-hoc test (α = 0.05) were performed to determine if there was a significant difference in OPE concentrations for compounds having a detection frequency greater than 70% among study groups and weeks, and if wiping interior parts at the front of the vehicle resulted in a significant effect on personal exposure. Furthermore, all participants were pooled into either a wipe or no-wipe group to enhance statistical power, and a GLM and Tukey’s post-hoc test (α = 0.05) were used to determine if there was an overall effect of wiping on total OPE concentrations and individual OPE concentrations.
ArcGIS (Esri, Redlands, CA, USA) was used to generate maps with concentrations of total OPEs and TDCIPP in Weeks 1 and 2 in relation to the participants’ residence ZIP code. Furthermore, for compounds with a detection frequency greater than 70% (67 wristbands total), GLM and Tukey’s post-hoc test (α = 0.001) were performed to identify significant differences between total (Week 1 + Week 2) OPE concentrations and personal vehicle information (upholstery material, mileage, year of car, and last car interior cleaning). A lower p-value (α = 0.001) was used to account for false positives as a result of multiple comparisons. Participants (N = 3) who did not turn in their Week 2 wristbands were excluded from this analysis. Lastly, GLM (α = 0.001) was performed within RStudio to determine whether total ventilation scores were predictive of log10-transformed concentrations for OPEs detected on at least 67 wristbands (70% detection rate).
3. Results and discussion
3.1. Participant demographics and commuting characteristics are consistent across different groups
Demographic data and car characteristics for all study participants are presented in Table S2. Participants were divided among the different intervention groups in a manner that minimized differences in participant demographics (Fig. 1A–D), commute time (Fig. 1E), and car characteristics (Fig. 1F–H) between groups (Table S6). In addition, mapping of participant’s residence ZIP codes within ArcGIS revealed that there were no groups clustered in a particular area of Southern California (Fig. 2A).
Fig. 1.

Distribution of demographics and car characteristics of study participants in Group 1 (N = 13), Group 2 (N = 13), Group 3 (N = 12) and Group 4 (N = 11) by age (A), gender (B), ethnicity (C), household income (D), commute to campus (E), miles on car (F), last interior cleaning (G) and upholstery material (H). Group 1 = no wipe in Week 1 + no wipe in Week 2; Group 2 = no wipe in Week 1 + wipe in Week 2; Group 3 = wipe in Week 1 + no wipe in Week 2; Group 4 = wipe in Week 1 + wipe in Week 2.
Fig. 2.

Distribution of study participants across Southern California (A). Total commute score of study participants grouped by different study groups and weeks. Asterisk (*) denotes significant difference (p < 0.05) between participants in Groups 1 and 4 in Week 2.
The total commute score was calculated based on the amount of time the participant spent in their personal vehicle for the duration of the study (Tables S7.1 and S7.2). One of the eligibility criteria was that participants commuted between 1 and 2 h roundtrip to campus. Therefore, the range of commute times was intentionally narrowed to a subset of the commuter population to ensure that commute scores of study participants did not significantly vary across the study groups and weeks (Table S6). However, there was a significant difference in the average commute score of participants in Group 1 vs. Group 4 during the second week of the study (Fig. 2B). This may have been a result of participants using their vehicles for purposes other than commuting to campus, resulting in varied commute scores between these two groups within Week 2 only. Therefore, future studies should consider providing two wristbands per participant, one of which is used only in the vehicle when commuting and the other to be worn at all the times.
3.2. OPE concentrations did not significantly vary as a function of wiping, demographics, and car characteristics
Descriptive statistics for all OPEs measured on study participant wristbands are provided within Table S5 and summarized within Fig. 3A. Several OPEs had a 90% or higher detection rate within the participant wristbands. 2IPPDPP, 3IPPDPP and 4IPPDPP – all isopropylated triaryl phosphate (ITP) isomers – had an average detection rate of 96.9%, 94.6%, and 98.9%, respectively. These three isomers (particularly 2IPPDPP) are commonly detected in Firemaster 550 (FM550) (Phillips et al., 2017). Similarly, 4tBPDPP and B4tBPPP (detection rates of 100% and 95.7%, respectively) are tetrabromobisphenol (TBBP) isomers commonly detected in Firemaster 600 (FM600) (Phillips et al., 2017). Both FM550 and FM600 are flame retardant mixtures that became widely used in furniture after polybrominated diphenyl ether (PBDE) flame retardants were phased out due to toxicity concerns (Stapleton et al., 2012). Therefore, the high detection rates of ITP and TBBP isomers may be a result of their ubiquitous presence in indoor dust.
Fig. 3.
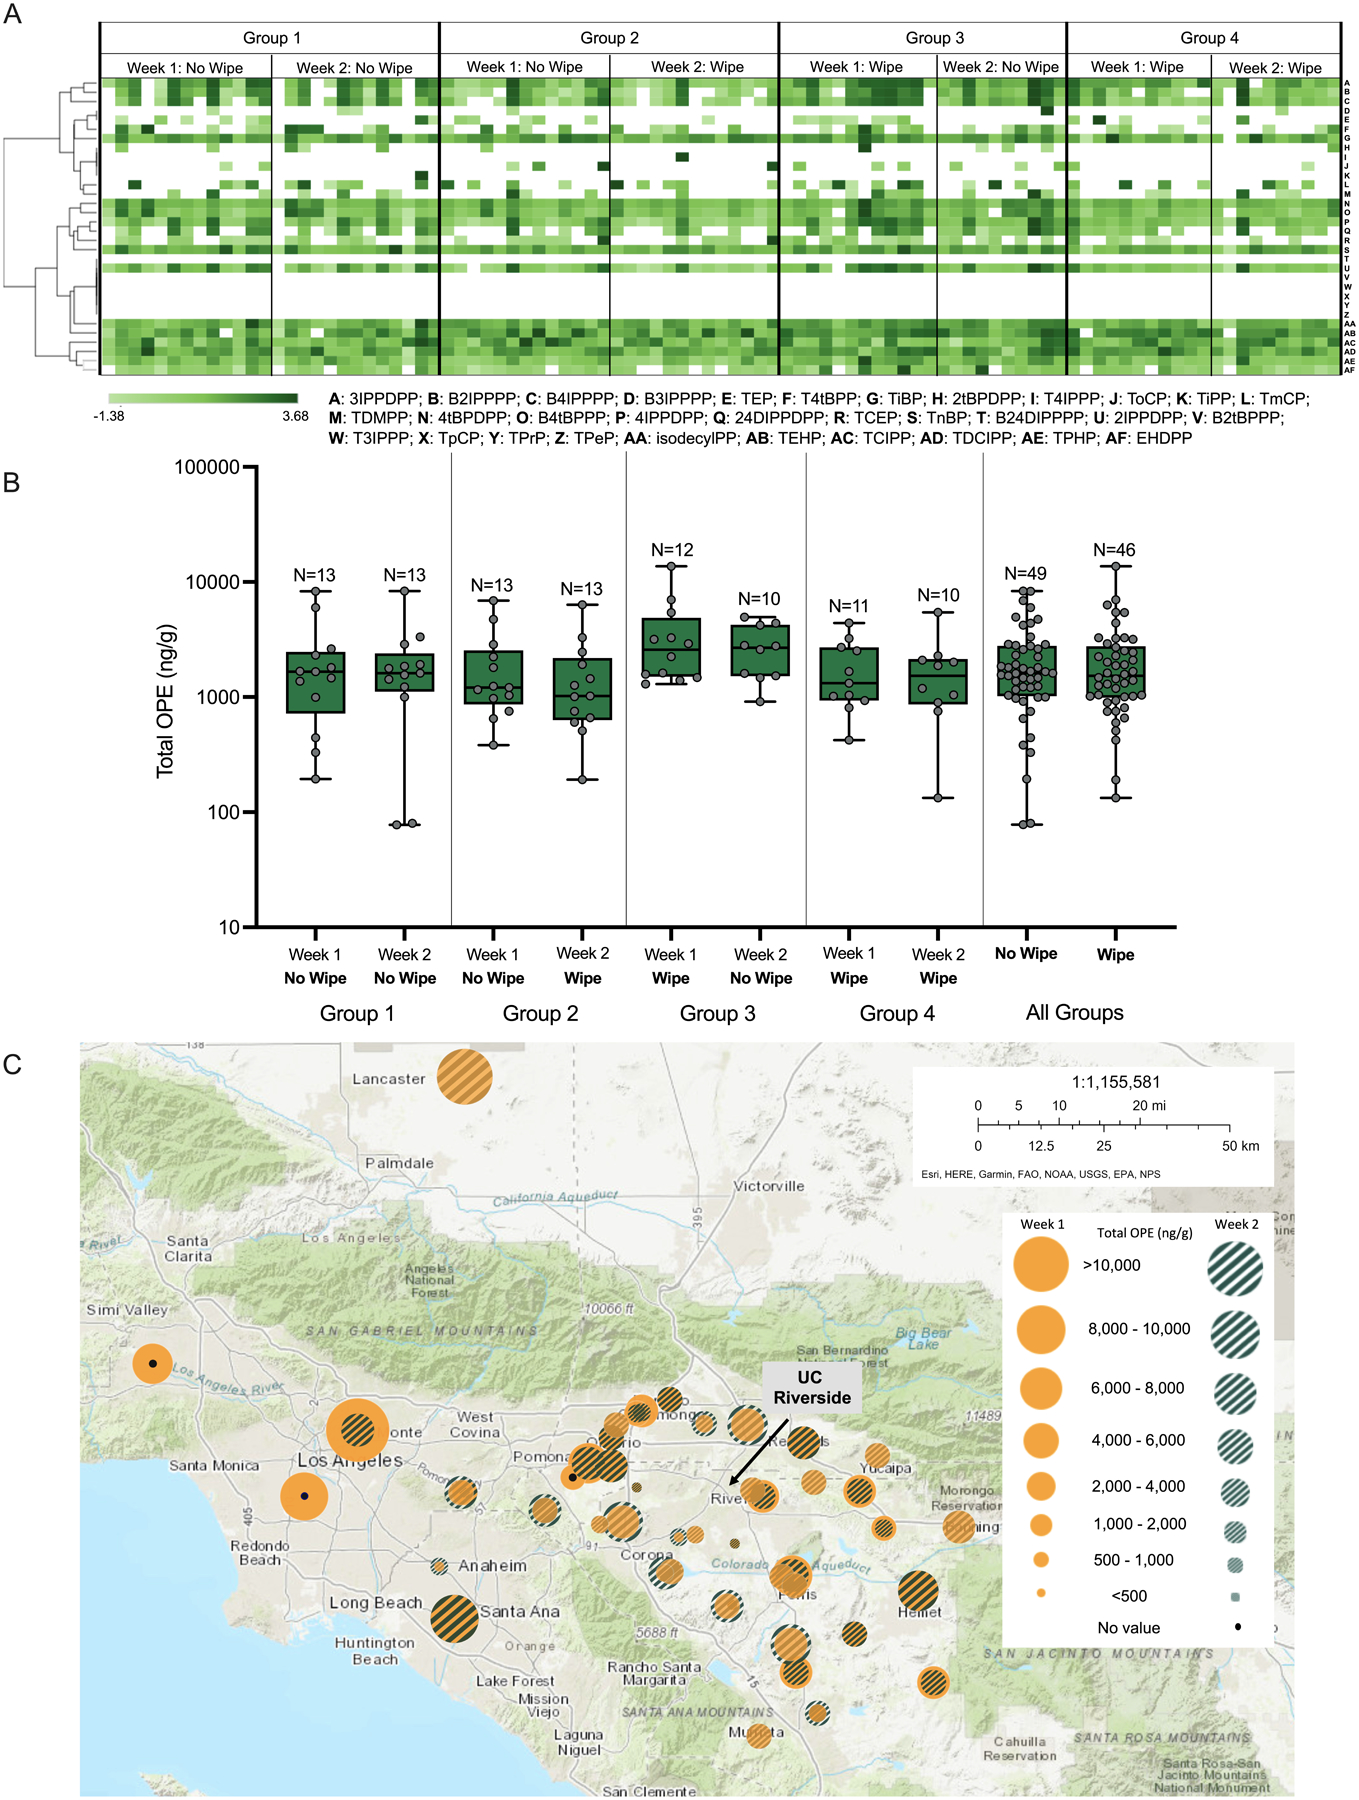
Heat map representing wristband concentrations of individual OPEs vs. different study groups (A). OPE concentration data shown within the heat map were log10-transformed, and hierarchical clustering was performed using the Euclidean distance and complete linkage method. Total concentration of all OPEs for each participant divided by different study groups and wiping intervention (B) and by location of participants’ residence ZIP code (C).
Triphenyl phosphate (TPHP, 100% detection rate) is used as a plasticizer in polyvinyl chloride (PVC), cellulosic polymers, thermo-plastic matrices, and synthetic rubbers as well as a flame retardant in Firemaster 550 (FM550); as a result, TPHP is widely detected in indoor dust samples (Stapleton et al., 2009; van der Veen and de Boer, 2012). TDCIPP (100% detection rate) is a commonly used flame retardant and was also used to as a PBDE replacement. Furthermore, TDCIPP and tris (1-chloro-2-isopropyl)phosphate (TCIPP, 100% detection rate) provide a substantial contribution to total OPEs within car interior dust, and these two compounds are widely used in polyurethane foam and the upholstery of permanently installed car seats (Stapleton et al., 2009). The high detection rate for all these OPEs across both weeks suggests that participants within our cohort experienced persistent exposure to these compounds within their vehicles and/or other indoor environments.
Although total OPE concentrations across all participants ranged from 194 to 13,573 ng/g in Week 1 and 78 to 8219 ng/g in Week 2, the total concentration of all OPEs did not significantly vary by group nor week (Fig. 3B). Furthermore, none of the individual OPEs were significantly different across the different groups and weeks (Table S8), suggesting that wiping interior parts at the front of the vehicle did not affect OPE concentrations. In order to determine if there were any trends associated with participant residence ZIP code and total OPE concentration, an ArcGIS map was generated to assess whether location was associated with total OPE concentration (Fig. 3C). While some participants who drove longer distances tended to have higher concentrations of OPEs on their wristbands, there were no significant differences between commute score and total OPE concentration for all participants regardless of group (Table S9). Therefore, higher total OPE concentrations for people who live further away may have been attributed to other OPE sources such as indoor dust or air derived from the home or workplace.
As there were no significant differences in OPE concentrations across study groups, we performed correlations to identify potential trends between OPE concentrations and car characteristics. There were no significant differences between total nor individual OPE concentrations (Fig. 4; Table S9) and vehicle mileage, time of last cleaning, upholstery material, and year of the car. These results are consistent with other studies that found no significant differences in OPE concentration in vehicular dust relative to age of car (Abdallah and Covaci, 2014; Brommer and Harrad, 2015; Christia et al., 2018) and upholstery material (Christia et al., 2018). Brommer et al. (2012) found that the most dominant OPE in samples was correlated with mileage since last cleaning; however, this correlation was only positive for the most contaminated samples in each case and the inclusion of all samples resulted in an insignificant relationship (Brommer et al., 2012).
Fig. 4.

Total OPE concentrations for each participant distributed by mileage (A), time since last car interior cleaning (B) and upholstery material (C). Total OPE concentration as a function of year of the car (D).
Among all participants, wristbands derived from two participants driving/riding within a 2005 Toyota Corolla and 2016 Mazda CX-5 had the highest total OPE concentrations (16,428 and 16,150 ng/g, respectively). However, without additional replication, we are unable to draw any conclusions about the potential relationship between car make/ model and OPE concentrations detected on wristbands. Furthermore, we found different total OPE concentrations in cases where two vehicles had the same make, model and year. Specifically, we found that wristbands derived from two participants driving/riding within a 2017 Honda Civic had total OPE concentrations of 1710 and 3465 ng/g, and wristbands derived from two participants driving/riding within a 2005 Toyota Matrix had total OPE concentrations of 9186 and 2037 ng/g. Therefore, there does not appear to be an influence of vehicle manufacturer on total OPE concentrations.
3.3. TDCIPP concentrations did not significantly vary as a function of wiping, residence ZIP code nor ventilation
Using a different participant cohort, we previously found that higher TDCIPP concentrations on participant wristbands were associated with longer commutes (Reddam et al., 2020). As SVOCs released from end-use products are equilibrated among the gas phase and particulates (surface dust and airborne particles) (Weschler and Nazaroff, 2012), elevated concentrations of TDCIPP detected within wristbands may be due to 1) airborne TDCIPP directly released from vehicle parts, 2) TDCIPP partitioning from air to car interior dust after being released from vehicle parts, and/or 3) movement of TDCIPP from outdoor air through a vehicle’s ventilation system. However, we expect that the latter scenario is unlikely since the concentration of TDCIPP within outdoor air is typically orders of magnitude lower than the concentration within indoor air (Zhou et al., 2017). Although prior studies have primarily detected OPEs within car interior dust (Abdallah and Covaci, 2014; Brommer et al., 2012; Harrad et al., 2016; Tokumura et al., 2017), there was no significant difference in wristband TDCIPP concentrations among the different wiping groups (Fig. 5A) despite concentrations being higher than those of non-commuters (Fig. 5B) (Reddam et al., 2020). Moreover, when all no-wipe and wipe data were pooled to enhance statistical power, we detected no significance difference in TDCIPP concentrations between these two groups (Fig. 5A, Table S8).
Fig. 5.

TDCIPP concentration for each participant divided by different study groups and wiping intervention where the grey dotted line represents the average TDCIPP concentration for non-commuters based on Reddam et al. (2020) (A). TDCIPP concentrations as a function of total commute score from participants from the current study vs. Reddam et al. (2020) (B). Week 1 and 2 TDCIPP concentrations in relation to the location of participants’ residence ZIP code (C) and as a function of ventilation score (D and E).
The commute score and respective TDCIPP concentrations of the current study agree with our previous study (Fig. 5B). However, due to one of the eligibility criteria for this study (i.e., all participants commuted between 1 and 2 h roundtrip to campus), there was no significant difference between commute score and TDCIPP concentrations within this study. Moreover, similar to total OPE concentrations, there were no apparent trends in TDCIPP concentrations and residence ZIP codes of participants (Fig. 5C). Despite dust removal from interior parts at the front of the vehicle, continued exposure to TDCIPP suggests that the correlation between TDCIPP exposure and longer commutes within our previous study may have been attributed to other sources of TDCIPP within the vehicle. We also calculated ventilation scores (Tables S10.1 and S10.2) to identify the potential contribution of air circulation to TDCIPP exposure. Some studies have shown that the presence of recirculation air conditioners reduces the concentration of airborne contaminants within vehicles by improving ventilation rate and filtering efficiency (Chan et al., 1991; Riediker et al., 2003; Wu et al., 2013). However, we did not find a significant difference between any of the OPEs (including TDCIPP) on participant wristbands and ventilation scores (Fig. 5D and E; Table S11), suggesting that TDCIPP exposure within car interiors may be independent of ventilation within vehicles. Indeed, studies have shown that SVOCs persist for longer durations within the indoor environment if the only removal mechanism is ventilation (Weschler and Nazaroff, 2012).
As TDCIPP is an SVOC, it has the potential to partition from vehicle parts directly into wristbands via car interior air. A limited number of studies have measured the concentration of TDCIPP within car interior air (Kim et al., 2019; Tokumura et al., 2017). For example, Kim et al. (2019) reported that higher concentrations of TDCIPP were found in air compared to dust in indoor environments (Kim et al., 2019). Interestingly, concentrations of OPEs in wristbands have not been consistently correlated with concentrations in dust (Hammel et al., 2020) but have been correlated with urine biomarkers (Gibson et al., 2019; Hammel et al., 2016, 2020) and active air samplers (Wang et al., 2019). Furthermore, TDCIPP has also been detected within nasal lavages (Velázquez-Gómez and Lacorte, 2019). This suggests that larger TDCIPP concentrations may be within air, and that wristbands may reflect partitioning from airborne TDCIPP. Moreover, TDCIPP circulating within the car interior air may result in inhalation and dermal absorption based on its properties as an SVOC (Schreder et al., 2016; Weschler and Nazaroff, 2012). Indeed, Schreder et al. (2016) suggested that the total intake of chlorinated OPEs via inhalation was estimated to exceed intake via dust. Overall, this highlights an important exposure route to consider when quantifying exposure to TDCIPP and underscores the need for more studies examining the concentration of airborne TDCIPP within the indoor microenvironment of vehicles. In addition to TDCIPP concentrations within vehicular air, it is also important to characterize inhalation to TDCIPP through techniques such as nasal lavage or measurement of inflammatory response within nostrils (Norbäck et al.,2000; Graham and Koren, 1990). Although TDCIPP is on California’s Proposition 65 list based on its potential to cause cancer following ingestion, there is a need for more studies examining the potential toxicity of TDCIPP following inhalation.
4. Conclusions
While previous studies have detected TDCIPP concentrations within vehicle dust and air samples, to our knowledge this is the first study to evaluate the potential contribution of dust on interior parts at the front of the vehicle to TDCIPP exposure while commuting in cars. Although we did not collect biomarkers from participants, several studies have shown that wristbands are significantly correlated with urinary biomarkers for TDCIPP (Gibson et al., 2019; Hammel et al., 2016, 2020). Furthermore, as the participants in our study only wiped dashboard dust and did not remove dust from all sources (e.g., roof upholstery, car seats, floor mats, windows, etc.), we are unable to draw any definite conclusions between complete, in-vehicle dust elimination and TDCIPP exposure. Nevertheless, given that a large percentage of Americans spend a significant amount of time within their vehicles, our study identifies a potential knowledge gap that should be addressed in order to increase our understanding of the mechanisms of TDCIPP exposure within vehicles.
Supplementary Material
Acknowledgements
Research support was provided by a National Institutes of Health grant [R01ES027576] and the USDA National Institute of Food and Agriculture Hatch Project [1009609] to D.C.V.
Footnotes
Declaration of competing interest
The authors have no conflicts of interest to declare.
Appendix A. Supplementary data
Supplementary data to this article can be found online at https://doi.org/10.1016/j.envres.2021.112525.
References
- Abdallah MA-E, Covaci A, 2014. Organophosphate flame retardants in indoor dust from Egypt: implications for human exposure. Environ. Sci. Technol 48, 4782–4789. 10.1021/es501078s. [DOI] [PubMed] [Google Scholar]
- Adamkiewicz G, Zota AR, Fabian MP, Chahine T, Julien R, Spengler JD, Levy JI, 2011. Moving environmental justice indoors: understanding structural influences on residential exposure patterns in low-income communities. Am. J. Publ. Health 101 (Suppl. 1), S238–S245. 10.2105/AJPH.2011.300119. [DOI] [PMC free article] [PubMed] [Google Scholar]
- Ali N, Ali L, Mehdi T, Dirtu AC, Al-Shammari F, Neels H, Covaci A, 2013. Levels and profiles of organochlorines and flame retardants in car and house dust from Kuwait and Pakistan: implication for human exposure via dust ingestion. Environ. Int 55, 62–70. 10.1016/J.ENVINT.2013.02.001. [DOI] [PubMed] [Google Scholar]
- Ali N, Kadi MW, Ali Albar HMS, Rashid MI, Chandrasekaran S, Summan AS, de Wit CA, Malarvannan G, 2021. Semi-volatile organic compounds in car dust: a pilot study in jeddah, Saudi Arabia. Int. J. Environ. Res. Publ. Health 18, 4803. 10.3390/ijerph18094803. [DOI] [PMC free article] [PubMed] [Google Scholar]
- Behl M, Hsieh JH, Shafer TJ, Mundy WR, Rice JR, Boyd WA, Freedman JH, Hunter ES, Jarema KA, Padilla S, Tice RR, 2015. Use of alternative assays to identify and prioritize organophosphorus flame retardants for potential developmental and neurotoxicity. Neurotoxicol. Teratol 52, 181–193. 10.1016/j.ntt.2015.09.003. [DOI] [PubMed] [Google Scholar]
- Brandsma SH, van Velzen MJM, Leonards PEG, 2014. Organophosphorus flame retardants (PFRs) and plasticizers in house and car dust and the influence of electronic equipment. Chemosphere 116, 3–9. 10.1016/J.CHEMOSPHERE.2014.02.036. [DOI] [PubMed] [Google Scholar]
- Brommer S, Harrad S, 2015. Sources and human exposure implications of concentrations of organophosphate flame retardants in dust from UK cars, classrooms, living rooms, and offices. Environ. Int 83, 202–207. 10.1016/J.ENVINT.2015.07.002. [DOI] [PubMed] [Google Scholar]
- Brommer S, Harrad S, Van den Eede N, Covaci A, 2012. Concentrations of organophosphate esters and brominated flame retardants in German indoor dust samples. J. Environ. Monit 14, 2482. 10.1039/c2em30303e. [DOI] [PubMed] [Google Scholar]
- Bureau UC, n.d. Commuting (Journey to Work) [WWW Document]. URL https://www.census.gov/topics/employment/commuting.html (accessed 1.30.21).
- Carignan CC, McClean MD, Cooper EM, Watkins DJ, Fraser AJ, HeigerBernays W, Stapleton HM, Webster TF, 2013. Predictors of tris(1,3-dichloro-2-propyl) phosphate metabolite in the urine of office workers. Environ. Int 55, 56–61. 10.1016/j.envint.2013.02.004. [DOI] [PMC free article] [PubMed] [Google Scholar]
- Chan C-C, Ozkaynak H, Spengler JD, Sheldon L, 1991. Driver exposure to volatile organic compounds, CO, ozone, and N02 under different driving conditions. Environ. Sci. Technol [Google Scholar]
- Chien YC, 2007. Variations in amounts and potential sources of volatile organic chemicals in new cars. Sci. Total Environ 382, 228–239. 10.1016/j.scitotenv.2007.04.022. [DOI] [PubMed] [Google Scholar]
- Christia C, Poma G, Besis A, Samara C, Covaci A, 2018. Legacy and emerging organophosphοrus flame retardants in car dust from Greece: implications for human exposure. Chemosphere 196, 231–239. 10.1016/J.CHEMOSPHERE.2017.12.132. [DOI] [PubMed] [Google Scholar]
- Dixon S, Tohn E, Rupp R, Clark S, 1999. Achieving dust lead clearance standards after lead hazard control projects: an evaluation of the HUD-recommended cleaning procedure and an abbreviated alternative. Appl. Occup. Environ. Hyg 14, 339–344. 10.1080/104732299302927. [DOI] [PubMed] [Google Scholar]
- EPA, 2016. REDUCING YOUR CHILD’S EXPOSURE TO FLAME RETARDANT CHEMICALS what do we know about flame retardant chemicals?. [Google Scholar]
- Faber J, Brodzik K, 2017. Air quality inside passenger cars. AIMS Environ. Sci 4, 112–133. 10.3934/environsci.2017.1.112. [DOI] [Google Scholar]
- Farhat A, Buick JK, Williams A, Yauk CL, O’Brien JM, Crump D, Williams KL, Chiu S, Kennedy SW, 2014. Tris(1,3-dichloro-2-propyl) phosphate perturbs the expression of genes involved in immune response and lipid and steroid metabolism in chicken embryos. Toxicol. Appl. Pharmacol 275, 104–112. 10.1016/j.taap.2013.12.020. [DOI] [PubMed] [Google Scholar]
- Geiss O, Tirendi S, Barrero-Moreno J, Kotzias D, 2009. Investigation of volatile organic compounds and phthalates present in the cabin air of used private cars. Environ. Int 35, 1188–1195. 10.1016/j.envint.2009.07.016. [DOI] [PubMed] [Google Scholar]
- Gibson EA, Stapleton HM, Calero L, Holmes D, Burke K, Martinez R, Cortes B, Nematollahi A, Evans D, Anderson KA, Herbstman JB, 2019. Differential exposure to organophosphate flame retardants in mother-child pairs. Chemosphere 219, 567–573. 10.1016/j.chemosphere.2018.12.008. [DOI] [PMC free article] [PubMed] [Google Scholar]
- Goosey E, Harrad S, 2011. Perfluoroalkyl compounds in dust from Asian, Australian, European, and North American homes and UK cars, classrooms, and offices. Environ. Int 37, 86–92. 10.1016/j.envint.2010.08.001. [DOI] [PubMed] [Google Scholar]
- Graham DE, Koren HS, 1990. Biomarkers of inflammation in ozone-exposed humans: comparison of the nasal and bronchoalveolar lavage. Am. Rev. Respir. Dis 142, 152–156. 10.1164/ajrccm/142.1.152. [DOI] [PubMed] [Google Scholar]
- Hammel SC, Hoffman K, Phillips AL, Levasseur JL, Lorenzo AM, Webster TF, Stapleton HM, 2020. Comparing the use of silicone wristbands, hand wipes, and dust to evaluate children’s exposure to flame retardants and plasticizers. Environ. Sci. Technol 54, 4484–4494. 10.1021/acs.est.9b07909. [DOI] [PMC free article] [PubMed] [Google Scholar]
- Hammel SC, Hoffman K, Webster TF, Anderson KA, Stapleton HM, 2016. Measuring personal exposure to organophosphate flame retardants using silicone wristbands and hand wipes. Environ. Sci. Technol 50, 4483–4491. 10.1021/acs.est.6b00030. [DOI] [PMC free article] [PubMed] [Google Scholar]
- Hammel SC, Phillips AL, Hoffman K, Stapleton HM, 2018. Evaluating the use of silicone wristbands to measure personal exposure to brominated flame retardants. Environ. Sci. Technol 10.1021/acs.est.8b03755acs.est.8b03755. [DOI] [PMC free article] [PubMed] [Google Scholar]
- Harrad S, Brommer S, Mueller JF, 2016. Concentrations of organophosphate flame retardants in dust from cars, homes, and offices: an international comparison. Emerg. Contam 2, 66–72. 10.1016/j.emcon.2016.05.002. [DOI] [Google Scholar]
- Kim UJ, Wang Y, Li W, Kannan K, 2019. Occurrence of and human exposure to organophosphate flame retardants/plasticizers in indoor air and dust from various microenvironments in the United States. Environ. Int 125, 342–349. 10.1016/j.envint.2019.01.065. [DOI] [PubMed] [Google Scholar]
- Levasseur JL, Hammel SC, Hoffman K, Phillips AL, Zhang S, Ye X, Calafat AM, Webster TF, Stapleton HM, 2021. Young children’s exposure to phenols in the home: Associations between house dust, hand wipes, silicone wristbands, and urinary biomarkers. Environ. Int 147, 106317. 10.1016/jenvint.2020.106317. . [DOI] [PMC free article] [PubMed] [Google Scholar]
- McGee SP, Konstantinov A, Stapleton HM, Volz DC, 2013. Aryl phosphate esters within a major pentaBDE replacement product induce cardiotoxicity in developing zebrafish embryos: potential role of the aryl hydrocarbon receptor. Toxicol. Sci 10.1093/toxsci/kft020. [DOI] [PubMed] [Google Scholar]
- Moser VC, Phillips PM, Hedge JM, McDaniel KL, 2015. Neurotoxicological and thyroid evaluations of rats developmentally exposed to tris(1,3-dichloro-2-propyl) phosphate (TDCIPP) and tris(2-chloro-2-ethyl)phosphate (TCEP). Neurotoxicol. Teratol 52, 236–247. 10.1016/j.ntt.2015.08.004. [DOI] [PubMed] [Google Scholar]
- Norbäck D, Wålinder R, Wieslander G, Smedje G, Erwall C, Venge P, 2000. Indoor air pollutants in schools: nasal patency and biomarkers in nasal lavage. Allergy 55, 163–170. 10.1034/j.1398-9995.2000.00353.x. [DOI] [PubMed] [Google Scholar]
- Phillips AL, Hammel SC, Konstantinov A, Stapleton HM, 2017. Characterization of individual isopropylated and tert-butylated triarylphosphate (ITP and TBPP) isomers in several commercial flame retardant mixtures and house dust standard reference material SRM 2585. Environ. Sci. Technol 51, 13443–13449. 10.1021/acs.est.7b04179. [DOI] [PMC free article] [PubMed] [Google Scholar]
- Reddam A, Tait G, Herkert N, Hammel SC, Stapleton HM, Volz DC, 2020. Longer commutes are associated with increased human exposure to tris(1,3-dichloro-2-propyl) phosphate. Environ. Int 136, 105499. 10.1016/j.envint.2020.105499. [DOI] [PMC free article] [PubMed] [Google Scholar]
- Riediker M, Williams R, Devlin R, Griggs T, Bromberg P, 2003. Exposure to particulate matter, volatile organic compounds, and other air pollutants inside patrol cars. Environ. Sci. Technol 37, 2084–2093. 10.1021/es026264y. [DOI] [PubMed] [Google Scholar]
- Roberts JW, Wallace LA, Camann DE, Dickey P, Gilbert SG, Lewis RG, Takaro TK, 2009. Monitoring and reducing exposure of infants to pollutants in house dust. Rev. Environ. Contam. Toxicol 201, 1–39. 10.1007/978-1-4419-0032-6_1. [DOI] [PubMed] [Google Scholar]
- Schreder ED, Uding N, La Guardia MJ, 2016. Inhalation a significant exposure route for chlorinated organophosphate flame retardants. Chemosphere 150, 499–504. 10.1016/j.chemosphere.2015.11.084. [DOI] [PubMed] [Google Scholar]
- Stapleton HM, Klosterhaus S, Eagle S, Fuh J, Meeker JD, Blum A, Webster TF, 2009. Detection of organophosphate flame retardants in furniture foam and U.S. House dust. Environ. Sci. Technol 43, 7490–7495. 10.1021/es9014019. [DOI] [PMC free article] [PubMed] [Google Scholar]
- Stapleton HM, Sharma S, Getzinger G, Ferguson PL, Gabriel M, Webster TF, Blum A, 2012. Novel and high volume use flame retardants in US couches reflective of the 2005 PentaBDE phase out. Environ. Sci. Technol 46, 13432–13439. 10.1021/es303471d. [DOI] [PMC free article] [PubMed] [Google Scholar]
- Stuart H, Ibarra C, Abdallah MAE, Boon R, Neels H, Covaci A, 2008. Concentrations of brominated flame retardants in dust from United Kingdom cars, homes, and offices: causes of variability and implications for human exposure. Environ. Int 34, 1170–1175. 10.1016/j.envint.2008.05.001. [DOI] [PubMed] [Google Scholar]
- Tokumura M, Hatayama R, Tatsu K, Naito T, Takeda T, Raknuzzaman M, Al-Mamun MH, Masunaga S, 2017. Organophosphate flame retardants in the indoor air and dust in cars in Japan. Environ. Monit. Assess 189 10.1007/s10661-016-5725-1. [DOI] [PubMed] [Google Scholar]
- US EPA, Indoor Air Quality (IAQ) [WWW Document]. URL https://www.epa.gov/indoor-air-quality-iaq (accessed 1.30.21).
- van der Veen I, de Boer J, 2012. Phosphorus flame retardants: properties, production, environmental occurrence, toxicity and analysis. Chemosphere 10.1016/j.chemosphere.2012.03.067. [DOI] [PubMed] [Google Scholar]
- Velázquez-Gómez M, Lacorte S, 2019. Nasal lavages as a tool for monitoring exposure to organic pollutants. Environ. Res 178, 108726. 10.1016/j.envres.2019.108726. [DOI] [PubMed] [Google Scholar]
- Wang S, Romanak KA, Stubbings WA, Arrandale VH, Hendryx M, Diamond ML, Salamova A, Venier M, 2019. Silicone wristbands integrate dermal and inhalation exposures to semi-volatile organic compounds (SVOCs). Environ. Int 132, 105104. 10.1016/J.ENVINT.2019.105104. [DOI] [PMC free article] [PubMed] [Google Scholar]
- Weschler CJ, Nazaroff WW, 2012. SVOC exposure indoors: fresh look at dermal pathways. Indoor Air 22, 356–377. 10.1111/j.1600-0668.2012.00772.x. [DOI] [PubMed] [Google Scholar]
- ollutants, 2010. , WHO. World Health Organization. [Google Scholar]
- Wu D-L, Lin M, Chan C-Y, Li W-Z, Tao J, Li Y-P, Sang X-F, Bu C-W, 2013. Influences of commuting mode, air conditioning mode and meteorological parameters on fine particle (PM2.5) exposure levels in traffic microenvironments. Aerosol Air Qual. Res 13, 709–720. 10.4209/aaqr.2012.08.0212. [DOI] [Google Scholar]
- Zhou L, Hiltscher M, Gruber D, Püttmann W, 2017. Organophosphate flame retardants (OPFRs) in indoor and outdoor air in the Rhine/Main area, Germany: comparison of concentrations and distribution profiles in different microenvironments. Environ. Sci. Pollut. Res 24, 10992–11005. 10.1007/s11356-016-6902-z. [DOI] [PubMed] [Google Scholar]
- Zhu Z, Li Z, Liu Y, Chen H, Zeng J, 2017. The impact of urban characteristics and residents’ income on commuting in China. Transport. Res. Transport Environ 57, 474–483. 10.1016/j.trd.2017.09.015. [DOI] [Google Scholar]
- Zulauf N, Dröge J, Klingelhöfer D, Braun M, Oremek GM, Groneberg DA, 2019. Indoor air pollution in cars: an update on novel insights. Int. J. Environ. Res. Publ. Health 10.3390/ijerph16132441. [DOI] [PMC free article] [PubMed] [Google Scholar]
Associated Data
This section collects any data citations, data availability statements, or supplementary materials included in this article.