

Abstract
Oral cavity squamous cell carcinoma (OSCC) affects more than 30,000 individuals in the US annually, with smoking and alcohol consumption being the main risk factors. Management of early stage tumors usually includes surgical resection followed by postoperative radiotherapy in certain cases. The cervical lymph nodes (LN) are the most common site for local metastasis and elective neck dissection is usually performed if the primary tumor thickness is greater than 3.5 mm. However, postoperative histological examination often reveals that many patients with early stage disease are negative for neck nodal metastasis, posing a pressing need for improved risk stratification to either avoid over-treatment or prevent the disease progression. To this end, we aimed to identify a primary tumor gene signature that can accurately predict cervical LN metastasis in patients with early stage OSCC. Using gene expression profiles from 189 samples, we trained K-top scoring pairs (K-TSPs) models and identified six gene pairs that can distinguish primary tumors with nodal metastasis from those without metastasis. The signature was further validated on an independent cohort of 35 patients using RT-PCR in which it achieved an Area Under the ROC Curve (AUC) and accuracy of 90% and 91% respectively. These results indicate that such signature holds promise as a quick and cost effective method for detecting patients at high risk of developing cervical LN metastasis, and may be potentially used to guide the neck treatment regimen in early-stages OSCC.
Keywords: oral cavity squamous cell carcinoma, lymph node metastasis, gene signature, K-TSPs, neck dissection
Introduction
Oral squamous cell carcinoma (OSCC), which accounts for nearly 50% of all head and neck cancers, is the sixth most common malignancy, causing 177,000 deaths worldwide in 2018 alone 1. Tobacco products, excess alcohol consumption, and in many regions of the world, betel quid chewing, increase the risk of OSCC. In recent years, OSCC incidence has been increasing in patients without these traditional risk factors. The cause of this increase is unclear and various genetic, environmental, and infectious factors have been hypothesized to play a role 2–5. While prominent in oropharyngeal cancer, the prevalence of human papilloma virus (HPV) infection in OSCC is low and its role remains unclear 6.
The conventional OSCC management includes surgical resection of the primary tumors, with nearly 80% of the patients undergoing radical neck dissection regardless of their clinical TNM staging. However, postoperative histological examination shows that approximately half of the patients that were clinically diagnosed with T1 T2 cN0 cancer, are negative for neck lymph node (LN) metastasis 7. As surgical management of the neck is advised when the risk for LN metastasis is higher than 15%, this highly invasive procedure is likely unnecessary for many patients 8–11. Currently, there is a significant controversy regarding the management of clinically N0 patients (cN0), especially early stage cases (T1,T2) 12. On the other hand, early diagnosis of lymph node metastasis (if present) is essential for improved clinical outcomes of patients with OSCC.
The current diagnosis of lymph node metastasis is mainly based on clinical evaluation and imaging techniques. However, these approaches are not accurate and sensitive enough for early lymph node metastasis diagnosis. Thus, new diagnostic strategies are needed for a more accurate prediction of the subclinical cervical lymph node metastases and providing treatment guidance for patients with early stage disease 13–15.
The progression from non-invasive to metastatic disease involves the accumulation of genetic alterations, including pervasive gene expression changes 16. As such, transcription-based biomarkers for clinical use have been extensively studied in numerous malignant diseases 17, 18, including HNSCC 19, 20. Over the last decade, several retrospective preclinical studies reported gene expression signatures that are relevant for predicting OSCC tumors staging and grading 21–30. However, most of the multigene signatures defined by these studies are either large or insufficiently validated in independent cohorts, which undermine their translational potential. Furthermore, these studies have a limited sample size and the resulting signatures are highly variable 31. To date, none of the identified signatures or molecular biomarkers associated with nodal metastasis has been successfully implemented as a diagnostic or prognostic tool applicable to clinical practice. Therefore, there is a pressing need for defining a well validated, platform independent, and easy to interpret small gene expression signature with high predictive value for cervical LN metastatic potential in patients with early-stage OSCC.
In this study, we used the k-top scoring pairs (K-TSPs) algorithm implemented by the switchBox R package 32 to develop a small gene signature that can predict cervical LN metastasis in clinical T1 T2 N0 patients. The K-TSPs is a rank-based classifier that is based on the relative ordering of two features and selects gene pairs that consistently switch their ranking between the two classes of interest 33, 34. The algorithm returns a set of pairs with each pair giving a vote for one class based on the relative ordering of its two individual genes and the final class prediction is determined by the sum of votes. In this sense, this method can be used to determine a specific pathological feature such as the presence of LN metastasis based on the expression pattern of several gene pairs. Since it depends mostly on the relative ranking of genes rather than their absolute expression values, the K-TSPs is robust to most data preprocessing techniques as long as the rank is preserved and its simple decision rules can be extended to different technologies other than the ones used in the training process 33.
Applying this simple algorithm on gene expression data from large microarrays and RNA-Seq databases together with relying on existing biological knowledge in the training process, we managed to identify a robust primary tumor gene signature of cervical LN metastasis which was further validated using RT-PCR in an independent cohort of 35 patients with early-stage OSCC. The high performance of this signature in the independent validation data together with its simple decision rules make it a potential candidate for a PCR test that can be used to predict cervical LN metastasis and to guide the neck treatment plan in patients with early-stages disease.
Methods
Training set Inclusion criteria and data collection
A training cohort included 189 HPV negative, early stage (T1 or T2) OSCC tumors with pathological cervical LN status N0, N1 or N2 (Table 1). Eighty microarray transcriptomes were obtained from two NCBI Gene Expression Omnibus (GEO) datasets, GSE65858 (n = 32) and GSE42743 (n = 48). RNA-Seq profiles of 109 patients matching the inclusion criteria were obtained from the TCGA- HNSC dataset. Tumors were staged according to the 7th edition of the TNM AJCC cancer staging manual.
Table 1.
Characteristics of the training cohort
| GSE65858 | GSE42743 | TCGA | All training | ||
|---|---|---|---|---|---|
| Technology (Platform) | Microarray (GPL10558)* | Microarray (GPL570)** | RNA-Seq | - | |
| N of samples | 32 | 48 | 109 | 189 | |
| Mean age (years) | 56 | 59 | 62.5 | 60.5 | |
| % males | 78% | 68.80% | 63% | 67% | |
| % current or former smokers | 90.60% | 75% | 59.60% | 68.80% | |
| cT Stage | T1 | 10 | 5 | 12 | 27 (15%) |
| T2 | 22 | 42 | 97 | 161 (85%) | |
| cN Stage | N0 | 32 | 48 | 109 | 189 (100%) |
| pT Stage | T1 | 13 | 3 | 18 | 34 (18%) |
| T2 | 19 | 45 | 91 | 155 (82%) | |
| T3 | 0 | 0 | 0 | 0 (0%) | |
| T4 | 0 | 0 | 0 | 0 (0%) | |
| pN Stage | N0 | 19 | 29 | 82 | 130 (69%) |
| N1 | 5 | 7 | 15 | 27 (14%) | |
| N2 | 8 | 12 | 12 | 32 (17%) | |
| Tumor subsite | Oral tongue | 15 | 21 | 60 | 96 (50%) |
| Floor of mouth | 7 | 13 | 25 | 45 (24%) | |
| Buccal mucosa | 5 | 4 | 8 | 17 (9%) | |
| Alveolar ridge | 3 | 10 | 5 | 18 (9%) | |
| Not specified | 2 | 0 | 11 | 13 (7%) | |
Expression profiles normalization
Normalized and log2-transformed expression profiles for the microarray and RNA-Seq datasets were retrieved directly from GEO and cBioportal, respectively. The two microarray datasets were combined into a single patients cohort (designated as “array dataset”) and batch correction was performed to adjust for the different studies and platforms using Combat 35, which implements parametric empirical Bayes methods to remove the batch effect. Subsequently, both the array and TCGA datasets were further normalized to GAPDH.
Mechanistic pairs assembly
To reduce the number of features and subsequently minimize overfitting, the training process was limited to a number of mechanistic gene pairs related to the phenotype being predicted. Since the phenotype under study is the LN metastasis status, we used the molecular signature database (MsigDB) v6.1 36 to identify gene sets related to cancer progression and metastasis. Five cancer hallmarks gene set collections were used 37: 1. angiogenesis; 2. apoptosis; 3. growth; 4. immune surveillance; and 5. invasion or epithelial-mesenchymal transition (EMT) together with a 6th dataset comprising the tumor associated genes (TAGs) including both tumor suppressors and oncogenes 38.
Each collection was curated to construct a list of mechanistic pairs for further use in the downstream modeling. More specifically, gene sets in each collection were divided into sets associated with good or bad prognosis. Gene sets associated with good prognosis included those involved in the negative regulation of angiogenesis, cell proliferation and growth, EMT and those involved in the positive regulation of the immune response and apoptosis, together with tumor suppressor genes. In contrast, gene sets associated with bad prognosis included those involved in the positive regulation of angiogenesis, cellular proliferation, EMT or cell migration and those involved in the negative regulation of the immune response and apoptosis, together with oncogenes.
For each one of the six collections, a biological mechanism was built by pairing genes associated with good prognosis with those associated with bad prognosis. For example, the apoptosis mechanism is composed of contrast gene pairs of pro and anti-apoptosis genes. Finally, the six mechanisms were integrated together into a mega-list of mechanistic pairs to which the training process was restricted.
Training the K-TPSs classifiers
To identify a gene signature that can predict the regional LN metastasis status, we used K-Top Scoring Pairs (K-TSPs) algorithm which is a rank-based classification method that selects gene pairs (K) whose expression levels switch their ranking between the two classes of interest 33, 34. Since this algorithm depends mostly on the relative ordering of gene expression within each sample, it is robust to most data preprocessing techniques.
Since the training data contains samples from both microarrays and RNA-seq based datasets, two separate K-TSPs classifiers were trained; the first on the combined microarray datasets and the second on the RNA-Seq dataset. Both models were trained to return the maximum number of gene pairs restricting the training process to the mechanistic pairs described above. Gene pairs shared by both classifiers were then ranked based on their mean score and those with the highest score were included in the final signature.
Classifiers Validation
The independent validation cohort (designated as RT-PCR cohort) contained 35 early stage, HPV negative, unstudied OSCC tumors from a native surgical resection (without history of chemotherapy or radiation) (Table 2).
Table 2.
Characteristics of the validation cohort
| Validation cohort | ||
|---|---|---|
| Technology | RT-PCR | |
| N of samples | 35 | |
| Mean age (years) | 60.4 | |
| % males | 74.30% | |
| % current or former smokers | 74.30% | |
| cT Stage | T1 | 19 (54%) |
| T2 | 16 (46%) | |
| cN Stage | N0 | 35 (100%) |
| pT Stage | T1 | 17 (48.6%) |
| T2 | 15 (42.8%) | |
| T3 | 3 (8.6%) | |
| T4 | 0 (0%) | |
| pN Stage | N0 | 16 (46%) |
| N1 | 7 (20%) | |
| N2 | 12 (34%) | |
| Tumor sub site | Oral tongue | 14 (40%) |
| Floor of mouth | 9 (26%) | |
| Buccal mucosa | 5 (14%) | |
| Alveolar ridge | 3 (9%) | |
| Not specified | 4 (11%) | |
cT - clinical T stage
cN - clinical N stage
pT - pathological T stage
pN - pathological N stage
RNA extraction and cDNA synthesis
Total RNA from each sample was extracted using Tri-Reagent (Sigma-Aldrich) and converted to cDNA using qScript cDNA synthesis kit (Quanta Biosciences) according to the manufacturer’s protocol.
RT-PCR
RT-PCR was performed using TaqMan one-step RT-qPCR Master Mix Reagents kit (Applied Biosystems) with the 7900HT SDS Real-Time system (Applied Biosystems). The final concentrations of template and primers were determined individually for every assay and calibrated based on a standard curve. Primers were purchased from IDT. The primer sequences for each of the 12 genes comprising the signature as well as for a reference gene (GAPDH) are listed in Supplementary Table 1. All assays were carried out in triplicates using the following conditions: 95 °C for 3 min, followed by 50 cycles at 95 °C for 15 s and 60 °C for 1 min. Analysis was performed using 7900HT RT-qPCR SDS software (Applied Biosystems). The ΔCT of the genes of interest was calculated relative to GAPDH and expressed as 2−ΔΔCT versus average primary as a control.
Decision Curve Analysis
Decision curve analysis (DCA) 39 was performed to estimate the net benefit of the signature in preventing an unnecessary overtreatment compared to two alternative strategies: (a) all patients undergo radical neck dissection (Treat all); and (b) none of the patients undergo neck dissection (Treat none). Both the net benefit and the net reduction in the number of interventions, resulting from using the signature, were calculated against the ‘Treat all’ and ‘Treat none’ strategies for LN metastasis probabilities ranging from 0 to 30%. The net benefit is interpreted as the weighted difference between true and false positives rates. This represents the benefit of treating the right patients (cases positive for cervical LN metastasis) minus the harm of treating those that did not need treatment (patients negative for cervical LN metastasis).
Results
Assembly of the training cohort
As our goal was to establish platform-independent classifiers, both microarray and RNA-Seq dataset were used in this study. The inclusion was limited to primary, HPV negative, early stage (T1 or T2) OSCC tumors, with available information regarding their pathological cervical LN status (N-stage). Searching both the GEO and TCGA-HNSC databases resulted in 189 cases obtained from two microarray cohorts (GSE65858 and GSE42743) and a subset of patients from TCGA (profiled with RNA-Seq), whose cervical lymph node status was either N1 and N2 (LN positive) or N0 (LN negative). Expression profiles were normalized, log-scaled, and batch correction was performed to adjust for the different studies and platforms (31). The two microarray cohorts were further combined into a single dataset (Array dataset). The clinicopathological data for all patients included in the training cohort is summarized in Table 1.
Assembling a collection of the mechanistic gene pairs strongly associated with tumor invasion and metastasis
Two separate K-TSPs models were trained on the array (n = 80) and TCGA (n = 109) datasets. In our analysis we embedded prior biological knowledge, represented as gene pairs in the algorithm decision rules. Specifically, gene sets relevant to five different biological mechanisms (angiogenesis, apoptosis, immune surveillance, invasion/EMT, tumor suppressor genes/oncogenes) were acquired from MsigDB 40 and used to build the corresponding gene pairs. For the angiogenesis mechanism, we collected 22 different (16 pro-angiogenesis and 6 anti-angiogenesis) gene sets which were subsequently used to build 55180 gene pairs, with each pair consisting of one pro-angiogenesis and one anti-angiogenesis gene. For the apoptosis mechanism classification, we identified 34 (25 pro-apoptosis and 9 anti-apoptosis) gene sets which were used to build 115322 gene pairs. Similarly, a total of 265512 gene pairs for the growth mechanism were derived from 53 (30 pro-growth and 23 anti-proliferation) gene sets. The immune surveillance mechanism consisted of 376188 gene pairs derived from 92 gene sets involved in the activation of immune response and 75 gene sets associated with the repression of immune response or activation of regulatory T cells (Treg). For the invasion/EMT mechanism classification, we used 61 gene sets associated with cellular migration, invasion and metastasis (33 pro-invasion and 28 anti-invasion) to build 86955 gene pairs. Additionally, a sixth collection of gene pairs (TAGs) 38 included 58292 gene pairs which were built by pairing tumor suppressor genes with oncogenes. Finally, these six mechanisms were combined together to form a megalist of 957449 mechanistic gene pairs associated with tumor invasion and metastasis, to which we restricted the training process. An overview of the training process is summarized in Supplementary Figure 1
Selection of six gene pairs predictive of cervical LN metastasis in microarray and RNA-Seq data
For each data type (microarrays and RNA-Seq), we trained a K-TSPs model to identify gene pairs that switch their ranking between LN positive and negative samples. Normally, the algorithm computes this relative ranking for all genes and assigns a score for each gene pair based on the consistency and magnitude of difference between the two classes, returning a small number of top scoring pairs (TSPs). In our analysis, we restricted the training process to the list of mechanistic pairs described above, since they are biologically relevant to the phenotype under study and their relative ranking is expected to be consistently different between the two classes.
Each model was trained to return the maximum number of possible gene pairs whose relative ordering differs between LN positive and LN negative samples. The array and TCGA K-TSPs models returned 3116 and 3231 pairs, respectively with a pairwise score > 0. Of these, 67 pairs were shared by the two sample cohorts, and their mean score between both classifiers was calculated. The final signature included the six gene pairs with the highest mean score: SKI-PDLIM4 (0.33292100), STK11-INO80 (0.29423913), SETMAR-RAB11FIP4 (0.28859152), SATB1-TMEM176B (0.28361966), PAPPA-TGFB2 (0.27675144), and CTSB-GSTP1 (0.26442541).
These six pairs represent different biological mechanisms, such as TAGs (SKI-PDLIM4), growth (STK11-INO80 and SETMAR-RAB11FIP4), immune-surveillance (SATB1-TMEM176B), and invasion/EMT (PAPPA-TGFB2 and CTSB-GSTP1). Each pair votes for one class (LN positive versus LN negative) based on their relative ordering in a particular sample and the final class prediction is determined by the sum of all six votes. In both the array and TCGA datasets, a threshold of two votes was used to maximize both the sensitivity and specificity (Youden’s Index method) (Figure 1) 41. Specifically, samples with ≤ 2 votes were classified as LN positive; otherwise, they were classified as LN negative (Figures 2). Boxplots displaying the expression difference of each gene pair in both training datasets are shown in Supplementary Figure 2A and 2B.
Figure 1. ROC curves of the classifier performance in the two training datasets.

A threshold of two was selected to maximize the sensitivity and specificity. K-TSPs: k-top scoring pairs, AUC: area under the ROC curve.
Figure 2. Heatmap of the six TSPs votes for the training cohort.
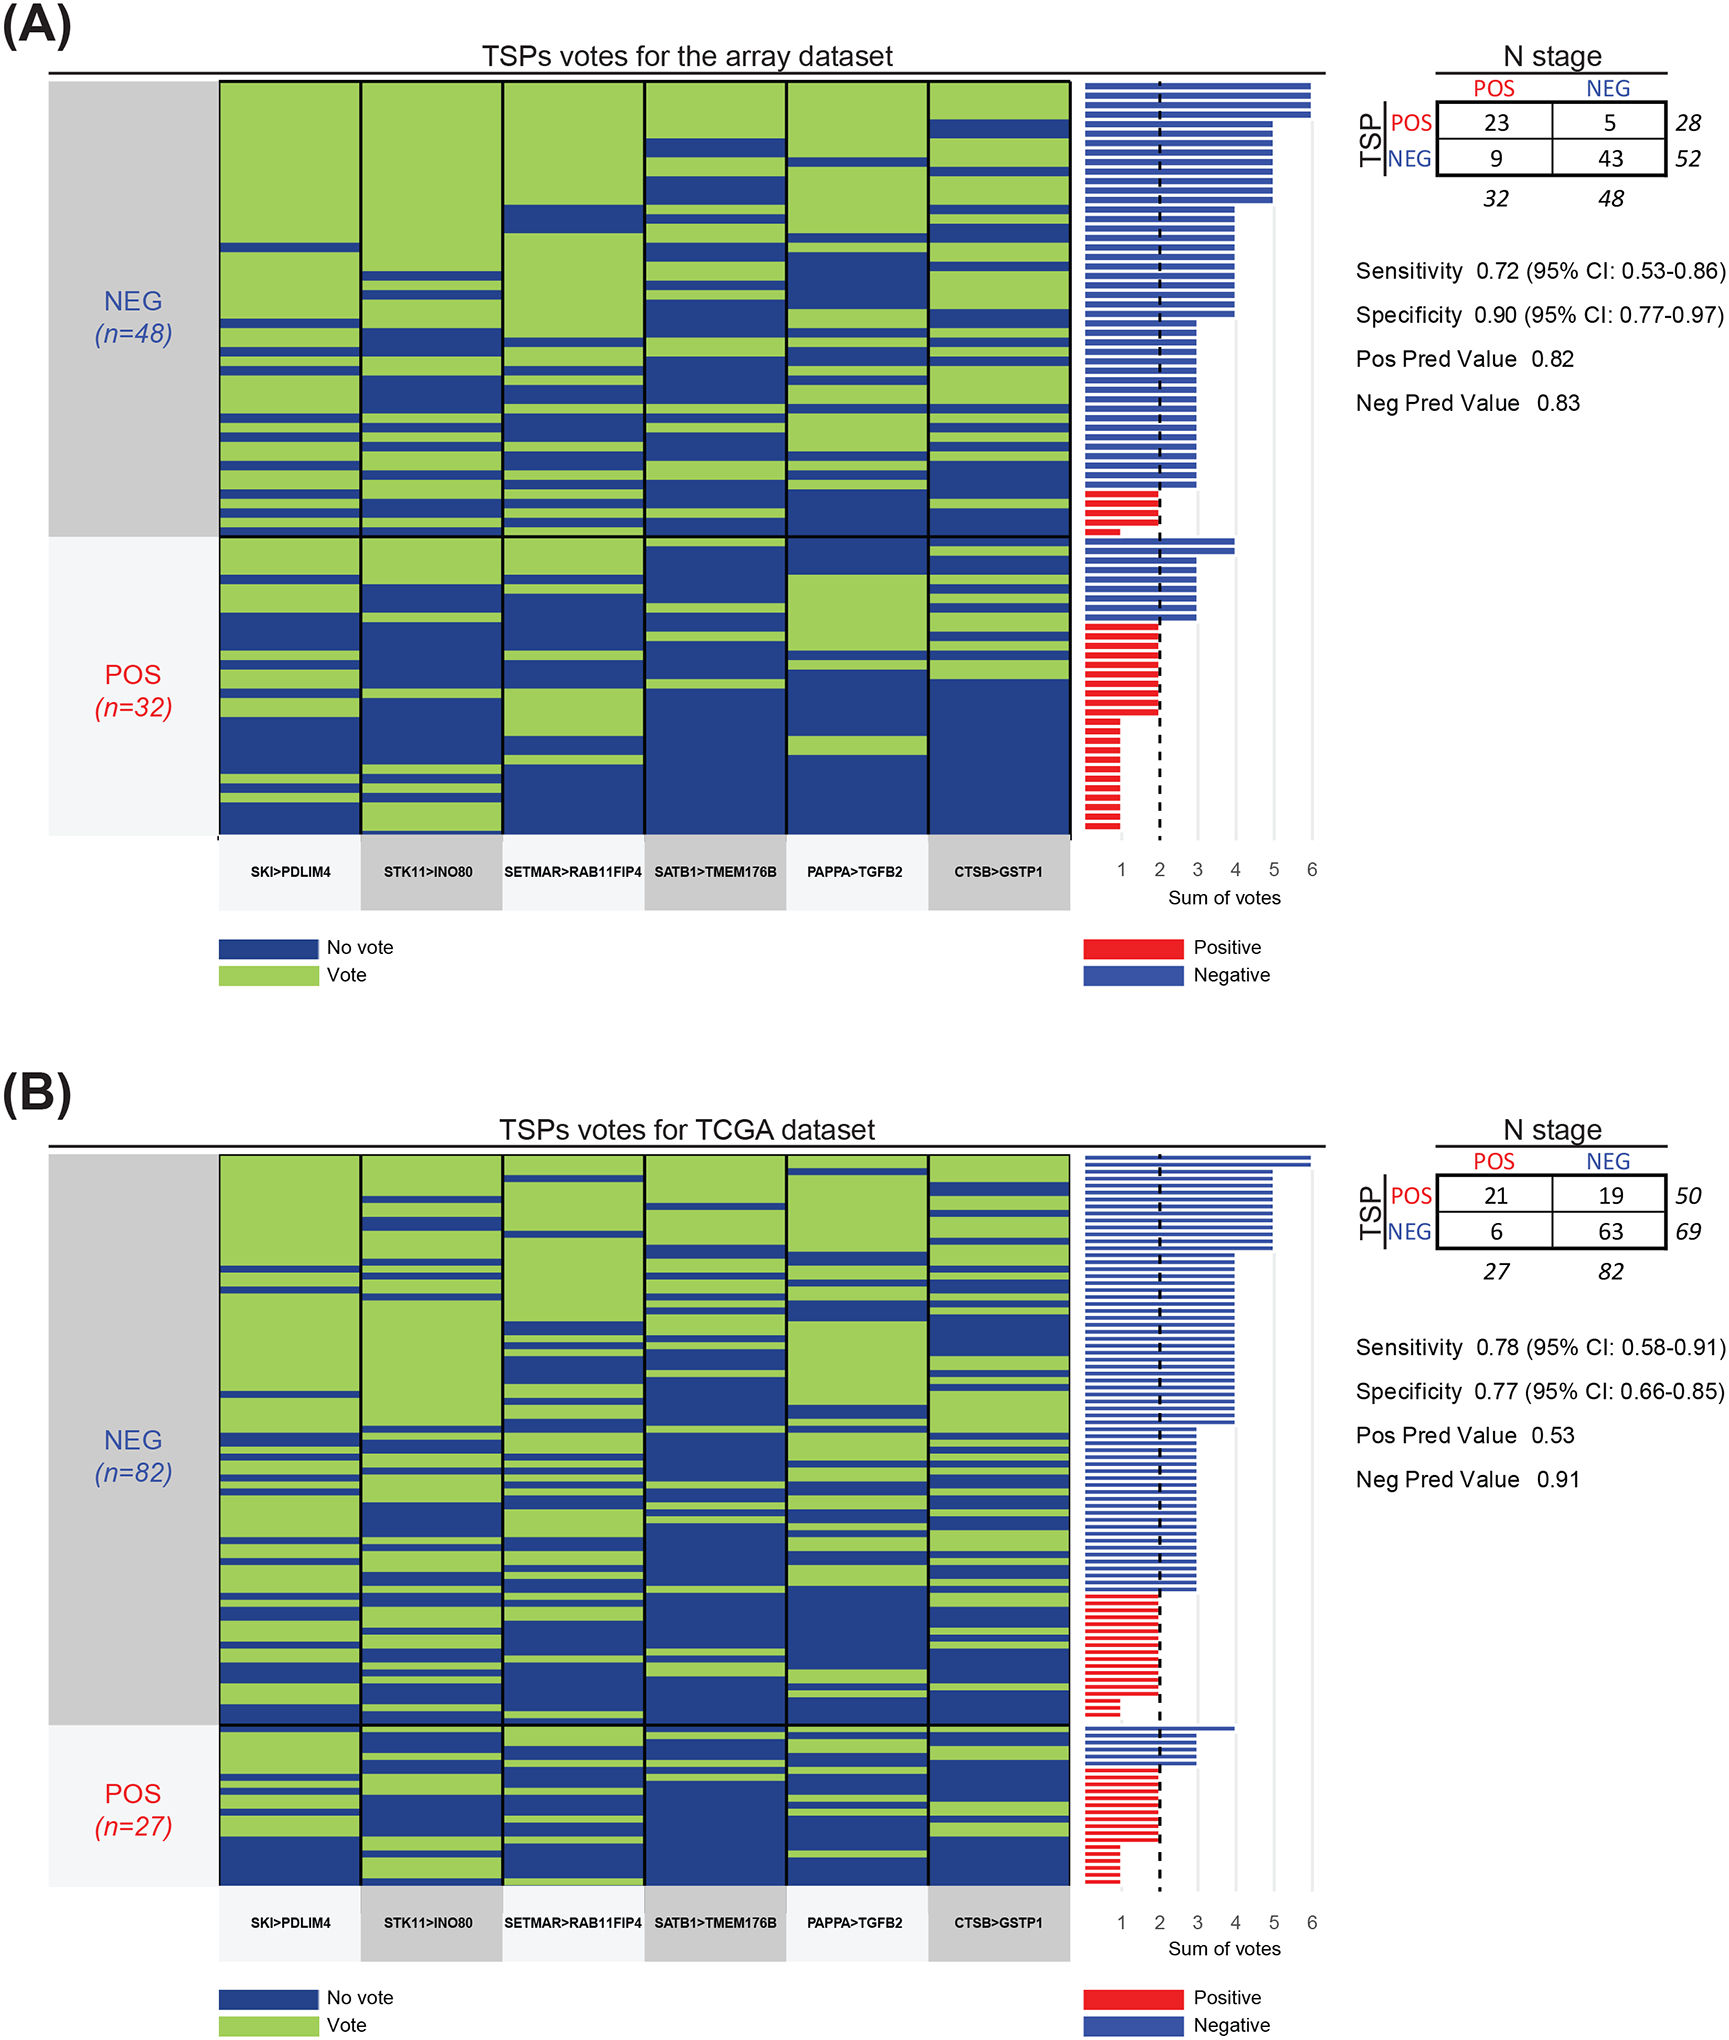
(A-B) Each pair (bottom) contributes a vote, and the final prediction of each sample is determined by the sum of votes. The true class labels are shown on the left and arranged into two groups: LN negative (blue) and positive (red). The bar plot on the right shows the sum of votes in each sample with vertical dashed black line representing the classification threshold. Samples with ≤ 2 votes were classified as LN positive (red bars); otherwise, they were classified as negative (blue bars). Different colors between the bar plot on the right and the true class labels on the left indicates misclassification. Contingency table as well as sensitivity, specificity, positive prediction value, negative prediction value and confidence intervals (CI) are indicated on the right.
Independent validation using RT-PCR
To validate the predictive ability of our model, we have assessed the expression level of 12 genes included in the 6 gene pairs panel using the Quantitative Real Time PCR (RT-PCR) assay in an independent cohort of 35 primary tissues samples: 16 samples were staged pathologically N0, and the other 19 were staged pathologically as N positive (Table 2). Prior to the analysis, two H&E stained sections (tail ends) for each sample were assessed by a senior head and neck pathologist to confirm >60% neoplastic cellularity. The relative expression mode of each gene pair was evaluated relative to GAPDH.
Notably, multiple tumor suppressor genes (CTSB, SETMAR, SKI, and STAB1) were highly expressed in tumors with LN negative status, whereas expression of genes associated with tumor promotion (GSTB, RAB11FIP4, INO80, and TMEM1768) was elevated among patients positive for LN involvement. Using a threshold of two votes, the 6-TSPs signature was able to distinguish all 19 LN positive and 13 out of 16 LN negative samples in the validation cohort (Figure 3A), with an Area Under the ROC Curve (AUC) of 0.90 (95% CI: 0.77–1.0), accuracy of 91% (95% CI: 77–98%), sensitivity of 100% (95% CI: 82–100%), and specificity of 81% (95% CI: 54–96%) (Figure 3B). Boxplots displaying the expression difference of each gene pair in the validation cohort is shown in Supplementary Figure 2C.
Figure 3. Performance in the validation cohort.

(A) Heatmap of the six TSPs votes in the validation cohort. Each pair (bottom) contributes a vote, and the final prediction of each sample is determined by the sum of votes. The true class labels are shown on the left and arranged into two groups: LN negative (blue) and positive (red). The bar plot on the right shows the sum of votes in each sample, with vertical dashed black line representing the classification threshold. Samples with ≤ 2 votes were classified as LN positive (red bars); otherwise, they were classified as negative (blue bars). Different colors between the bar plot on the right and the true class labels on the left indicates misclassification. Contingency table as well as sensitivity, specificity, positive prediction value, negative prediction value and confidence intervals (CI) are indicated on the right. (B) ROC curve of the classifier performance in the validation cohort (RT-PCR). A threshold of two was selected to maximize the sensitivity and specificity. K-TSPs: k-top scoring pairs, AUC: area under the ROC curve.
Decision Curve Analysis
To further assess the potential utility of the signature in preventing patients from undergoing the unnecessary neck dissection, we performed a decision curve analysis (DCA) comparing the net benefit resulting from using the signature with that of performing radical neck dissection for all patients in the validation cohort. As pathologic metastasis is evident in 20–30% of patients with clinically N0 early stage OSCCs and surgical management of the neck is advised when the risk for LN metastasis is higher than 15%42, the threshold probabilities for cervical LN metastasis was limited to a range between 0 and 30%. Notably, the signature shows a consistently superior net benefit across all threshold probabilities of LN metastasis relative to performing neck dissection for all patients (Figure 4). Moreover, using the classifier to predict the status of cervical LN metastasis is estimated to spare the unnecessary overtreatment in over 38% of the patients, without missing any of the node-positive cases.
Figure 4. Decision curve analysis.

Decision curves for the 6-TSPs classifier performance in the independent validation dataset is shown. Left - net benefit of the 6-TSPs classifier relative to performing neck dissection for all patients (Treat all) and no intervention (Treat none). Right - net reduction in intervention (i.e., neck dissections) per 100 patients using the classifier. The X axis shows the threshold probabilities of LN metastasis.
Discussion
Cervical lymph node metastasis remains the most significant poor prognostic factor for patients with OSCC, as it decreases the overall 5-year survival rate by 50% 43, 44. Primary treatment of OSCC is mainly surgical, which includes complete resection of the primary tumor followed by cervical lymph node dissection. Although neck dissection may be therapeutic in cases with clinical evidence of lymph node metastasis, or prophylactic to assure accurate staging, this major surgical procedure is associated with many temporary and permanent complications 45, 46.
As pathologic metastasis is evident in only 20–30% of the early stage (T1/T2 N0) OSCC malignancies with no clinical evidence of cervical metastasis 42, the management of such cases is debatable. Indeed, the decision to perform a neck dissection is mainly based on clinical assessment such as neck palpation, imaging, and overall surgical experience. However, the specificity of the clinical evaluation is only 75% 47. While nearly 90% of the OSCC patients undergo neck dissection to achieve an accurate pathological staging of the neck, according to the 8th edition of the cancer staging manual of the American Joint Committee on Cancer (AJCC), the necessity of neck dissection in clinically T1/T2N0 patients remains uncertain 48. While sentinel lymph node biopsy (SLNB) has lately emerged as a less invasive alternative to elective neck dissection, for floor of mouth tumors, occult metastases are frequently missed, and in SLNB-positive patients a subsequent neck dissection is a second-stage procedure 49. As such, defining more sensitive and specific biomarkers that allow stratifying the risk of nodal disease for OSCC patients would be of great clinical significance.
The biologic process that leads to lymph node metastasis is complex, characterized by molecular and cellular alterations, including global gene expression changes that eventually lead to local cell migration 50. Whole transcriptome analysis, such as microarray and more recently RNA-Seq, have been extensively used to examine the gene expression changes in non-metastatic versus metastatic OSCC samples 23, 51, 52, and a number of multigene signatures that predict locoregional metastasis have been proposed over the past decade 24, 25, 27, 53–57. While these models predicted invasiveness and survival in the studied populations, and added independent information to other established prognostic factors, none has gained traction in clinical practice.
Notably, previous attempts to define gene signature predictive models have mostly relied on individual gene expression values. These signatures are usually platform-dependent and their underlying decision rules require substantial re-calibration efforts when applied to data from different platforms, thus limiting their translational value. For this reason, in our study we used K- TSPs, a non-parametric, rank-based classifier that entirely depends on the relative expression of gene pairs 33, 34. Using this approach, we leveraged datasets obtained with different technologies (i.e, microarrays and RNA-Seq), developing a robust, small, and platform-independent signature to predict LN metastasis in primary early stage OSCC tumors. Most importantly, we show that these simple decision rules can be easily implemented using a rapid and cost efficient RT-PCR assay, further supporting its high translational potential.
Unlike previous classifiers that rely on a substantially larger number of genes, based on the pathological tumor staging, or combine gene expression values with clinicopathological variables 29, 30, our signature is parsimonious, based on the primary clinical staging (enabling clinicians to determine the need for surgical neck dissection at the time of the tumor resection), and highly interpretable. This classifier was achieved by constraining the training process using a set of pre-defined biological mechanisms related to LN metastasis. Specifically, we forced the algorithm to select the final pairs only from a set obtained by coupling genes potentially promoting metastasis, proliferation, and invasion with those counteracting the same processes. This design proved useful at controlling overfitting, increasing robustness, and enhancing interpretability of the resulting signature, although it may be overly simplistic and not entirely capture the inherent complex biology underlying cancer. To this end, while the majority of the classifier pairs show expression patterns consistent with the hypothesized biological constraints, two show some discordance. Despite previous reports indicating a possible oncogenic role for SKI 58 and a tumor suppressor one for PDLIM4 59, in our analysis, their relative expression suggests otherwise. A similar pattern was also observed for the pair involving CTSB and GSTP1, which show oncogenic and tumor suppressor properties, respectively, in the literature 60–62. Such discordances can be attributed to various factors such as the different expression profile of these genes across cancer types, or the heterogeneity of the experimental models used. Additionally, it can also be attributed to complex adjustments in the molecular networks orchestrating cancer invasion and metastasis. Nevertheless, the aim of a classifier is to achieve a high performance at distinguishing the two classes of interest rather than capturing the underlying biology.
This goal was attained as reflected by the high performance of our signature at predicting the LN status in the cohort of 35 patients used for independent validation. Specifically, the signature successfully identified all 19 patients with node-positive disease and 13 out of 16 cases with node-negative disease (with an AUC of 0.89, sensitivity of 100%, and specificity of 81%). Despite the different technology, performance in the PCR validation cohort was highly consistent with that seen in the two training datasets, supporting the reliability of this signature as a potential diagnostic and predictive tool in clinical setting. Moreover, this work underscores the need for further validation in larger cohorts, once more data-sets containing early stage OSCCs with known pathologic LN status will become available.
In conclusion, we have used biologically-constrained models to identify an interpretable and clinic-friendly primary tumor gene signature consisting of six gene pairs that appear capable of predicting the presence of cervical lymph node metastasis in early stage OSCC. The consistent performance of this signature in datasets generated with different technologies highlights its reliability as a diagnostic and predictive tool and underscores the importance of embedding biological knowledge in the training process of cancer predictive models.
Supplementary Material
Novelty and Impact:
In this study we used biologically-constrained models to identify an interpretable and clinic-friendly primary tumor gene signature consisting of six gene pairs that appear capable of predicting the presence of cervical lymph node metastasis in early stage OSCC. The consistent performance of this signature in datasets generated with different technologies highlights its reliability as a diagnostic and predictive tool and underscores the importance of embedding biological knowledge in the training process of cancer predictive models.
Funding:
This work was supported by the NIH grants R01CA200859 (L.M.), R01DE027809 (E.I.), R01DE028674 and U01CA230691 (N.A.) and Specialized Programs of Research Excellence in Human Cancers (SPORE) P50DE019032 (D.S.).
Abbreviations:
- AUC
Area Under the ROC Curve
- EMT
epithelial-mesenchymal transition
- HNSCC
head and neck squamous cell carcinoma
- HPV
human papilloma virus
- K-TSP
K-top scoring pairs
- LN
lymph nodes
- MsigDB
molecular signature database
- OSCC
oral squamous cell carcinoma
- TAGs
tumor associated genes
Footnotes
Ethics Statement: Samples were collected from the Johns Hopkins Head & Neck Database (HAND) following protocols approved by the Institutional Review Boards (IRB). Informed consent was obtained from all subjects involved in the study.
Conflict of Interest: All authors declare no conflict of interest.
Data Availability Statement:
The datasets used in this study are available from both GEO and TCGA using the corresponding accession numbers (GSE65858, GSE42743, TCGA-HNSC). The code used to perform this analysis is freely available using the following link: https://github.com/marchionniLab/OSCC_LN_signature. Further details and other data that support the findings of this study are available from the corresponding author upon request.
References
- 1.Ghantous Y, Abu Elnaaj I. [GLOBAL INCIDENCE AND RISK FACTORS OF ORAL CANCER]. Harefuah 2017;156: 645–9. [PubMed] [Google Scholar]
- 2.Vaughan TL, Stewart PA, Davis S, Thomas DB. Work in dry cleaning and the incidence of cancer of the oral cavity, larynx, and oesophagus. Occup Environ Med 1997;54: 692–5. [DOI] [PMC free article] [PubMed] [Google Scholar]
- 3.Rabinovics N, Mizrachi A, Hadar T, Ad-El D, Feinmesser R, Guttman D, Shpitzer T, Bachar G. Cancer of the head and neck region in solid organ transplant recipients. Head & Neck 2014;36: 181–6. [DOI] [PubMed] [Google Scholar]
- 4.Douglas CM, Jethwa AR, Hasan W, Liu A, Gilbert R, Goldstein D, De Almedia J, Lipton J, Irish JC. Long-term survival of head and neck squamous cell carcinoma after bone marrow transplant. Head & Neck 2020;42: 3389–95. [DOI] [PubMed] [Google Scholar]
- 5.Campbell BR, Chen Z, Faden DL, Agrawal N, Li RJ, Hanna GJ, Iyer NG, Boot A, Rozen SG, Vettore AL, Panda B, Krishnan NM, et al. The mutational landscape of early- and typical-onset oral tongue squamous cell carcinoma. Cancer 2021;127: 544–53. [DOI] [PMC free article] [PubMed] [Google Scholar]
- 6.Kansy K, Thiele O, Freier K. The role of human papillomavirus in oral squamous cell carcinoma: myth and reality. Oral Maxillofac Surg 2014;18: 165–72. [DOI] [PubMed] [Google Scholar]
- 7.Mücke T, Mitchell DA, Wagenpfeil S, Ritschl LM, Wolff K-D, Kanatas A. Incidence and outcome for patients with occult lymph node involvement in T1 and T2 oral squamous cell carcinoma: a prospective study. BMC Cancer 2014;14: 346. [DOI] [PMC free article] [PubMed] [Google Scholar]
- 8.Abu-Ghanem S, Yehuda M, Carmel N-N, Leshno M, Abergel A, Gutfeld O, Fliss DM. Elective Neck Dissection vs Observation in Early-Stage Squamous Cell Carcinoma of the Oral Tongue With No Clinically Apparent Lymph Node Metastasis in the Neck: A Systematic Review and Meta-analysis. JAMA Otolaryngol Head Neck Surg 2016;142: 857–65. [DOI] [PubMed] [Google Scholar]
- 9.Liu X, Lao X, Liang L, Zhang S, Li K, Liao G, Liang Y. Neck observation versus elective neck dissection in management of clinical T1/2N0 oral squamous cell carcinoma: a retrospective study of 232 patients. Chin J Cancer Res 2017;29: 179–88. [DOI] [PMC free article] [PubMed] [Google Scholar]
- 10.Liu J-Y, Chen C-F, Bai C-H. Elective Neck Dissection Versus Observation in Early-Stage (cT1/T2N0) Oral Squamous Cell Carcinoma. Laryngoscope Investig Otolaryngol 2019;4: 554–61. [DOI] [PMC free article] [PubMed] [Google Scholar]
- 11.Cao Y, Wang T, Yu C, Guo X, Li C, Li L. Elective Neck Dissection Versus Wait-and-Watch Policy for Oral Cavity Squamous Cell Carcinoma in Early Stage: A Systematic Review and Meta-Analysis Based on Survival Data. J Oral Maxillofac Surg 2019;77: 2154–67. [DOI] [PubMed] [Google Scholar]
- 12.Bessell A, Glenny A-M, Furness S, Clarkson JE, Oliver R, Conway DI, Macluskey M, Pavitt S, Sloan P, Worthington HV. Interventions for the treatment of oral and oropharyngeal cancers: surgical treatment. Cochrane Database Syst Rev 2011: CD006205. [DOI] [PubMed] [Google Scholar]
- 13.Nahmias C, Carlson ER, Duncan LD, Blodgett TM, Kennedy J, Long MJ, Carr C, Hubner KF, Townsend DW. Positron emission tomography/computerized tomography (PET/CT) scanning for preoperative staging of patients with oral/head and neck cancer. J Oral Maxillofac Surg 2007;65: 2524–35. [DOI] [PubMed] [Google Scholar]
- 14.Sarrión Pérez MG, Bagán JV, Jiménez Y, Margaix M, Marzal C. Utility of imaging techniques in the diagnosis of oral cancer. J Craniomaxillofac Surg 2015;43: 1880–94. [DOI] [PubMed] [Google Scholar]
- 15.Chaukar D, Dandekar M, Kane S, Arya S, Purandare N, Rangarajan V, Deshmukh A, Pai P, Chaturvedi P, D’Cruz A. Relative value of ultrasound, computed tomography and positron emission tomography imaging in the clinically node-negative neck in oral cancer. Asia Pac J Clin Oncol 2016;12: e332–8. [DOI] [PubMed] [Google Scholar]
- 16.Sasahira T, Kirita T. Hallmarks of Cancer-Related Newly Prognostic Factors of Oral Squamous Cell Carcinoma. Int J Mol Sci 2018;19. [DOI] [PMC free article] [PubMed] [Google Scholar]
- 17.van de Vijver MJ, He YD, van’t Veer LJ, Dai H, Hart AAM, Voskuil DW, Schreiber GJ, Peterse JL, Roberts C, Marton MJ, Parrish M, Atsma D, et al. A gene-expression signature as a predictor of survival in breast cancer. N Engl J Med 2002;347: 1999–2009. [DOI] [PubMed] [Google Scholar]
- 18.Erho N, Crisan A, Vergara IA, Mitra AP, Ghadessi M, Buerki C, Bergstralh EJ, Kollmeyer T, Fink S, Haddad Z, Zimmermann B, Sierocinski T, et al. Discovery and Validation of a Prostate Cancer Genomic Classifier that Predicts Early Metastasis Following Radical Prostatectomy. PLoS One 2013;8. [DOI] [PMC free article] [PubMed] [Google Scholar]
- 19.Tonella L, Giannoccaro M, Alfieri S, Canevari S, De Cecco L. Gene Expression Signatures for Head and Neck Cancer Patient Stratification: Are Results Ready for Clinical Application? Curr Treat Options in Oncol 2017;18: 32. [DOI] [PubMed] [Google Scholar]
- 20.Serafini MS, Lopez-Perez L, Fico G, Licitra L, De Cecco L, Resteghini C. Transcriptomics and Epigenomics in head and neck cancer: available repositories and molecular signatures. Cancers Head Neck 2020;5: 2. [DOI] [PMC free article] [PubMed] [Google Scholar]
- 21.Roepman P, Wessels LFA, Kettelarij N, Kemmeren P, Miles AJ, Lijnzaad P, Tilanus MGJ, Koole R, Hordijk G-J, van der Vliet PC, Reinders MJT, Slootweg PJ, et al. An expression profile for diagnosis of lymph node metastases from primary head and neck squamous cell carcinomas. Nat Genet 2005;37: 182–6. [DOI] [PubMed] [Google Scholar]
- 22.Roepman P, Kemmeren P, Wessels LFA, Slootweg PJ, Holstege FCP. Multiple robust signatures for detecting lymph node metastasis in head and neck cancer. Cancer Res 2006;66: 2361–6. [DOI] [PubMed] [Google Scholar]
- 23.Méndez E, Lohavanichbutr P, Fan W, Houck JR, Rue TC, Doody DR, Futran ND, Upton MP, Yueh B, Zhao LP, Schwartz SM, Chen C. Can a metastatic gene expression profile outperform tumor size as a predictor of occult lymph node metastasis in oral cancer patients? Clin Cancer Res 2011;17: 2466–73. [DOI] [PMC free article] [PubMed] [Google Scholar]
- 24.van Hooff SR, Leusink FKJ, Roepman P, Baatenburg de Jong RJ, Speel E-JM, van den Brekel MWM, van Velthuysen M-LF, van Diest PJ, van Es RJJ, Merkx MAW, Kummer JA, Leemans CR, et al. Validation of a gene expression signature for assessment of lymph node metastasis in oral squamous cell carcinoma. J Clin Oncol 2012;30: 4104–10. [DOI] [PubMed] [Google Scholar]
- 25.Wang W, Lim WK, Leong HS, Chong FT, Lim TKH, Tan DSW, Teh BT, Iyer NG. An eleven gene molecular signature for extra-capsular spread in oral squamous cell carcinoma serves as a prognosticator of outcome in patients without nodal metastases. Oral Oncology 2015;51: 355–62. [DOI] [PubMed] [Google Scholar]
- 26.Li G, Li X, Yang M, Xu L, Deng S, Ran L. Prediction of biomarkers of oral squamous cell carcinoma using microarray technology. Scientific Reports 2017;7: 42105. [DOI] [PMC free article] [PubMed] [Google Scholar]
- 27.Mes SW, Te Beest D, Poli T, Rossi S, Scheckenbach K, van Wieringen WN, Brink A, Bertani N, Lanfranco D, Silini EM, van Diest PJ, Bloemena E, et al. Prognostic modeling of oral cancer by gene profiles and clinicopathological co-variables. Oncotarget 2017;8: 59312–23. [DOI] [PMC free article] [PubMed] [Google Scholar]
- 28.Gao J, Tian G, Han X, Zhu Q. Twenty-four signature genes predict the prognosis of oral squamous cell carcinoma with high accuracy and repeatability. Mol Med Rep 2018;17: 2982–90. [DOI] [PMC free article] [PubMed] [Google Scholar]
- 29.Wang S, Li T, Liu H, Wei W, Yang Y, Wang C, Li B, Han Z, Feng Z. A Combined Prediction Model for Lymph Node Metastasis Based on a Molecular Panel and Clinicopathological Factors in Oral Squamous Cell Carcinoma. Frontiers in Oncology 2021;11. [DOI] [PMC free article] [PubMed] [Google Scholar]
- 30.Xa Zhang, Zhang L, Tan X, Lin Y, Han X, Wang H, Ming H, Li Q, Liu K, Feng G. Systematic analysis of genes involved in oral cancer metastasis to lymph nodes. Cellular & Molecular Biology Letters 2018;23: 53. [DOI] [PMC free article] [PubMed] [Google Scholar]
- 31.Liu X, Kolokythas A, Wang J, Huang H, Zhou X. Gene Expression Signatures of Lymph Node Metastasis in Oral Cancer: Molecular Characteristics and Clinical Significances. Curr Cancer Ther Rev 2010;6: 294–307. [DOI] [PMC free article] [PubMed] [Google Scholar]
- 32.Afsari B, Fertig EJ, Geman D, Marchionni L. switchBox: an R package for k–Top Scoring Pairs classifier development. Bioinformatics 2015;31: 273–4. [DOI] [PMC free article] [PubMed] [Google Scholar]
- 33.Geman D, d’Avignon C, Naiman DQ, Winslow RL. Classifying Gene Expression Profiles from Pairwise mRNA Comparisons. Stat Appl Genet Mol Biol 2004;3: Article19. [DOI] [PMC free article] [PubMed] [Google Scholar]
- 34.Tan AC, Naiman DQ, Xu L, Winslow RL, Geman D. Simple decision rules for classifying human cancers from gene expression profiles. Bioinformatics 2005;21: 3896–904. [DOI] [PMC free article] [PubMed] [Google Scholar]
- 35.Johnson WE, Li C, Rabinovic A. Adjusting batch effects in microarray expression data using empirical Bayes methods. Biostatistics 2007;8: 118–27. [DOI] [PubMed] [Google Scholar]
- 36.Subramanian A, Tamayo P, Mootha VK, Mukherjee S, Ebert BL, Gillette MA, Paulovich A, Pomeroy SL, Golub TR, Lander ES, Mesirov JP. Gene set enrichment analysis: A knowledge-based approach for interpreting genome-wide expression profiles. PNAS 2005;102: 15545–50. [DOI] [PMC free article] [PubMed] [Google Scholar]
- 37.Hanahan D, Weinberg RA. The Hallmarks of Cancer. Cell 2000;100: 57–70. [DOI] [PubMed] [Google Scholar]
- 38.Chen J-S, Hung W-S, Chan H-H, Tsai S-J, Sun HS. In silico identification of oncogenic potential of fyn-related kinase in hepatocellular carcinoma: 8. [DOI] [PubMed] [Google Scholar]
- 39.Vickers AJ, Elkin EB. Decision curve analysis: a novel method for evaluating prediction models. Med Decis Making 2006;26: 565–74. [DOI] [PMC free article] [PubMed] [Google Scholar]
- 40.Liberzon A, Subramanian A, Pinchback R, Thorvaldsdóttir H, Tamayo P, Mesirov JP. Molecular signatures database (MSigDB) 3.0. Bioinformatics 2011;27: 1739–40. [DOI] [PMC free article] [PubMed] [Google Scholar]
- 41.Youden WJ. Index for rating diagnostic tests. Cancer 1950;3: 32–5. [DOI] [PubMed] [Google Scholar]
- 42.Yuasa-Nakagawa K, Shibuya H, Yoshimura R, Miura M, Watanabe H, Kishimoto S, Omura K. Cervical lymph node metastasis from early-stage squamous cell carcinoma of the oral tongue. Acta Otolaryngol 2013;133: 544–51. [DOI] [PubMed] [Google Scholar]
- 43.Woolgar JA, Rogers SN, Lowe D, Brown JS, Vaughan ED. Cervical lymph node metastasis in oral cancer: the importance of even microscopic extracapsular spread. Oral Oncology 2003;39: 130–7. [DOI] [PubMed] [Google Scholar]
- 44.Yuen AP-W, Ho CM, Chow TL, Tang LC, Cheung WY, Ng RW-M, Wei WI, Kong CK, Book KS, Yuen WC, Lam AK-Y, Yuen NW-F, et al. Prospective randomized study of selective neck dissection versus observation for N0 neck of early tongue carcinoma. Head & Neck 2009;31: 765–72. [DOI] [PubMed] [Google Scholar]
- 45.Bulsara VM, Worthington HV, Glenny A-M, Clarkson JE, Conway DI, Macluskey M. Interventions for the treatment of oral and oropharyngeal cancers: surgical treatment. Cochrane Database Syst Rev 2018;12: CD006205. [DOI] [PMC free article] [PubMed] [Google Scholar]
- 46.Gane EM, Michaleff ZA, Cottrell MA, McPhail SM, Hatton AL, Panizza BJ, O’Leary SP. Prevalence, incidence, and risk factors for shoulder and neck dysfunction after neck dissection: A systematic review. European Journal of Surgical Oncology 2017;43: 1199–218. [DOI] [PubMed] [Google Scholar]
- 47.Laimer J, Lauinger A, Steinmassl O, Offermanns V, Grams AE, Zelger B, Bruckmoser E. Cervical Lymph Node Metastases in Oral Squamous Cell Carcinoma-How Much Imaging Do We Need? Diagnostics (Basel) 2020;10. [DOI] [PMC free article] [PubMed] [Google Scholar]
- 48.D’Cruz AK, Vaish R, Kapre N, Dandekar M, Gupta S, Hawaldar R, Agarwal JP, Pantvaidya G, Chaukar D, Deshmukh A, Kane S, Arya S, et al. Elective versus Therapeutic Neck Dissection in Node-Negative Oral Cancer. N Engl J Med 2015;373: 521–9. [DOI] [PubMed] [Google Scholar]
- 49.de Bree R, de Keizer B, Civantos FJ, Takes RP, Rodrigo JP, Hernandez-Prera JC, Halmos GB, Rinaldo A, Ferlito A. What is the role of sentinel lymph node biopsy in the management of oral cancer in 2020? European archives of oto-rhino-laryngology : official journal of the European Federation of Oto-Rhino-Laryngological Societies (EUFOS) : affiliated with the German Society for Oto-Rhino-Laryngology - Head and Neck Surgery 2020. [DOI] [PMC free article] [PubMed] [Google Scholar]
- 50.Clasper S, Royston D, Baban D, Cao Y, Ewers S, Butz S, Vestweber D, Jackson DG. A Novel Gene Expression Profile in Lymphatics Associated with Tumor Growth and Nodal Metastasis. Cancer Res 2008;68: 7293–303. [DOI] [PubMed] [Google Scholar]
- 51.Mk H, Prince S, Mohan AM, Krishnan KV, Devi A. Association of Notch4 with metastasis in human oral squamous cell carcinoma. Life Sci 2016;156: 38–46. [DOI] [PubMed] [Google Scholar]
- 52.Zheng X, Pan Y, Chen X, Xia S, Hu Y, Zhou Y, Zhang J. Inactivation of homeodomain-interacting protein kinase 2 promotes oral squamous cell carcinoma metastasis through inhibition of P53-dependent E-cadherin expression. Cancer Sci 2021;112: 117–32. [DOI] [PMC free article] [PubMed] [Google Scholar]
- 53.Nguyen ST, Hasegawa S, Tsuda H, Tomioka H, Ushijima M, Noda M, Omura K, Miki Y. Identification of a predictive gene expression signature of cervical lymph node metastasis in oral squamous cell carcinoma. Cancer Sci 2007;98: 740–6. [DOI] [PMC free article] [PubMed] [Google Scholar]
- 54.Mazzoccoli G, Castellana S, Carella M, Palumbo O, Tiberio C, Fusilli C, Capocefalo D, Biagini T, Mazza T, Lo Muzio L. A primary tumor gene expression signature identifies a crucial role played by tumor stroma myofibroblasts in lymph node involvement in oral squamous cell carcinoma. Oncotarget 2017;8: 104913–27. [DOI] [PMC free article] [PubMed] [Google Scholar]
- 55.Nisa L, Barras D, Medová M, Aebersold DM, Medo M, Poliaková M, Koch J, Bojaxhiu B, Eliçin O, Dettmer MS, Angelino P, Giger R, et al. Comprehensive Genomic Profiling of Patient-matched Head and Neck Cancer Cells: A Preclinical Pipeline for Metastatic and Recurrent Disease. Mol Cancer Res 2018;16: 1912–26. [DOI] [PubMed] [Google Scholar]
- 56.Huang L, David O, Cabay RJ, Valyi-Nagy K, Macias V, Zhong R, Wenig B, Feldman L, Weichselbaum R, Spiotto MT. Molecular Classification of Lymph Node Metastases Subtypes Predict for Survival in Head and Neck Cancer. Clin Cancer Res 2019;25: 1795–808. [DOI] [PMC free article] [PubMed] [Google Scholar]
- 57.Liu KYP, Zhu SY, Brooks D, Bowlby R, Durham JS, Ma Y, Moore RA, Mungall AJ, Jones S, Poh CF. Tumor microRNA profile and prognostic value for lymph node metastasis in oral squamous cell carcinoma patients. Oncotarget 2020;11: 2204–15. [DOI] [PMC free article] [PubMed] [Google Scholar]
- 58.Medrano EE. Repression of TGF-beta signaling by the oncogenic protein SKI in human melanomas: consequences for proliferation, survival, and metastasis. Oncogene 2003;22: 3123–9. [DOI] [PubMed] [Google Scholar]
- 59.Jia Y, Shi H, Cao Y, Feng W, Li M, Li X. PDZ and LIM domain protein 4 suppresses the growth and invasion of ovarian cancer cells via inactivation of STAT3 signaling. Life Sci 2019;233: 116715. [DOI] [PubMed] [Google Scholar]
- 60.Nishikawa H, Ozaki Y, Nakanishi T, Blomgren K, Tada T, Arakawa A, Suzumori K. The role of cathepsin B and cystatin C in the mechanisms of invasion by ovarian cancer. Gynecol Oncol 2004;92: 881–6. [DOI] [PubMed] [Google Scholar]
- 61.Andl CD, McCowan KM, Allison GL, Rustgi AK. Cathepsin B is the driving force of esophageal cell invasion in a fibroblast-dependent manner. Neoplasia 2010;12: 485–98. [DOI] [PMC free article] [PubMed] [Google Scholar]
- 62.Bao W, Fan Q, Luo X, Cheng W-W, Wang Y-D, Li Z-N, Chen X-L, Wu D. Silencing of Cathepsin B suppresses the proliferation and invasion of endometrial cancer. Oncol Rep 2013;30: 723–30. [DOI] [PubMed] [Google Scholar]
Associated Data
This section collects any data citations, data availability statements, or supplementary materials included in this article.
Supplementary Materials
Data Availability Statement
The datasets used in this study are available from both GEO and TCGA using the corresponding accession numbers (GSE65858, GSE42743, TCGA-HNSC). The code used to perform this analysis is freely available using the following link: https://github.com/marchionniLab/OSCC_LN_signature. Further details and other data that support the findings of this study are available from the corresponding author upon request.