

Abstract
Exercise influences metabolic parameters in part by modulating redox stress and as recently suggested, by affecting gut microbiome. However, whether excess endogenous antioxidant potentiates or interferes with the beneficial effects of exercise on gut microbiome is not known. A comparison of the gut microbiome of C57Bl6 (C57/WT) mice to the “stress-less” catalase overexpressing mice models ([Tg(CAT)±] and Bob-Cat), that were either exercised or remained sedentary, showed differences in both alpha and beta diversity. The significant variation was explained by genotypes along with exercise, suggesting a synergistic relationship between exercise and genotypic traits. Linear discriminant analysis effect size, (LEfSe) analysis also revealed differential taxa within the exercised/genotype cohorts in contrast to those within sedentary/genotype cohorts. Functional pathway predictions from PICRUSt2 showed enrichment for the metabolism of short-chain fatty acids, butanoate and propanoate pathways in exercised groups. Spearman correlations between enriched taxa and metabolic parameters showed correlations with body or fat weight in some of the cohorts. However, there were significant correlations of differential taxa among all cohorts against parameters that predict energy metabolism, such as respiratory exchange ratio and energy expenditure. Overall, our study showed that there was a synergistic beneficial influence of antioxidant overexpression and exercise on the gut microbiome.
Keywords: Exercise, Catalase, redox stress, antioxidant, gut microbiome, energy expenditure
INTRODUCTION
The global prevalence of cardiometabolic diseases has increased over the last two decades (Sattar et al., 2020). Increases in the prevalence of obesity and metabolic syndrome have led to highest morbidity and mortality rates in the United States compared to the rest of the world (Shi et al., 2020). This may be attributed to unhealthy behaviors (smoking, physical inactivity) or sociodemographic factors (age, race, etc) that play a role in the development of cardiometabolic diseases. While genetic and environmental factors may contribute to these risks, recent evidence suggests a potential role for the intestinal microbial community in the pathophysiology of cardiometabolic diseases (Guzman-Castaneda et al., 2020; Witkowski et al., 2020).
The expansion of visceral adipose tissue is a major risk factor for obesity and its comorbidities (Neeland et al., 2019). Increased adipose mass also contributes to pro-oxidant and pro-inflammatory states by increasing free radical production(Avila-Escalante et al., 2020). Reactive oxygen species (ROS) alter glucose and lipid metabolism by modulating functional changes in skeletal muscle, adipose tissue, brain, and the newly classified “endocrine organ,” the gut microbiome, all leading to altered energy homeostasis (Gyengesi et al., 2012; Leal et al., 2018; Avila-Escalante et al., 2020). Physical activity has been proven time and again to be the most efficacious preventive approach and recommended therapeutic option for individuals with metabolic disorders due to its weight loss effects (Savini et al., 2013; Golbidi and Laher, 2014; Leal et al., 2018). Physical activity is effective in lowering body weight and fat mass (Leal et al., 2018), as well it improves lipid profile (Sanchis-Gomar et al., 2015) and decreases inflammation (Golbidi and Laher, 2014). Exercise boosts physical performance, and enhances neurological function (Radak et al., 2013). However, paradoxically exercise is beneficial by increasing redox stress, which in turn induces antioxidant defense (Shern-Brewer et al., 1998; Matsumoto et al., 2008; Savini et al., 2013; Done and Traustadottir, 2016). In adipose tissue, moderate exercise regulates the expression and secretion of key adipokines such as leptin and adiponectin (Golbidi and Laher, 2014; Lubkowska et al., 2015) that are involved in regulating energy storage, energy expenditure, and appetite regulation (Oh et al., 2016).
The benefits of physical activity may be due to exercise-induced myokines, adipokines, and other secreted metabolites affecting appetite regulation and energy expenditure (Benite-Ribeiro et al., 2016; Delezie and Handschin, 2018; Leal et al., 2018). Recent studies also suggest an association between the microorganisms residing within the gut and the beneficial effects of exercise (Allen et al., 2015; Zhao et al., 2018b; Mohr et al., 2020). The conclusions from both animal and human studies are that physical activity leads to significant changes in abundance of specific bacterial groups and bacterial related metabolites (Zhao et al., 2018b; Scheiman et al., 2019; Dowden et al., 2020). However, the exercise mediated effects were not attributed to a particular form of exercise, and hence currently, there are no recommendations for such an intervention (Tzemah Shahar et al., 2020). Other studies have shown the skeletal muscle-adipose axis (Leal et al., 2018), adipose-brain axis (Chouchani et al., 2019) and skeletal muscle-brain axis (Delezie and Handschin, 2018) are also involved in improving energy homeostasis. However, it is unknown if gut microbes communicate with these metabolic organs and if gut-derived metabolites are involved in these interactions, or how exercise and/or redox stress modulate these interactions (Allen et al., 2015; Allen et al., 2018). Gaps still exist in our understanding of how exercise modulates gut microbiome, thus leading to metabolic benefits. In particular, it is not fully understood if endogenous redox stress suppression would interfere with exercise mediated effects on gut-adipose crosstalk.
We recently developed a novel obese mouse model overexpressing the antioxidant catalase (Bob-Cat) that had improved overall energy metabolism by lowering redox stress (Amos et al., 2017). We additionally showed that this “stress-less” mouse model (so called due to less oxidative stress in these mice) potentiated the beneficial effects of an omega 3 enriched fatty acid diet by inducing G-protein coupled receptor 120-Nuclear factor erythroid 2 (GPR120-Nrf2) crosstalk (Amos et al., 2019). Very little is known at the current time about the relationship between redox stress and the diversity and function of the microbiome, but it is evident that specific species of bacteria use ROS as defense mechanisms (Gyuraszova et al., 2017; Yardeni et al., 2019) and other species can produce antioxidants that scavenge free radicals (Hu et al., 2019). Additionally, some studies suggest that the gut microbiome can be altered depending on the redox state (Staerck et al., 2017; Borrelli et al., 2018). Therefore, in order to better understand the interplay between redox regulation and exercise intervention on the gut microbiome and its potential effects in improving energy homeostasis, we subjected the catalase-overexpressing ‘stress-less’ (Bob-Cat and [Tg(CAT)±]), C57/WT, and obese (Ob/Ob) mice to a moderate exercise regimen and analyzed their gut microbial community structure and their functions. Our studies showed antioxidant overexpression in combination with exercise shifted the gut microbiome toward taxa with known beneficial effects.
RESULTS
Impact of Exercise on Microbial Composition and Predicted Function
Alpha Diversity
Redox stress can have a direct influence on gut microbiota (Gyuraszova et al., 2017) and antioxidants prevent this (Yardeni et al., 2019). Nonetheless, there are no studies that we know of that investigated the synergistic effect of exercise and antioxidant overexpression on the composition and function of the gut microbiome. In this study, catalase-overexpressing mice (Amos et al., 2017; Amos et al., 2019) were subjected to 8 weeks of moderate exercise. Alpha diversity of the gut microbiome was analyzed to examine differences in community diversity based on genotype (catalase-overexpressing vs. wildtype mice) and exercised vs. sedentary. Though alpha diversity did differ among the cohorts, none of these differences were significant (Figure 1).
Figure 1. Boxplot of microbiome alpha diversity.

A boxplot of the alpha diversity measured by the Observed Features metric as implemented in QIIME1 for the exercise and sedentary groups of all samples (n≥27). A two-sample t-test and non-parametric Monte Carlo permutations (n = 999) were used for statistical analysis (p≤0.05).
β Diversity
Genotype and Exercise Status Analysis
Exercise is also known to impact bacterial species composition. Pairwise comparisons between exercised and sedentary groups revealed significant clustering (Analysis of similarities-ANOSIM p<0.05), suggesting a shift in microbial community composition dependent on exercise. Further analysis compared the genotypes of sedentary (Figure 2A) and exercised (Figure 2B) samples, revealing significant clustering among the genotypes (ANOSIM p=0.001), indicating a defined microbial community composition based on genotype. Furthermore, significant clustering based on exercised vs. sedentary regimens within each genotype was observed for all genotypes: C57/WT: ANOSIM p= 0.031, [Tg(CAT)±]: ANOSIM p= 0.025, Bob-Cat: ANOSIM p= 0.033, and Ob/Ob: ANOSIM p= 0.021 (Figure 3A–D). Therefore, our data show evidence of a defined microbial community composition within exercised and sedentary mice of each respective genotype. Furthermore, Adonis tests revealed genotype and exercise in conjunction with each other explained a significant amount of variation among all samples (Adonis p=0.04, R2=0.04). However, genotype by itself explained more (Adonis p=0.0007, R2=0.08).
Figure 2. β-Diversity plots and Firmicutes to Bacteroidetes ratio of sedentary and exercised mice.

PCoA plots of phylogenetic differences in microbial community composition between sequenced sedentary and exercised samples. (A) C57/WT (blue), [Tg(CAT)±] (orange), Bob-Cat (red), and Ob/Ob (green) sedentary mice groups and (B) of each respective exercised cohort, is displayed in the images showing a defined microbial community composition within each genotype (ANOSIM, p≤ 0.05). (n≥6). (C) Changes in Firmicutes to Bacteroidetes ratio observed in all genotypes.
Figure 3. β-Diversity plots per genotype.

PCoA plots of phylogenetic differences in microbial community composition between sequenced sedentary and exercised samples per mouse genotype. (A) C57/WT, (B) [Tg(CAT)±], (C) Bob-Cat, and (D) Ob/Ob mice groups (sedentary depicted as lighter shade and exercise depicted as darker shade of colored dots) as displayed in the images show a defined microbial community composition within each E and S group of each genotype (ANOSIM p< 0.05), (n≥6).
Changes in Firmicutes to Bacteroidetes ratios were also observed based on exercise intervention, with the median ratio decreasing in all genotypes following exercise treatment (Figure 2C). In particular, the [Tg(CAT)±] genotype had the greatest median decrease (0.45), while Ob/Ob genotype had the smallest (0.04). However, none of the genotypes experienced a significant decrease in the Firmicutes to Bacteroidetes ratio after exercise.
Taxa LEfSe Analysis
LEfSe analysis plots show significantly enriched bacteria within the sedentary and exercised cohorts of each mouse model (Figure 4A–D). All four comparisons yielded differential taxa. A total of 18 significantly differential taxa between C57/WT sedentary and exercised cohorts were observed (Figure 4A). For the [Tg(CAT)±], LEfSe analysis only showed a total of 9 significantly different taxa when comparing the exercised and sedentary mice, the fewest differential taxa of all experimental groups (Figure 4B). Within the Bob-Cat mice groups, LEfSe analysis determined a total of 17 significantly differential taxa between the sedentary and exercised cohorts (Figure 4C). Lastly, within the obese (Ob/Ob) mice groups there was a total of 26 significantly differential taxa between the exercised and sedentary cohorts (Figure 4D), meaning this genotype yielded the greatest number of differential taxa. In general, the greatest number of differential taxa were observed within the genotype/exercised comparisons as well as in the across-genotype comparisons, in contrast to the differential taxa observed within the genotype sedentary vs exercised comparisons (Supplemental Figures 1–5).
Figure 4. LEfSe analysis of taxa within all genotypes between exercised and sedentary cohorts.

Linear discriminant analysis (LDA) scores derived from LEfSe analysis showing the biomarker taxa (log LDA score) ≥ 2.0 and significant at p≤0.05) of (A) C57/WT, (B) [Tg(CAT)±], (C) Bob-Cat, and (D) Ob/Ob mice groups (green- sedentary; red-exercise) determined by Kruskal–Wallis), (n≥7).
Correlations between enriched taxa and metabolic parameters
Spearman correlations were detected between enriched taxa and metadata parameters for all eight cohorts (Figures 5–6). The observed features metric had several significant correlations with weight parameters, but it was only negatively correlated with fat pad (adipose) weight in Bob-Cat exercised. It was positively correlated with adipose weight in both [Tg(CAT)±] sedentary and Ob/Ob exercised. Therefore, richness does not appear to have had a consistent relationship with host metabolic parameters across the cohorts. Additionally, very few parameters differed significantly (t-test, p≤0.05) within the same genotype between exercised and sedentary (Supplemental information and Supplemental Figure 6) cohorts.
Figure 5. Significant correlations (Spearman, p≤0.05) among metabolic metadata and enriched taxa.

Both taxa enriched in the Exercised and Sedentary cohort were included in the analysis for their respective genotypes. Positive correlations are shown in blue, and negative correlations are shown in red, with the darkness of the squares indicating the strength of the correlations. Correlations were calculated through the hmisc package and visualized using the ggcorrplot package in R. (A) C57/WT Sedentary. (B) C57/WT Exercised. (C) Ob/OB Sedentary. (D) Ob/Ob Exercised mice groups.
Figure 6. Significant correlations (Spearman, p≤0.05) among metabolic metadata and enriched taxa for the [Tg(CAT)±] and Bob-Cat cohorts.
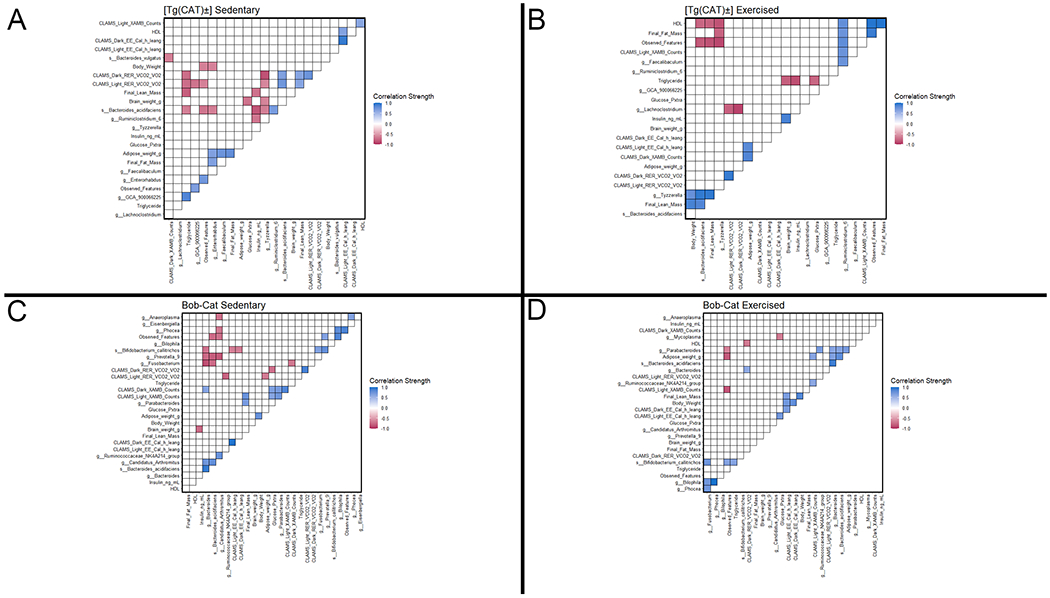
Both taxa enriched in the Exercised and Sedentary cohort were included in the analysis for their respective genotypes. Positive correlations are shown in blue, and negative correlations are shown in red, with the darkness of the squares indicating the strength of the correlations. Correlations were calculated through the hmisc package and visualized using the ggcorrplot package in R. (A) [Tg(CAT)±] Sedentary. (B) [Tg(CAT)±] Exercised. (C) Bob-Cat Sedentary. (D) Bob-Cat Exercised mice groups.
Correlations between enriched taxa and CLAMS parameters:
Enriched taxa for exercised vs sedentary groups had significant correlations with CLAMS data in each cohort, except for Ob/Ob S. Across all cohorts, Respiratory Exchange Ratio (RER) during the light period had the greatest number of significant (p≤0.05) bacterial correlations (8 with individual taxa and one with richness), and EE (also during the light period) had the fewest. Lachnoclostridium had the greatest number of significant correlations (n=3), with those correlations being negative with both Dark and Light RER in [Tg(CAT)±] exercised and positive with X-Ambulatory (XAMB) counts during the Dark period in [Tg(CAT)±] sedentary. Considering just correlations in exercised groups between genera and species enriched in those groups, there were eleven significant correlations between those taxa and CLAMS measurements and twenty-four correlations in sedentary.
PICRUSt Pairwise LEfSe Analysis
To determine the predicted function of each mouse gut microbiome, PICRUSt2 functional predictions were generated from 16S data for each fecal sample and analyzed with LEfSe (Figure 7). We observed a total of 3 significantly differential functional pathways between the sedentary and exercised cohorts of the C57/WT genotype. Of the remaining cohorts, the Bob-Cat genotype had the fewest number of predicted functional pathways with 12. LEfSe analysis distinguished 19 significantly differential functional pathways between the [Tg(CAT)±] sedentary and exercised cohorts, and analysis of the Ob/Ob groups showed a total of 15 significantly differential functional predictions between the sedentary and exercised cohorts. Notably, the protein export (ko03060) pathway was predicted to be enriched in three of the four exercise groups. Furthermore, the exercised cohorts for both of the obese groups (Bob-Cat and Ob/Ob) were predicted to be enriched for the metabolism of short chain fatty acids, propanoate (ko00640) and butanoate (ko00650) respectively.
Figure 7. Predicted function LEfSe analysis.

Linear discriminant analysis (LDA) scores derived from LEfSe analysis showing differential PICRUSt2 predicted pathways (log LDA score ≥2.0) and significant at p≤0.05) of (A) C57/WT, (B) [Tg(CAT)±], (C) Bob-Cat, and (D) Ob/Ob mice groups (green-sedentary; red-exercise) determined by Kruskal—Wallis. (n≥7)
DISCUSSION
The gut microbiome is considered an endocrine organ (Clarke et al., 2014a), due to its functional effects on energy metabolism through crosstalk with other metabolic tissues. The gut microbiome is altered by exercise (Denou et al., 2016; Estaki et al., 2016; Monda et al., 2017; Barton et al., 2018) and has been shown to be significantly different in obese vs. lean humans and rodents (Turnbaugh et al., 2009). Numerous studies have shown shifts in the taxa and function of the gut microbiome as a result of physical activity in both humans and mice (Denou et al., 2016; Monda et al., 2017; Chen et al., 2018). Exercise has shown to increase species richness, the number of beneficial microbes, the microflora diversity, and the abundance of commensal bacteria (Monda et al., 2017). One of the key mechanisms by which exercise is beneficial and improves metabolic health is paradoxically by promoting oxidative stress, which then induces antioxidant defense (Meilhac et al., 2001; Fernandes et al., 2020). Hence blocking redox stress might interfere with the beneficial effects of exercise. Our studies investigated the influence of endogenous antioxidant overexpression (catalase overexpressing mice-[Tg(CAT)±] and Bob-Cat) in combination with exercise on gut microbiome. In concordance with the previously published studies on exercise and gut-microbiome, we observed significant shifts in the microbiome. Although we only saw slight differences in alpha diversity (species richness) between respective cohorts, highly significant differences in β diversity (bacterial community composition) were seen among exercised and sedentary groups, as well as in mice overexpressing catalase on both sedentary and exercise regimens (ANOSIM p≤0.05). The median Firmicutes to Bacteroidetes ratio was decreased in all genotypes, in the exercise group as well, though not significantly, which is concordant with past studies. Higher values for Firmicutes to Bacteroidetes ratio have been associated with obesity (Magne et al., 2020). Therefore, this decrease could be indicative of improved fitness due to exercise.
A significant clustering based on exercise was observed in every genotype, which suggests that the presence and abundances of bacteria differed, as has been found in other exercise studies (Clarke et al., 2014b; Evans et al., 2014). Furthermore, genotype and exercise appear to have had some synergistic effects for shaping the microbiome, as Adonis revealed a significant amount of variation in conjunction with each other. LEfSe analysis revealed significantly enriched bacterial taxa within the respective sedentary and exercised cohorts. Correlation analysis with taxa enriched in the exercise cohorts of the catalase overexpressing genotypes revealed significant correlations potentially indicative of beneficial bacteria activity. Genotype and exercise appear to have had a large impact on bacterial community composition, despite a lack of consistent significant differences among metabolic metadata between sedentary and exercised groups within each genotype. Furthermore, there was a significant amount of variation explained by the genotypes along with exercise, suggesting there is synergetic relationship between exercise and genotype effects.
Bacteroides acidifaciens is enriched post-exercise for both catalase over-expressing genotypes. Bacteroides acidifaciens has been found to help prevent obesity in mice by improving insulin sensitivity and energy metabolism (Yang et al., 2017). Bacteroides acidifaciens was negatively correlated with adipose weight in sedentary [Tg(CAT)±], but positively correlated with lean mass in [Tg(CAT)±]. Interestingly, Bacteroides acidifaciens was significantly negatively correlated with HDL in exercised [Tg(CAT)±]. Additionally, Bacteroides acidifaciens was also enriched in the comparison between C57/WT exercised and the Ob/Ob exercised groups. Taken together, in our study Bacteroides acidifaciens was associated with both exercise and beneficial genotypes (as opposed to the obese Ob/Ob genotype). Therefore, these correlations suggest that Bacteroides acidifaciens was beneficial to our mice.
In Bob-Cat group but not in Ob/Ob mice, both Bacteroides and Parabacteroides were correlated with physical activity (CLAMS metadata) in the sedentary group possibly indicating that mice with a greater abundance of those taxa were more energetic. Specifically, Bacteroides was positively correlated to Dark XAMB counts and Parabacteroides (which also altered in exercised Bob-Cat) was positively correlated to both Dark and Light XAMB counts in addition to lean mass. Previous studies have indicated possible beneficial effects of Parabacteroides. For example, Parabacteroides became abundant in another study after 12-week of high-intensity interval training in patients with celiac disease (Warbeck et al., 2020) and with exercise intervention in male Wistar rats on high-fat diet (Carbajo-Pescador et al., 2019). Parabacteroides has also been positively correlated with beneficial metabolites and weight loss in a rat model and negatively correlated with both body weight and leptin in the same model, suggesting it could have a protective effect against obesity (Carbajo-Pescador et al., 2019). However, Bacteroides, Parabacteroides and Bacteroides acidifaciens were positively correlated with adipose weight in exercised Bob-Cat, which could be an artifact of these beneficial bacteria becoming more abundant due to exercise, as the correlations with adipose weight were only observed post-exercise. Therefore, the enrichment of these bacteria in exercised Bob-Cat but not exercised Ob/Ob group, raises the possibility that the combination of a beneficial genotype in addition to exercise yielded more host-favorable microbial shifts than just exercise alone.
In [Tg(CAT)±] mice, Tyzerella was negatively correlated with final fat in the exercise cohort and glucose in the sedentary cohort. However, it is important to note that Tyzzerella has previously been associated with negative health outcomes, namely cardiovascular disease(Kelly et al., 2016), while the use of the lipid lowering drug, simvastatin, lowered it (Zhang et al., 2020). This taxa is also regulated by dietary quality (Liu et al., 2019) and oxidative stress (Zhao et al., 2018a) and in one study, it was positively correlated with repeated use of antibiotics and childhood adiposity (Chen et al., 2020). Contrarily though, Tyzzerella was found to be more prevalent in the healthy patient group in a scoliosis study (Shen et al., 2019), suggesting that it is not always associated with poor host health. Taken together then, although our measures of fitness did not differ significantly based on exercise, these correlations indicate that they both changed with exercise to some extent and in concordance with the abundance of these bacteria, potentially giving a direct link between exercise-induced changes in the microbiome and additional health benefits.
Other correlations indicative of beneficial bacterial activity were also detected in both the catalase and non-catalase groups. C57/WT sedentary group had a negative correlation between adipose weight and Ruminiclostridum 5, which was previously shown to be positively correlated with butyrate (Song et al., 2018). This correlation, along with the previously mentioned correlations in sedentary Bob-Cat, suggests that beneficial bacterial activity was occurring even prior to the exercise treatment. Correlations with CLAMS data provide further evidence that bacteria impacted host health in conjunction with exercise treatment. Negative correlations of Lachnoclostridium with the ratio of VCO2 to VO2 in both dark and light periods for the exercised [Tg(CAT)±] group are indicative of it benefitting its hosts. Notably, Lachnoclostridium was enriched in one study in mice given Resveratrol, a polyphenol that was being investigated for potential anti-obesity effects (Yang et al., 2015). However, in another study, Lachnoclostridium was correlated with reduced exercise capability in elderly humans (Cho et al., 2020). Lastly, Ruminococcaceae NK4A214 group had a significant positive correlation with XAMB in the light period in Bob-Cat mice.
The predicted functional analysis also yielded evidence of direct beneficial bacterial activity in conjunction with exercise. Namely, some of the predicted functional changes could have potentially benefitted the hosts. Both butanoate (ko00650 enriched in Ob/Ob E) and propanoate (ko00640 enriched in Bob-Cat E) are beneficial to human health (Hosseini et al., 2011) and (Canani et al., 2011). Additionally, several pathways involved in mitochondrial function such as oxidative phosphorylation, energy metabolism as well as the pathway “metabolism of cofactors and vitamins” are enriched in the exercised [Tg(CAT)±] group which could be beneficial to the host (Rowland et al., 2018). This may be reflective of the increase in the abundance of the Ruminococcaceae family post-exercise, in the catalase overexpressing mice which are shown to be influenced by the mitochondrial redox state (Yardeni et al., 2019). Though interesting, these results must be interpreted cautiously as they are only predictive pathways.
Our results additionally provide evidence that exercise benefits the hosts by depleting bacteria associated with obesity. Bacteroides vulgatus was enriched in the sedentary group for the [Tg(CAT)±] and Ob/Ob genotypes. A prebiotics study in overweight and obese children found B. vulgatus was significantly correlated with fat and found to be depleted following the intervention (Nicolucci et al., 2017). Exercise also decreased B. vulgatus in a mouse model of colitis (Cho et al., 2020). This suggests that B. vulgatus is associated with obesity and that a decrease in its prevalence via exercise signifies an improvement in host health, as seems to have also been the case in our study. Unsurprisingly, many of the other bacteria enriched in the sedentary groups have also been previously associated with obesity. As another example, within the Bob-Cat samples, Fusobacterium was enriched in the sedentary group. It has been previously noted to be more abundant in obese Japanese populations compared to lean populations (Andoh et al., 2016). Therefore, exercise seems to have both increased the abundance of potentially beneficial taxa and decreased the abundance of taxa previously linked to obesity.
CONCLUSION
In this study, we comprehensively examined the synergistic effects of exercise and catalase overexpression in a novel “stress-less” mouse model (Figure. 8). Analysis of the gut microbiome revealed definite shifts within each genotype following exercise, with the catalase overexpressing groups seeing an enrichment of beneficial bacteria. There is evidence in the literature where catalase is shown to eliminate redox stress and modulate microbiota in shrimp (Yang et al., 2015) and may be a key player in mitochondrial redox status altering gut microbiome (Yardeni et al., 2019). These findings mandate additional studies on the role of redox stress and exercise in energy homeostasis by further correlating metadata to microbial species and conducting fecal transfer to determine if the gut microbes from our novel mouse model alter phenotypic and metabolic characteristics in other mice models with chronic diseases (Ex. Diet-induced obesity, neurodegenerative models, cancer models, etc.) in addition to metatranscriptomic analysis to determine if the trends in bacterial community composition and predicted function still hold when the active community is considered.
Figure 8: Synergistic effects of exercise and catalase overexpression on microbial function:

Enrichment of beneficial bacteria and predicted microbial functional enrichment in catalase overexpressing mice that were exercised compared to sedentary.
MATERIALS AND METHODS
Mouse Models and Exercise
Catalase Transgenic ([Tg(CAT)±]) mice (a generous gift of breeding pair from Drs. Arlan Richardson and Holly Van Remmen at the University of Texas Health Sciences Center in San Antonio, TX) (Chen et al., 2004) are bred and housed in Marshall University Animal Facility. “Bob-Cat” mice are a novel mouse model generated and bred in our laboratory by crossing [Tg(CAT)±] mice with leptin deficient, Ob/+, heterozygous hybrids of the Ob/Ob leptin-resistant mice (heterozygous JAX 000632, B6.Cg-Lepob/J) (Amos et al., 2017). C57Bl6 (C57/WT), [Tg(CAT)±], Bob-Cat, and Ob/Ob male mice were housed in cages of 3 or 4 according to their respective genotypes. WT mice were bred at our animal facilities or bought from Hilltop Laboratories and acclimated to the mouse facilities at Marshall University. Every group was fed normal rodent chow (NC - Lab Diet 5001) ad libitum. All guidelines were followed according to IACUC rules and regulations in accordance with the approved study protocol. The sample sizes of each genotype were the following: C57/WT (n=23), [Tg(CAT)±] (n=24), Ob/Ob (n=18), and Bob-Cat mice (n=23). Each of the four mice models were divided into exercise (n=42) and sedentary groups (n=46) at the age of 16 weeks which is representative of a mature adult human 20-30 years of age (Jackson et al., 2017). Sedentary mice remained in their respective cages in the same environment as the exercised mice. Exercised mice were subjected to a 5-day acclimation period to the treadmill (Columbus Instruments, Columbus, OH, USA) prior to beginning of the exercise protocol: 8 weeks of treadmill exercise, 5 days/week for 30 min. at a rate of 15 m/min during the light cycle. This protocol was based on physical activity level recommendations by the American Heart Association and World Health Organization (Organization, 2019). Animals were treated in compliance with Marshall University Animal Committee (Institutional Animal Care and Use Committee) regulations.
Body Weight and Body Composition
Body mass (g) was measured for 8 consecutive weeks to determine differences in total body weights between groups: C57/WT, [Tg(CAT)±], Bob-Cat, and Ob/Ob (sedentary and exercised) throughout the study. Body composition (fat and lean mass) was determined using magnetic resonance imaging with an ECHO-MRI (Houston, TX). Each mouse was individually placed into the MRI machine, and at least three measurements were taken per mouse. Median values of each parameter per mouse were used for statistical analysis.
Comprehensive Laboratory Animal Monitoring System (CLAMS)
Metabolic parameters were determined indirectly by assessing oxygen (O2) consumption (VO2) and carbon dioxide (CO2) production, respiratory exchange ratio (CO2/O2) (RER), food intake (FI), Energy Expenditure (EE), as well as X-Ambulatory counts (XAMB - physical activity) using the CLAMS (Columbus Instruments, Columbus, OH, USA). Mice were supplied with ground rodent chow (Lab Diet 5001) during the three days of CLAMS analysis. Computations were made based on the middle 48 hours that the mice were subjected to the analyses, which was approximately from 0600 hours of the first day to the 0600 hours of the third day. Food intake was measured by CLAMS as chow displaced from the food hopper. RER was calculated as the ratio of production CO2 and O2 consumption. EE (heat production) was calculated as the Cal/h/lean mass (g). EE average, RER average, average FI per day, as well as X-Ambulatory locomotor activity per day (XAMB – counts of movement across the cage) were determined for each mouse in all groups. One and two-way ANOVA were used to determine comparative changes between the various genotypes on the sedentary or exercise regimen.
Blood and Tissue Collection
At the end of the 8 weeks of study intervention, mice were fasted overnight. After 12 hours of fasting, mice were anesthetized using Isoflurane. Blood was obtained by cardiac puncture and placed in heparin tubes; red blood cells (RBCs) and plasma were separated by centrifugation for 10 min. Mice were perfused intracardially with cold 1X PBS. Tissues, including skeletal muscle, adipose tissue, brain, and liver were removed, weighed, and flash frozen in liquid nitrogen. All tissues were stored at −80°C for future use.
Circulating metabolic parameters
Whole blood was used to measure fasting glucose levels (Precision Xtra Glucometer) then centrifuged for 10 min at 1000xg. to separate the plasma and RBCs. Approximately 35 μL of plasma was placed on a Cholestech cassette and read on a LDX Cholestech Machine (Cholestech Corporation, Hayward, CA) to determine lipid profile including High Density Lipoprotein (HDL) levels. The remaining plasma was frozen at −80°C. Triglyceride (TG) levels were measured in blood plasma using the Triglyceride Colorimetric Assay Kit (Cayman Chemicals, Ann Arbor, MI). Plasma insulin was analyzed using an ultrasensitive mouse Insulin ELISA Kit (Crystal Chem, Downers Grove, IL). The end point colorimetric assays were read using a BioRad Benchmark Plus microplate reader (BioRad, Hercules, CA).
Statistics for Metabolic Metadata
Results are presented as mean ± standard error of the mean (S.E.M.). Only the 78 mice that had measurements for all metadata were included in this analysis. Data were evaluated by two-way ANOVA tests followed by pairwise two-sided t-tests with correction using R 3.5.3. Statistical significance was accepted at p≤0.05.
Microbiome Sequencing:
(i). Microbial DNA Extraction and Quantification
Fecal samples were collected at the 8-week time point which correlated with the final analysis by ECHO-MRI and immediately frozen until they were shipped to Wright Labs, LLC (Huntingdon, PA). Nucleic acid extractions were performed on approximately 0.25 g of each sample using a Qiagen DNeasy Powersoil DNA Isolation kit following the manufacturer’s instructions (Qiagen, Frederick, MD). The lysing step was performed using a Disruptor Genie cell disruptor (Scientific Industries). Genomic DNA was eluted in 50 μl of 10 mM Tris followed by quantification using a Qubit 2.0 Fluorometer (Life Technologies, Carlsbad, CA) with the double stranded DNA high sensitivity assay.
(ii). PCR Amplification
Illumina iTag Polymerase Chain Reactions (PCR) were performed based on the Earth Microbiome Project’s 16S rRNA amplification protocol (Walters et al., 2016) where the hypervariable V4 region of the 16S rRNA gene was amplified by PCR using bar-coded universal primers. The volume of each reaction was 25 μL containing the final concentration of 1X PCR buffer, 0.8 mM dNTP’s, 0.625 U Ex Taq DNA Polymerase (Takara), 0.2 μM 515F forward primer, 0.2 μM 806R barcoded reverse primer and approximately 10 ng of template DNA per reaction. PCR was performed using a T100 Thermal Cycler (Bio-Rad, Hercules, CA) using the following cycling conditions: 98°C for 3 min., 35 cycles of 98°C for 1 min., 55°C for 40 s, 72°C for 1 min, and the final extension was at 72°C for 10 min. PCR products were held at 4°C. A 2% pre-stained agarose E-Gel (Thermo Fisher Scientific) was used to visualize the PCR products for bands at approximately 400 bp.
(iii). Library Purification, Verification, and Sequencing
PCR products were combined (pooled) in an approximately equimolar manner and run on a 2% agarose gel with Gel Star Nucleic Acid Gel Stain (Lonza) for visualization. Bands of expected product length were cut from the gel using sterile scalpels and subsequently purified using the QIAquick Gel Purification Kit (Qiagen, Frederick, MD). The purified library was then quantified using the Qubit 2.0 Fluorometer double stranded DNA high sensitivity assay (Life Technologies, Carlsbad, CA). Finally, each library on the sequencing run was combined (multiplexed) into one sequencing library in a roughly equimolar ratio. Libraries were quality checked using a 2100 Bioanalyzer high sensitivity DNA analysis kit (Agilent Technologies, Santa Clara, CA) prior to sequencing. The sequencing library was stored at −20°C until shipment on dry ice to Laragen Inc (Culver City, CA) for sequencing.
Library pools were size verified using the Fragment Analyzer on the ABI3730 and were quantified with a KAPA Library quantification kit (Kapa Biosystem, Wilmington, MA, USA). After dilution with EBT (Illumina) to a final concentration of 2 nM, containing 15% PhiX V3 library control (Illumina, San Diego, CA, USA), the library pools were denatured for 5 min. in an equal volume of 0.2 M NaOH, then further diluted to 8 pM in HT1 buffer (Illumina) and were sequenced using an Illumina MiSeq V2 500 cycle kit cassette with 16S rRNA library sequencing primers set for 250 basepair, paired-end reads. Overall sequencing run performance was evaluated by determining if the sequencing run met the Illumina specifications for quality scores and data output. Actual run performance varied based on sample type, quality, and clusters passing filter. Specifications were based on the Illumina PhiX control library at supported cluster densities.
(iv). Quality Filtering and OTU Picking
Paired-end sequences were merged and quality filtered through QIIME2’s (Bolyen et al., 2019) implementation of the Dada2 pipeline (Callahan et al., 2016), with a truncation length of 253 and a maximum expected error of 0.5. Taxonomy assignment was performed on the resulting amplicon sequence variants (ASVs) using release 138 of the Silva database (Yilmaz et al., 2014; Henderson et al., 2019) with a Naïve Bayes classifier through Qiime2. The resulting table with taxonomy was exported from QIIME2’s artifact format to biom format for use with QIIME-1.9.0 (Caporaso et al., 2010; Caporaso et al., 2011).
(v). Alpha Diversity Comparisons (16S)
Alpha diversity refers to within sample diversity. Accordingly, alpha diversity box plots were generated within QIIME-1.9.0 using an unrarified ASV table to examine potential differences among samples when grouped by genotype and exercise status. Samples with less than 10,000 sequences per sample were excluded from alpha diversity analyses. Multiple rarefactions were conducted on sequences across all samples to a maximum depth of 10,000 sequences, with a step size of 1,000, and 20 iterations at each step. Alpha diversities were then collated and plotted and compared using a two-sample t-test and non-parametric Monte Carlo permutations (n = 999). Alpha diversity was correlated with metabolic metadata for the 78 samples that had values for all measurements.
(vi). Beta Diversity Comparisons (16S)
Beta diversity refers to differences between samples. Principal coordinates analyses (PCoA) plots and Adonis tests for significance were generated from a weighted UniFrac distance matrix made within QIIME 1.9.0 from a CSS normalized OTU table (Damgaard et al., 2018) to determine if samples tended to have smaller differences if they shared the same genotype and exercise status. The ratio of Firmicutes to Bacteroidetes was also calculated for all samples using raw counts from a phylum level summarized OUT table.
(vii). Linear discriminant analysis Effect Size (LEfSe) Enrichment Plots
Relative abundances of bacterial taxa summarized at the species level were multiplied by one million and formatted as described in Segata et al. (Segata et al., 2013). Comparisons were made between exercised and sedentary groups within each genotype to identify differentially abundant taxa. P values less than or equal to 0.05 were considered significant. Linear Discriminant Analysis (LDA) scores greater than 2.0 are displayed. Within each cohort, enriched taxa were correlated with metabolic metadata (Spearman, p≤0.05) for the mouse samples that had values for all measurements, and significant correlations were visualized as correlograms through R using the hmisc (Harrell, 2020) and ggcorrplot (kassambara, 2019) packages.
(viii). PICRUSt Enrichment Plots
Phylogenetic Investigation of Communities by Reconstruction of Unobserved States (PICRUSt2) functional predictions (Douglas et al., 2020) were generated from the previously created ASV table. Relative abundances of level 3 summarized predicted functional pathways were multiplied by 1 million and formatted as described in Segata et al. (Segata et al., 2013). Comparisons were made with samples grouped by genotype and exercise treatment (“Class”). P values less than or equal to 0.05 were considered significant. LDA scores greater than 2.0 are described.
Supplementary Material
Originality-Significance Statement:
Redox regulation of gut microbiome has not been previously studied. This study uses the “stress-less” mouse model to study the influence of “antioxidant excess” on the beneficial effects of exercise on gut microbiome.
ACKNOWLEDGEMENTS
The authors acknowledge Jung Han Kim, Shekhar Mohan, Holly Cyphert, Kristeena Ray, Carla Cook, Tanner Robinson, Sarah Marshall, Alex Sommerville, Aaron Roberts, Garrett McCormick, Emily Norris, Hugo Gutierrez and Jaewoo Kim, for their aid in experimental procedures, animal tissue collection and data analysis.
FUNDING
This study was partially supported by NIH Grant 5R01HL-074239 (NS), 5P20GM103434 (NS), 1R15AG051062-01 (NS), and WV-NASA Grant Consortium NNX15AI01H (DA).
Footnotes
All authors have no conflict of interest.
REFERENCES:
- Allen JM, Mailing LJ, Niemiro GM, Moore R, Cook MD, White BA et al. (2018) Exercise Alters Gut Microbiota Composition and Function in Lean and Obese Humans. Med Sci Sports Exerc 50: 747–757. [DOI] [PubMed] [Google Scholar]
- Allen JM, Berg Miller ME, Pence BD, Whitlock K, Nehra V, Gaskins HR et al. (2015) Voluntary and forced exercise differentially alters the gut microbiome in C57BL/6J mice. J Appl Physiol (1985) 118: 1059–1066. [DOI] [PubMed] [Google Scholar]
- Amos D, Cook C, and Santanam N (2019) Omega 3 rich diet modulates energy metabolism via GPR120-Nrf2 crosstalk in a novel antioxidant mouse model. Biochim Biophys Acta Mol Cell Biol Lipids 1864: 466–488. [DOI] [PMC free article] [PubMed] [Google Scholar]
- Amos DL, Robinson T, Massie MB, Cook C, Hoffsted A, Crain C, and Santanam N (2017) Catalase overexpression modulates metabolic parameters in a new ‘stress-less’ leptin-deficient mouse model. Biochim Biophys Acta 1863: 2293–2306. [DOI] [PMC free article] [PubMed] [Google Scholar]
- Andoh A, Nishida A, Takahashi K, Inatomi O, Imaeda H, Bamba S et al. (2016) Comparison of the gut microbial community between obese and lean peoples using 16S gene sequencing in a Japanese population. J Clin Biochem Nutr 59: 65–70. [DOI] [PMC free article] [PubMed] [Google Scholar]
- Avila-Escalante ML, Coop-Gamas F, Cervantes-Rodriguez M, Mendez-Iturbide D, and Aranda G II (2020) The effect of diet on oxidative stress and metabolic diseases-Clinically controlled trials. J Food Biochem 44: e13191. [DOI] [PubMed] [Google Scholar]
- Barton W, Penney NC, Cronin O, Garcia-Perez I, Molloy MG, Holmes E et al. (2018) The microbiome of professional athletes differs from that of more sedentary subjects in composition and particularly at the functional metabolic level. Gut 67: 625–633. [DOI] [PubMed] [Google Scholar]
- Benite-Ribeiro SA, Putt DA, and Santos JM (2016) The effect of physical exercise on orexigenic and anorexigenic peptides and its role on long-term feeding control. Med Hypotheses 93: 30–33. [DOI] [PubMed] [Google Scholar]
- Bolyen E, Rideout JR, Dillon MR, Bokulich NA, Abnet CC, Al-Ghalith GA et al. (2019) Reproducible, interactive, scalable and extensible microbiome data science using QIIME 2. Nat Biotechnol 37: 852–857. [DOI] [PMC free article] [PubMed] [Google Scholar]
- Borrelli A, Bonelli P, Tuccillo FM, Goldfine ID, Evans JL, Buonaguro FM, and Mancini A (2018) Role of gut microbiota and oxidative stress in the progression of non-alcoholic fatty liver disease to hepatocarcinoma: Current and innovative therapeutic approaches. Redox Biol 15: 467–479. [DOI] [PMC free article] [PubMed] [Google Scholar]
- Callahan BJ, McMurdie PJ, Rosen MJ, Han AW, Johnson AJ, and Holmes SP (2016) DADA2: High-resolution sample inference from Illumina amplicon data. Nat Methods 13: 581–583. [DOI] [PMC free article] [PubMed] [Google Scholar]
- Canani RB, Costanzo MD, Leone L, Pedata M, Meli R, and Calignano A (2011) Potential beneficial effects of butyrate in intestinal and extraintestinal diseases. World J Gastroenterol 17: 1519–1528. [DOI] [PMC free article] [PubMed] [Google Scholar]
- Caporaso JG, Lauber CL, Walters WA, Berg-Lyons D, Lozupone CA, Turnbaugh PJ et al. (2011) Global patterns of 16S rRNA diversity at a depth of millions of sequences per sample. Proc Natl Acad Sci U S A 108 Suppl 1: 4516–4522. [DOI] [PMC free article] [PubMed] [Google Scholar]
- Caporaso JG, Kuczynski J, Stombaugh J, Bittinger K, Bushman FD, Costello EK et al. (2010) QIIME allows analysis of high-throughput community sequencing data. Nat Methods 7: 335–336. [DOI] [PMC free article] [PubMed] [Google Scholar]
- Carbajo-Pescador S, Porras D, Garcia-Mediavilla MV, Martinez-Florez S, Juarez-Fernandez M, Cuevas MJ et al. (2019) Beneficial effects of exercise on gut microbiota functionality and barrier integrity, and gut-liver crosstalk in an in vivo model of early obesity and non-alcoholic fatty liver disease. Dis Model Mech 12. [DOI] [PMC free article] [PubMed] [Google Scholar]
- Chen J, Guo Y, Gui Y, and Xu D (2018) Physical exercise, gut, gut microbiota, and atherosclerotic cardiovascular diseases. Lipids Health Dis 17: 17. [DOI] [PMC free article] [PubMed] [Google Scholar]
- Chen LW, Xu J, Soh SE, Aris IM, Tint MT, Gluckman PD et al. (2020) Implication of gut microbiota in the association between infant antibiotic exposure and childhood obesity and adiposity accumulation. Int J Obes (Lond) 44: 1508–1520. [DOI] [PMC free article] [PubMed] [Google Scholar]
- Chen X, Liang H, Van Remmen H, Vijg J, and Richardson A (2004) Catalase transgenic mice: characterization and sensitivity to oxidative stress. Arch Biochem Biophys 422: 197–210. [DOI] [PubMed] [Google Scholar]
- Cho J, Kim D, and Kang H (2020) Exercise Preconditioning Attenuates the Response to Experimental Colitis and Modifies Composition of Gut Microbiota in Wild-Type Mice. Life (Basel) 10. [DOI] [PMC free article] [PubMed] [Google Scholar]
- Chouchani ET, Kazak L, and Spiegelman BM (2019) New Advances in Adaptive Thermogenesis: UCP1 and Beyond. Cell Metab 29: 27–37. [DOI] [PubMed] [Google Scholar]
- Clarke G, Stilling RM, Kennedy PJ, Stanton C, Cryan JF, and Dinan TG (2014a) Minireview: Gut microbiota: the neglected endocrine organ. Mol Endocrinol 28: 1221–1238. [DOI] [PMC free article] [PubMed] [Google Scholar]
- Clarke SF, Murphy EF, O’Sullivan O, Lucey AJ, Humphreys M, Hogan A et al. (2014b) Exercise and associated dietary extremes impact on gut microbial diversity. Gut 63: 1913–1920. [DOI] [PubMed] [Google Scholar]
- Collins S, Martin TL, Surwit RS, and Robidoux J (2004) Genetic vulnerability to diet-induced obesity in the C57BL/6J mouse: physiological and molecular characteristics. Physiol Behav 81: 243–248. [DOI] [PubMed] [Google Scholar]
- Damgaard MTF, Paerregaard SI, Sogaard I, Agerholm M, Paulson JN, Treebak JT et al. (2018) Age-dependent alterations of glucose clearance and homeostasis are temporally separated and modulated by dietary fat. J Nutr Biochem 54: 66–76. [DOI] [PubMed] [Google Scholar]
- Delezie J, and Handschin C (2018) Endocrine Crosstalk Between Skeletal Muscle and the Brain. Front Neurol 9: 698. [DOI] [PMC free article] [PubMed] [Google Scholar]
- Denou E, Marcinko K, Surette MG, Steinberg GR, and Schertzer JD (2016) High-intensity exercise training increases the diversity and metabolic capacity of the mouse distal gut microbiota during diet-induced obesity. Am J Physiol Endocrinol Metab 310: E982–993. [DOI] [PMC free article] [PubMed] [Google Scholar]
- Done AJ, and Traustadottir T (2016) Nrf2 mediates redox adaptations to exercise. Redox Biol 10: 191–199. [DOI] [PMC free article] [PubMed] [Google Scholar]
- Douglas GM, Maffei VJ, Zaneveld JR, Yurgel SN, Brown JR, Taylor CM et al. (2020) PICRUSt2 for prediction of metagenome functions. Nat Biotechnol 38: 685–688. [DOI] [PMC free article] [PubMed] [Google Scholar]
- Dowden RA, McGuinness LR, Wisniewski PJ, Campbell SC, Guers JJ, Oydanich M et al. (2020) Host genotype and exercise exhibit species-level selection for members of the gut bacterial communities in the mouse digestive system. Sci Rep 10: 8984. [DOI] [PMC free article] [PubMed] [Google Scholar]
- Estaki M, Pither J, Baumeister P, Little JP, Gill SK, Ghosh S et al. (2016) Cardiorespiratory fitness as a predictor of intestinal microbial diversity and distinct metagenomic functions. Microbiome 4: 42. [DOI] [PMC free article] [PubMed] [Google Scholar]
- Evans CC, LePard KJ, Kwak JW, Stancukas MC, Laskowski S, Dougherty J et al. (2014) Exercise prevents weight gain and alters the gut microbiota in a mouse model of high fat diet-induced obesity. PLoS One 9: e92193. [DOI] [PMC free article] [PubMed] [Google Scholar]
- Fernandes MSS, Silva L, Kubrusly MS, Lima T, Muller CR, Americo ALV et al. (2020) Aerobic Exercise Training Exerts Beneficial Effects Upon Oxidative Metabolism and Non-Enzymatic Antioxidant Defense in the Liver of Leptin Deficiency Mice. Front Endocrinol (Lausanne) 11: 588502. [DOI] [PMC free article] [PubMed] [Google Scholar]
- Golbidi S, and Laher I (2014) Exercise induced adipokine changes and the metabolic syndrome. J Diabetes Res 2014: 726861. [DOI] [PMC free article] [PubMed] [Google Scholar]
- Goodpaster BH, and Sparks LM (2017) Metabolic Flexibility in Health and Disease. Cell Metab 25: 1027–1036. [DOI] [PMC free article] [PubMed] [Google Scholar]
- Guzman-Castaneda SJ, Ortega-Vega EL, de la Cuesta-Zuluaga J, Velasquez-Mejia EP, Rojas W, Bedoya G, and Escobar JS (2020) Gut microbiota composition explains more variance in the host cardiometabolic risk than genetic ancestry. Gut Microbes 11: 191–204. [DOI] [PMC free article] [PubMed] [Google Scholar]
- Gyengesi E, Paxinos G, and Andrews ZB (2012) Oxidative Stress in the Hypothalamus: the Importance of Calcium Signaling and Mitochondrial ROS in Body Weight Regulation. Curr Neuropharmacol 10: 344–353. [DOI] [PMC free article] [PubMed] [Google Scholar]
- Gyuraszova M, Kovalcikova A, and Gardlik R (2017) Association between oxidative status and the composition of intestinal microbiota along the gastrointestinal tract. Med Hypotheses 103: 81–85. [DOI] [PubMed] [Google Scholar]
- Harrell F Jr (2020) Hmisc v4.4-1 Harrell Miscellaneous. In. [Google Scholar]
- Henderson G, Yilmaz P, Kumar S, Forster RJ, Kelly WJ, Leahy SC et al. (2019) Improved taxonomic assignment of rumen bacterial 16S rRNA sequences using a revised SILVA taxonomic framework. PeerJ 7: e6496. [DOI] [PMC free article] [PubMed] [Google Scholar]
- Hirsch KR, Smith-Ryan AE, Blue MN, Mock MG, Trexler ET, and Ondrak KS (2016) Metabolic characterization of overweight and obese adults. Phys Sportsmed 44: 362–372. [DOI] [PMC free article] [PubMed] [Google Scholar]
- Hosseini E, Grootaert C, Verstraete W, and Van de Wiele T (2011) Propionate as a health-promoting microbial metabolite in the human gut. Nutr Rev 69: 245–258. [DOI] [PubMed] [Google Scholar]
- Hu Y, Chen D, Zheng P, Yu J, He J, Mao X, and Yu B (2019) The Bidirectional Interactions between Resveratrol and Gut Microbiota: An Insight into Oxidative Stress and Inflammatory Bowel Disease Therapy. Biomed Res Int 2019: 5403761. [DOI] [PMC free article] [PubMed] [Google Scholar]
- Jackson SJ, Andrews N, Ball D, Bellantuono I, Gray J, Hachoumi L et al. (2017) Does age matter? The impact of rodent age on study outcomes. Laboratory Animals 51: 160–169. [DOI] [PMC free article] [PubMed] [Google Scholar]
- kassambara A (2019) ggcorrplot: Visualization of a Correlation Matrix using ‘ggplot2’. In. [Google Scholar]
- Kelly TN, Bazzano LA, Ajami NJ, He H, Zhao J, Petrosino JF et al. (2016) Gut Microbiome Associates With Lifetime Cardiovascular Disease Risk Profile Among Bogalusa Heart Study Participants. Circ Res 119: 956–964. [DOI] [PMC free article] [PubMed] [Google Scholar]
- Leal LG, Lopes MA, and Batista ML Jr. (2018) Physical Exercise-Induced Myokines and Muscle-Adipose Tissue Crosstalk: A Review of Current Knowledge and the Implications for Health and Metabolic Diseases. Front Physiol 9: 1307. [DOI] [PMC free article] [PubMed] [Google Scholar]
- Liu Y, Ajami NJ, El-Serag HB, Hair C, Graham DY, White DL et al. (2019) Dietary quality and the colonic mucosa-associated gut microbiome in humans. Am J Clin Nutr 110: 701–712. [DOI] [PMC free article] [PubMed] [Google Scholar]
- Lubkowska A, Dudzinska W, Bryczkowska I, and Dolegowska B (2015) Body Composition, Lipid Profile, Adipokine Concentration, and Antioxidant Capacity Changes during Interventions to Treat Overweight with Exercise Programme and Whole-Body Cryostimulation. Oxid Med Cell Longev 2015: 803197. [DOI] [PMC free article] [PubMed] [Google Scholar]
- Magne F, Gotteland M, Gauthier L, Zazueta A, Pesoa S, Navarrete P, and Balamurugan R (2020) The Firmicutes/Bacteroidetes Ratio: A Relevant Marker of Gut Dysbiosis in Obese Patients? Nutrients 12. [DOI] [PMC free article] [PubMed] [Google Scholar]
- Mathes WF, Kelly SA, and Pomp D (2011) Advances in comparative genetics: influence of genetics on obesity. Br J Nutr 106 Suppl 1: S1–10. [DOI] [PubMed] [Google Scholar]
- Matsumoto M, Inoue R, Tsukahara T, Ushida K, Chiji H, Matsubara N, and Hara H (2008) Voluntary running exercise alters microbiota composition and increases n-butyrate concentration in the rat cecum. Biosci Biotechnol Biochem 72: 572–576. [DOI] [PubMed] [Google Scholar]
- Meilhac O, Ramachandran S, Chiang K, Santanam N, and Parthasarathy S (2001) Role of arterial wall antioxidant defense in beneficial effects of exercise on atherosclerosis in mice. Arterioscler Thromb Vasc Biol 21: 1681–1688. [DOI] [PubMed] [Google Scholar]
- Meissner M, Havinga R, Boverhof R, Kema I, Groen AK, and Kuipers F (2010) Exercise enhances whole-body cholesterol turnover in mice. Med Sci Sports Exerc 42: 1460–1468. [DOI] [PubMed] [Google Scholar]
- Mohr AE, Jager R, Carpenter KC, Kerksick CM, Purpura M, Townsend JR et al. (2020) The athletic gut microbiota. J Int Soc Sports Nutr 17: 24. [DOI] [PMC free article] [PubMed] [Google Scholar]
- Monda V, Villano I, Messina A, Valenzano A, Esposito T, Moscatelli F et al. (2017) Exercise Modifies the Gut Microbiota with Positive Health Effects. Oxid Med Cell Longev 2017: 3831972. [DOI] [PMC free article] [PubMed] [Google Scholar]
- Neeland IJ, Ross R, Despres JP, Matsuzawa Y, Yamashita S, Shai I et al. (2019) Visceral and ectopic fat, atherosclerosis, and cardiometabolic disease: a position statement. Lancet Diabetes Endocrinol 7: 715–725. [DOI] [PubMed] [Google Scholar]
- Nicolucci AC, Hume MP, Martinez I, Mayengbam S, Walter J, and Reimer RA (2017) Prebiotics Reduce Body Fat and Alter Intestinal Microbiota in Children Who Are Overweight or With Obesity. Gastroenterology 153: 711–722. [DOI] [PubMed] [Google Scholar]
- Oh KJ, Lee DS, Kim WK, Han BS, Lee SC, and Bae KH (2016) Metabolic Adaptation in Obesity and Type II Diabetes: Myokines, Adipokines and Hepatokines. Int J Mol Sci 18. [DOI] [PMC free article] [PubMed] [Google Scholar]
- Organization, W.H. (2019) Global Strategy on Diet, Physical Activity and Health In: World Health Organization. [Google Scholar]
- Phillips SA, Mahmoud AM, Brown MD, and Haus JM (2015) Exercise interventions and peripheral arterial function: implications for cardio-metabolic disease. Prog Cardiovasc Dis 57: 521–534. [DOI] [PubMed] [Google Scholar]
- Radak Z, Marton O, Nagy E, Koltai E, and Goto S (2013) The complex role of physical exercise and reactive oxygen species on brain. Journal of Sport and Health Science 2: 87–93. [Google Scholar]
- Ramos-Jiménez A, Hernández-Torres RP, Torres-Durán PV, Romero-Gonzalez J, Mascher D, Posadas-Romero C, and Juárez-Oropeza MA (2008) The Respiratory Exchange Ratio is Associated with Fitness Indicators Both in Trained and Untrained Men: A Possible Application for People with Reduced Exercise Tolerance. Clin Med Circ Respirat Pulm Med 2: 1–9. [DOI] [PMC free article] [PubMed] [Google Scholar]
- Rowland I, Gibson G, Heinken A, Scott K, Swann J, Thiele I, and Tuohy K (2018) Gut microbiota functions: metabolism of nutrients and other food components. Eur J Nutr 57: 1–24. [DOI] [PMC free article] [PubMed] [Google Scholar]
- Sanchis-Gomar F, Fiuza-Luces C, and Lucia A (2015) Exercise as the master polypill of the 21st century for the prevention of cardiovascular disease. Int J Cardiol 181: 360–361. [DOI] [PubMed] [Google Scholar]
- Sattar N, Gill JMR, and Alazawi W (2020) Improving prevention strategies for cardiometabolic disease. Nat Med 26: 320–325. [DOI] [PubMed] [Google Scholar]
- Savini I, Catani MV, Evangelista D, Gasperi V, and Avigliano L (2013) Obesity-associated oxidative stress: strategies finalized to improve redox state. Int J Mol Sci 14: 10497–10538. [DOI] [PMC free article] [PubMed] [Google Scholar]
- Scheiman J, Luber JM, Chavkin TA, MacDonald T, Tung A, Pham LD et al. (2019) Meta-omics analysis of elite athletes identifies a performance-enhancing microbe that functions via lactate metabolism. Nat Med 25: 1104–1109. [DOI] [PMC free article] [PubMed] [Google Scholar]
- Segata N, Boernigen D, Tickle TL, Morgan XC, Garrett WS, and Huttenhower C (2013) Computational meta’omics for microbial community studies. Mol Syst Biol 9: 666. [DOI] [PMC free article] [PubMed] [Google Scholar]
- Shen N, Chen N, Zhou X, Zhao B, Huang R, Liang J et al. (2019) Alterations of the gut microbiome and plasma proteome in Chinese patients with adolescent idiopathic scoliosis. Bone 120: 364–370. [DOI] [PubMed] [Google Scholar]
- Shern-Brewer R, Santanam N, Wetzstein C, White-Welkley J, and Parthasarathy S (1998) Exercise and cardiovascular disease: a new perspective. Arterioscler Thromb Vasc Biol 18: 1181–1187. [DOI] [PubMed] [Google Scholar]
- Shi TH, Wang B, and Natarajan S (2020) The Influence of Metabolic Syndrome in Predicting Mortality Risk Among US Adults: Importance of Metabolic Syndrome Even in Adults With Normal Weight. Prev Chronic Dis 17: E36. [DOI] [PMC free article] [PubMed] [Google Scholar]
- Song Y, Malmuthuge N, Steele MA, and Guan LL (2018) Shift of hindgut microbiota and microbial short chain fatty acids profiles in dairy calves from birth to pre-weaning. FEMS Microbiol Ecol 94. [DOI] [PubMed] [Google Scholar]
- Staerck C, Gastebois A, Vandeputte P, Calenda A, Larcher G, Gillmann L et al. (2017) Microbial antioxidant defense enzymes. Microb Pathog 110: 56–65. [DOI] [PubMed] [Google Scholar]
- Turnbaugh PJ, Hamady M, Yatsunenko T, Cantarel BL, Duncan A, Ley RE et al. (2009) A core gut microbiome in obese and lean twins. Nature 457: 480–484. [DOI] [PMC free article] [PubMed] [Google Scholar]
- Tzemah Shahar R, Koren O, Matarasso S, Shochat T, Magzal F, and Agmon M (2020) Attributes of Physical Activity and Gut Microbiome in Adults: A Systematic Review. Int J Sports Med 41: 801–814. [DOI] [PubMed] [Google Scholar]
- Walters W, Hyde ER, Berg-Lyons D, Ackermann G, Humphrey G, Parada A et al. (2016) Improved Bacterial 16S rRNA Gene (V4 and V4-5) and Fungal Internal Transcribed Spacer Marker Gene Primers for Microbial Community Surveys. mSystems 1. [DOI] [PMC free article] [PubMed] [Google Scholar]
- Warbeck C, Dowd AJ, Kronlund L, Parmar C, Daun JT, Wytsma-Fisher K et al. (2020) Feasibility and Effects on the Gut Microbiota of a 12-Week High Intensity Interval Training plus Lifestyle Education Intervention on Inactive Adults with Celiac Disease. Appl Physiol Nutr Metab. [DOI] [PubMed] [Google Scholar]
- Witkowski M, Weeks TL, and Hazen SL (2020) Gut Microbiota and Cardiovascular Disease. Circ Res 127: 553–570. [DOI] [PMC free article] [PubMed] [Google Scholar]
- Yang HT, Yang MC, Sun JJ, Guo F, Lan JF, Wang XW et al. (2015) Catalase eliminates reactive oxygen species and influences the intestinal microbiota of shrimp. Fish Shellfish Immunol 47: 63–73. [DOI] [PubMed] [Google Scholar]
- Yang JY, Lee YS, Kim Y, Lee SH, Ryu S, Fukuda S et al. (2017) Gut commensal Bacteroides acidifaciens prevents obesity and improves insulin sensitivity in mice. Mucosal Immunol 10: 104–116. [DOI] [PubMed] [Google Scholar]
- Yardeni T, Tanes CE, Bittinger K, Mattei LM, Schaefer PM, Singh LN et al. (2019) Host mitochondria influence gut microbiome diversity: A role for ROS. Sci Signal 12. [DOI] [PubMed] [Google Scholar]
- Yilmaz P, Parfrey LW, Yarza P, Gerken J, Pruesse E, Quast C et al. (2014) The SILVA and “All-species Living Tree Project (LTP)” taxonomic frameworks. Nucleic Acids Res 42: D643–648. [DOI] [PMC free article] [PubMed] [Google Scholar]
- Zhang S, Li H, Yuan L, Zhang J, Han L, Liu R et al. (2020) Molecular characterization of gut microbiota in highlipid dietinduced hyperlipidemic rats treated with simvastatin. Int J Mol Med 45: 1601–1615. [DOI] [PubMed] [Google Scholar]
- Zhao Q, Ou J, Huang C, Qiu R, Wang Y, Liu F et al. (2018a) Absorption of 1-Dicysteinethioacetal-5-Hydroxymethylfurfural in Rats and Its Effect on Oxidative Stress and Gut Microbiota. J Agric Food Chem 66: 11451–11458. [DOI] [PubMed] [Google Scholar]
- Zhao X, Zhang Z, Hu B, Huang W, Yuan C, and Zou L (2018b) Response of Gut Microbiota to Metabolite Changes Induced by Endurance Exercise. Front Microbiol 9: 765. [DOI] [PMC free article] [PubMed] [Google Scholar]
Associated Data
This section collects any data citations, data availability statements, or supplementary materials included in this article.