

Abstract
While the pathophysiology of schizophrenia has been extensively investigated using homogenized postmortem brain samples, few studies have examined changes in brain samples with techniques that may attribute perturbations to specific cell types. To fill this gap, we performed microarray assays on mRNA isolated from anterior cingulate cortex (ACC) superficial and deep pyramidal neurons from 12 schizophrenia and 12 control subjects using laser capture microdissection. Among all the annotated genes, we identified 134 significantly increased and 130 decreased genes in superficial pyramidal neurons, while 93 significantly increased and 101 decreased genes were found in deep pyramidal neurons, in schizophrenia compared to control subjects. In these differentially expressed genes, we detected lamina-specific changes of 55 and 31 genes in superficial and deep neurons in schizophrenia, respectively. Gene set enrichment analysis (GSEA) was applied to the entire pre-ranked differential expression gene lists to gain a complete pathway analysis throughout all annotated genes. Our analysis revealed over-represented groups of gene sets in schizophrenia, particularly in immunity and synapse related pathways, suggesting the disruption of these pathways plays an important role in schizophrenia. We also detected other pathways previously demonstrated in schizophrenia pathophysiology, including cytokine and chemotaxis, post-synaptic signaling, and glutamatergic synapses. In addition, we observed several novel pathways, including ubiquitin-independent protein catabolic process. Considering the effects of antipsychotic treatment on gene expression, we applied a novel bioinformatics approach to compare our differential expression gene profiles with 51 antipsychotic treatment datasets, demonstrating that our results were not influenced by antipsychotic treatment. Taken together, we found pyramidal neuron-specific changes in neuronal immunity, synaptic dysfunction, and olfactory dysregulation in schizophrenia, providing new insights for the cell-subtype specific pathophysiology of chronic schizophrenia.
Introduction
Schizophrenia is a severe mental illness characterized by hallucinations, delusions, abnormal behavior, and disorganized speech. It is a relatively common disorder that is the seventh most costly disease to our society and available medication treatment is only partially efficacious1, 2. While work to understand the causes and pathology of schizophrenia is ongoing, more effective therapeutic approaches need to be developed. We postulate that a more sophisticated understanding of the pathophysiology of schizophrenia will lead to such breakthroughs.
Our previous reviews have described the “blender” problem in postmortem brain studies, pointing out that results using blended tissue homogenates could be difficult to interpret and may lose important information when samples are a mixture of neurons, astroglia, microglia, and/or endothelial cells3, 4. For example, in our prior cell-subtype specific studies, we showed that the EAAT2 splice variant EAAT2b mRNA was increased in schizophrenia in anterior cingulate cortex (ACC) pyramidal neurons, but not in region-level homogenized samples, while another splice variant, EAAT2 exon9skipping, was increased at the region level, but not changed in pyramidal neurons5–7. These findings emphasize the limitations associated with measuring gene expression in blended human brain samples.
In this study, we targeted cortical pyramidal neurons, as they may easily be identified for capture using a modified RNase-Free Nissl stain4–10. Cortical pyramidal neurons form neuronal circuits in the cerebral cortex and are required to process sensory, planning, and executive functions11. Laser capture microdissection (LCM) is a technique frequently used to isolate specific cell types from postmortem tissues under microscopic visualization4–10, which is a powerful tool for cell level investigations. In the current study, we isolated pyramidal neurons from the ACC of 12 schizophrenia and 12 control subjects by LCM. Neurons from superficial (lamina II-III) and deep (lamina V-VI) cortical layers were captured separately from each subject. Superficial and deep neurons are known to have distinct functions. Superficial neurons are typically responsible for intracortical communication, while the deep neurons generally receive subcortical projections12, 13. Their transcriptional profiles were assessed by microarray analysis using the GeneChip® Human Gene 1.0 ST Arrays, comprised of more than 750,000 unique 25-mer oligonucleotides representing transcripts for more than 20,000 human genes, with each gene represented on the array by approximately 27 probes spread across the full length of its transcript.
Differentially altered pathways between schizophrenia and control subjects were analyzed using gene ontology databases and Gene Set Enrichment Analysis (GSEA)14. GSEA is advanced in detecting more subtle changes in transcritptional data sets, because it utilizes the entire gene profile with ranking, instead of the top differentially expressed genes14. GSEA is ideal for human studies, which typically have more variation among subjects and thus reduced power to detect changes. Previous superficial and deep neuron transcriptomic studies in DLPFC in schizophrenia have implicated pathways that include mitochondrial function, oxidative phosphorylation, stress regulation, and ubiquitin proteasome system15, 16. These pathways were also detected in our analyses. Using our comprehensive pathway analysis, we also identified novel pathways, such as pathways involved in olfactory sensation. The neuronal immunity pathways were the most striking category we found in pyramidal neurons, a finding not reported in prior neuronal cell-level transcriptomic studies.
The effects of antipsychotic treatment on gene expression is a concern for postmortem brain studies of schizophrenia17, 18. Therefore, in our study, we applied a novel bioinformatics approach to compare our differential expression gene profiles with 51 antipsychotic treatment gene expression datasets to assess the effects of antipsychotic treatment on our findings.
Materials and methods
Subjects
Postmortem tissue from anterior cingulate cortex (ACC) in subjects diagnosed with schizophrenia (SCZ; n=12) and a control group (NC; n=12) were obtained from the Mount Sinai/Bronx Veterans Administration Medical Department of Psychiatry Brain Bank. Schizophrenia and control subjects were matched for age of death, postmortem interval (PMI), sex, and tissue pH (Table 1, Supplementary Table 1). Tissue was collected in compliance with the Mount Sinai School of Medicine Institutional Review Board protocol for postmortem tissue9. This study has a relatively small number of subjects, a necessary limitation to balance the time and cost of capturing and analyzing thousands of individual cells from postmortem brain. There are previously reported studies using a small number of subjects19–23 and a number of them are regional level studies. Thus, for our cell-level study it was difficult to include a large number of subjects due to the labor-intense nature of laser capture microdissection.
Table 1:
Subject demographics
| Control | Schizophrenia | |
|---|---|---|
| N | 12 | 12 |
| Sex | 6 Male/6 Female | 6 Male/6 Female |
| Tissue pH | 6.4 ± 0.3 (6–6.82) | 6.3 ± 0.4 (5.8–7.1) |
| PMI (Hours) | 10.2 ± 6.3 (3.38–20.4) | 11.9 ± 5.4 (6.2–20.4) |
| Age (Years) | 73.5 ± 10.8 (58–89) | 72.6 ± 10.8 (57–90) |
| *Medication | 0/12/0 | 8/2/2 |
Medication (On/Off/Unknown)
Harvest of neurons from superficial and deep laminas of ACC
Fresh frozen anterior cingulate cortex from subjects was sectioned at 14 μm on SuperFrost®/Plus glass slides (Fisher Scientific, Pittsburgh, PA) and stored at −80°C until use. For laser-capture microdissection (LCM)9, tissue slides were incubated in RNase-free 1% cresyl violet acetate for 2 minutes, submerged in 95% ethanol, and then in 100% ethanol for 30 seconds, followed by immersion in xylene for 5 minutes. Lamina and pyramidal neurons were defined based on distribution across the cortical thickness and morphology of cells9, 12, 24 and approximately 2000 pyramidal neurons were isolated from superficial (lamina II-III) and deep (lamina V-VI) layers from each subject by LCM using the Arcturus VERITAS instrument and protocols confirmed by nissl staining of adjacent sections. LCM was performed under 20X objective lens and with laser settings ranging from 70–100 mW in power, and 2,000–3,000 μsec in duration. Neurons were collected onto a CapSure® Macro LCM Cap and 50μl extraction buffer from the PicoPure® RNA Isolation Kit (Applied Biosystems™) was added to the cells, followed by an incubation at 42°C for 30 min. The cell lysates were spun at 800 x g for 2 min and the supernatant was stored at −80°C until use. We have previously reported in multiple studies that we are capable of isolating samples enriched for pyramidal neurons4–10.
RNA isolation, cDNA synthesis, labeling, and oligonucleotide array hybridization
Total RNA from the 2000 pyramidal neurons from each subject and each lamina was purified separately with the QuickGene RNA Tissue kit SII in conjunction with the QuickGene Mini-80 semi-automated station (FujiFilm Life Sciences Division). RNA samples were processed by Genome Explorations Inc., Memphis, TN – a certified Affymetrix® microarray service provider – for microarray assays. Immediately prior to cDNA synthesis, the purity and concentration of RNA samples was determined by readings of OD260/280 using a dual beam UV spectrophotometer and RNA integrity was determined by capillary electrophoresis using the RNA 6000 Nano Lab-on-a-Chip kit and the Bioanalyzer 2100 (Agilent Technologies, Santa Clara, CA) following the manufacturers instructions. The purified RNA was amplified with the WT-Ovation™ Pico RNA Amplification System (NuGEN Technologies, Inc). 5–20 ng RNA from each sample was reverse transcribed to complementary DNA (cDNA), amplified, fragmented, and labeled with biotin using the Ovation Pico WTA, Ovation Exon Module, and Encore Biotin Module kits according to the manufacturer’s instructions (NuGEN, San Carlos CA).
Microarray assay
The GeneChip® Human Gene 1.0 ST Arrays (Affymetrix®, Santa Clara CA) were used. Arrays were washed and stained with phycoerythrein-conjugated streptavidin (Life Technologies, Carlsbad, CA) in a Fluidics Station 450 (Affymetrix) according to the manufacturer’s recommended procedures. Fluorescence intensities were determined using a GCS 3000 7G high-resolution confocal laser scanner.
Differential expression analysis and pathway enrichment analysis.
To identify differential expression genes and biological pathways, Limma (Linear Model of Micro Array, version 3.44.1) R package and gene set enrichment analysis (GSEA) were utilized. Raw data and differential expression results were deposited in GEO (GSE145554). Full details are included in the supplement.
Antipsychotic analysis
Antipsychotics may have effects on gene expression17, 18. Therefore, we compared our data with 51 antipsychotic treated profiles. We used tmod package (Version 0.40) in R to measure the area under the receiver operating characteristics (AUROC) curve. The method uses ranked genes associated with different contrasts to measure the enrichment of up and down regulated gene signatures from different antipsychotic drugs (including lithium and valproic acid) tested in the mouse and rat (Supplementary Table 5)25–30 and computes p-value based on Coincident Extreme Ranks in Numerical Observations (CERNO) statistics31. Datasets GSE66276, GSE4031, GSE66275, and GSE89873 (Supplementary Table 5) were also included in our antipsychotic analysis and have not been published in previously reported studies to the best of our knowledge. The AUC (Area Under the Curve) values calculated are equal to the probability that an antipsychotic associated gene signature will rank higher in schizophrenia associated ranking than the signature not enriched for a given antipsychotics. The AUC scores calculated for ranked genes (separating upregulated and downregulated genes) associated with an antipsychotic against the signature of another similar antipsychotic is expected to show a higher value and can be used as a positive control for our analysis. This is the first time that AUROC has been used for antipsychotic effect analysis and its generalizability, validity, and replicability could be a concern. However, all pipelines are objective and are usually guided by statistics. The initial analysis of our datasets was performed in well-established algorithms, such as LIMMA, and followed standard procedure for normalization and filtering. All of these are very important to maintain the generalizability, validity, and replicability of the final results.
GSEA-based pathway confirmation study
In order to compare our study and previously published datasets at the pathway level, we performed new GSEA analyses for 16 schizophrenia datasets (Supplementary Table 6) available in Kaleidoscope (https://kalganem.shinyapps.io/BrainDatabases/)32 with the same parameters and methodology we used in our GSEA analysis. The top rated pathways from our study were used for comparison and pathway similarity among datasets was determined based on the GSEA enrichment scores. The gene sets with less than 15 genes detected were filtered out from each datasets.
Code availability
Computer code for AUROC analysis is listed in the supplementary materials Appendix 1.
Results
Altered gene expression profile in schizophrenia
Postmortem tissues were obtained from 12 schizophrenia patients and 12 psychiatrically healthy comparison subjects. 2000 pyramidal neurons were enriched from both superficial and deep layers of the anterior cingulate cortex of each subject by LCM (96,000 cells total) (Fig. 1A, Table 1). The RNA of each LCM sample was purified, reverse transcribed, and 48 separate arrays were performed, one for each superficial or deep sample for each subject.
Figure 1. Distinct gene expression profiles detected in schizophrenia patients.

A. Superficial (Layer II and III) and deep (Layer V and VI) pyramidal neurons were enriched from anterior cingulate cortex of schizophrenia and control subjects. B. Venn diagrams show differential expression gene numbers overlapping in superficial and deep neurons to the comparison groups regardless of layers between schizophrenia and control subjects. C. Differentially expressed genes in the superficial and deep neurons were shown by heatmap, using www.heatmapper.ca. Clustering method: complete linkage; Distance measurement method: pearson. Plotted genes of P < 0.05.
Differential expressed genes were first analyzed to compare the schizophrenia and control subjects. A total of 22,595 genes were annotated from the arrays. Among which, we identified 134 significantly increased and 130 decreased genes in schizophrenia superficial neurons, while 93 significantly increased and 101 decreased genes were found in schizophrenia deep neurons, compared to control subjects (P < 0.05, Fig. 1B). Among these genes, 55 genes were exclusively differentially expressed in the superficial neurons, while 31 genes were exclusively differentially expressed in the deep neurons. Combining the schizophrenia superficial and deep neurons, we identified 647 significantly increased and 616 decreased genes, compared to control subjects (P < 0.05, Fig. 1B). Interestingly, these 1263 differentially expressed genes include all the increased and decreased genes in the superficial and deep neurons, although these differentially expressed genes from the superficial and deep neurons do not completely overlap (Fig. 1B). Based on unsupervised clustering (Shown by heatmap), the schizophrenia and control subjects clustered well and the significantly increased and decreased differentially expressed genes are clearly separated between the groups (Fig. 1C). The top 50 up and down regulated genes are listed in Supplementary Table 2.
Pathway alterations involved in schizophrenia pathology
We performed gene set enrichment analysis (GSEA) with the complete list of the annotated genes ranked based on their expression and significance levels. GSEA revealed multiple gene sets involved in schizophrenia, including proteolysis, immunity, synapses, protein modification, receptors, transporters, and sensory system (Supplementary Table 3). We detected olfactory sensing pathways, including chemical stimulus detection, sensory perception of smell, odorant binding, and olfactory receptor activation. Full details of results and discussion are described in the supplementary materials. Superficial and deep neurons share 45% of the pathways, including upregulated and downregulated gene sets. However, they have opposite directionality for the remaining 55% pathways, including proteolysis, antigen processing and presentation, and neuron projection extension (Supplementary Table 4). This result suggests that schizophrenia may affect the superficial and deep neurons differently.
Synapse
In our microarray data, 13 synapse-related pathways were identified, with 9/13 involved in postsynaptic signals and 8/9 involved in postsynaptic density and plasma membrane. There were no downregulated synaptic pathways detected. 6/9 synaptic pathways upregulated in deep neurons were also upregulated in superficial neurons. 5/6 of these pathways are related to postsynaptic functions (Supplementary Table 3).
Proteolysis
While most gene set categories were detected in both superficial and deep neurons, four were detected only in the deep neurons, including the proteolysis pathway. The proteolysis pathways detected in our data analysis are mostly affected in deep (8/9 pathways), but not superficial, neurons. They are mostly involved in ubiquitin-dependent and -independent protein catabolic processes, modification-dependent and proteasomal protein catabolic processes (Supplementary Table 3).
Protein modification
Protein modification pathways linked to mitosis, protein folding, protein ubiquitination, oxidation, and phosphorylation (Supplementary Table 3) were also altered in our study. Protein folding and oxidation pathway alterations were as observed in the superficial neurons, while ubiquitination and ERK pathways are hits in the superficial and deep neurons.
Immunity
Our microarray data shows strong correlation between schizophrenia and immunity. The immunity gene set hits in our analysis are mostly downregulated in the schizophrenia group. 43/45 and 47/53 of detected immunity gene sets were downregulated in the superficial and deep neurons, respectively. When comparing schizophrenia and control subjects combining superficial and deep neurons, 42/47 of the enriched gene sets were downregulated. When we looked at the gene set categories, we found that 36/67 gene sets are cytokine and chemotaxis related, including Il-8, IL-10, and TNFα regulatory pathways. (Fig. 2).
Figure 2. Gene set enrichment analysis reveals pathways involved in schizophrenia pathophysiology.

Differentially expressed genes from each comparison were ranked based on their expression value and significance. GSEA was performed using the pre-ranked gene lists. A heatmap was generated based on the enrichment score and significance of GSEA (P < 0.05). Cytokine immunity pathways were enlarged to show details.
Humoral immunity gene sets, including B cell mediated immunity, complement, and immunoglobulin mediated immunity, were hits in our gene set enrichment analysis, T cell activation pathways are also involved, indicating the involvement of adaptive immunity. Interestingly, there are different patterns between superficial and deep in certain gene sets. For example, we found 5 antigen presentation related gene sets total and four of them are upregulated in the deep neurons only while one is downregulated in the superficial neurons only. The cytokine IL-8 and TNFα gene sets are dysregulated only in the deep neurons, but not in the superficial neurons.
Antipsychotic medication
In order to determine whether the pathway alterations we have observed were driven by antipsychotic medication, we compared our differential expression profiles to 51 antipsychotic drug treated transcriptional profiles from rodents (Supplementary Table 5). We found that the profiles of the deep neurons and the total (superficial and deep neurons combined) have no significant similarity with any of the upregulated or downregulated antipsychotic drug profiles in either up or down direction (shown in grey curves, Fig. 3). However, the superficial neurons showed subtle (AUC of 0.55) but significant (adj. P. value < 0.05) similarity with 3/51 downregulated profiles associated with: GSE66275: Risperidone, 5mg/kg/d, 21d; GSE66275: Haloperidol, 0.25mg/kg/d, 21d, and GSE48955: Haloperidol, 1mg/kg, 8h (Fig. 3 green curves), and 1/51 upregulated profile associated with GSE677: Haloperidol, 3mg/kg/d, 30d (Fig. 3 red curve). Note that the AUC values of these datasets are less than 0.55, while 0.5 means no similarity. In addition, we evaluated the effect of lithium, valproic acid, and a few anticholinergic drugs, biperiden and trihexyphenidyl, in our cohort. We found that the superficial neurons showed subtle (AUC of 0.54) but significant (adj. P. value < 0.05) similarity with 1/3 (GSE66276, lithium, 0.2% in chow, 21 days) lithium downregulated profiles, while the deep and the total (superficial and deep neurons combined) neurons showed no similarity with any datasets analyzed (Supplementary Fig. 1). No effects were detected for valproic acid, biperiden or trihexyphenidyl.
Figure 3. Our results are not influenced by antipsychotic drugs.
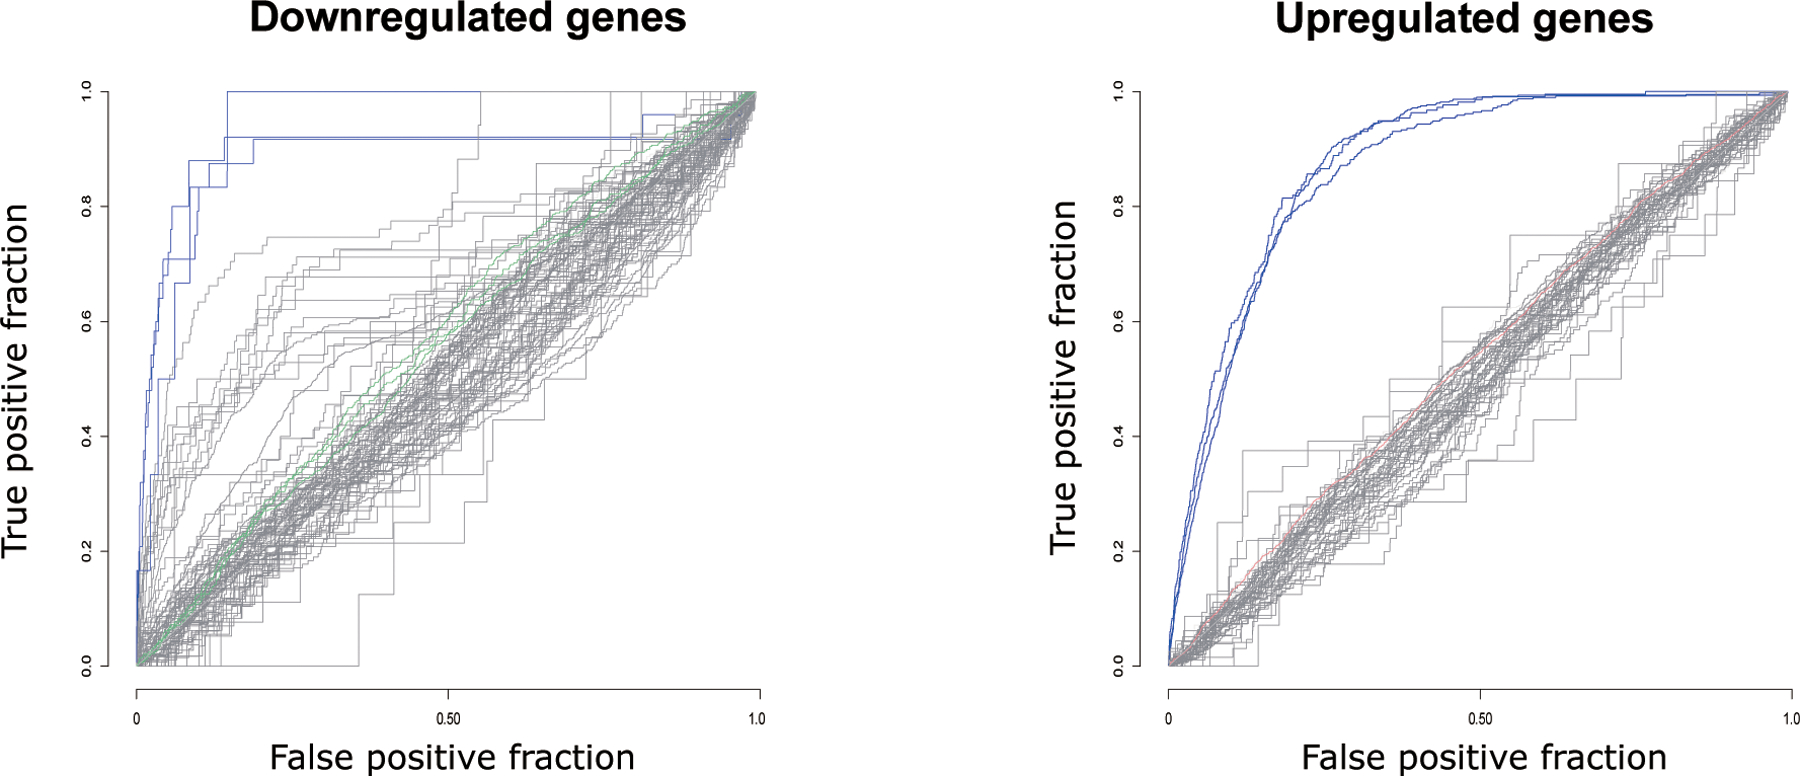
51 previously published antipsychotic treatment transcriptional profiles in rodents were compared with the superficial and deep neuron transcriptional profiles from the current study. Each line represents one antipsychotic treatment profile. The profiles with significant similarity with our data are either marked in red (based on ranked upregulated genes) or green (based on ranked downregulated genes). Grey curves represent the non-significant profiles. Only significant antipsychotic profiles compared to superficial neurons shown here, because no significant associations were found between antipsychotic profiles compared to deep neurons. Blue curves represent the significant positive control profiles compared to the clozapine consensus with AUROC higher than 0.85. (adj. P < 0.05)
Confirmation studies
Considering that our primary outcome is a pathway-based analysis, we compared our top-GSEA-derived pathways with previously published studies. 18 pathways/gene sets were selected for comparison; 13 of our pathways had at least 10 datasets that passed a pre-set filter (at least 15 genes detected in the gene sets) for comparison. These pathways included categories of complement activation, monocyte chemotaxis, postsynaptic density membrane, proteolysis, protein modification, and olfactory receptor activity (Fig. 4). We found that 8/13 of our top GSEA-derived pathways had the same directionality with more than half of the previously published datasets, with 7/8 pathways having the same directionality with more than 10 of the previously published datasets. These pathways included complement activation, postsynaptic density membrane, and monocytes chemotaxis. One of the 8 pathways, positive regulation of monocyte chemotaxis, had fewer datasets showing similarity because only 9 datasets passed the filter (Fig. 4).
Figure 4. Similarity of GSEA-based pathway analyses between our results and previously published datasets.

The 13 top rated pathways from our analysis were compared with 16 previously published datasets (listed in Supplementary Table 6). The comparison was based on the GSEA enrichment scores generated for all datasets using the same methodology. The cell level studies are indicated by the red bars and the region level studies are indicated by the blue bars. Our datasets are labeled as “Super_Deep,” Deep_Neurons,” and Super_Neurons” on the Y-axis.
Discussion
We performed a cell-subtype specific study of mRNA expression in schizophrenia, and found changes in enriched populations of pyramidal neurons in several pathways previously only implicated in studies employing homogenized region-level samples. These pathways include immunity, synapse, protein modification, and proteolysis. We also developed a novel way to assess the impact of antipsychotic treatment, using 51 published antipsychotic treatment databases, comparing these (mostly) rodent differential gene expression studies with the results from our cell-level study. Finally, we performed cutting-edge in silico confirmation analyses, using our new R-shiny application, called Kaleidoscope32, to compare and contrast our findings with 16 published schizophrenia versus control transcriptomic datasets (Supplementary Materials Supplementary Table 6).
A previous microarray study of pyramidal neurons found changes similar to some of our results (Table 2). Cells harvested from DLPFC layers III and V separately had robust pathway alterations in mitochondrial function and ubiquitin proteasome system in schizophrenia16. A more recent microarray study in the same cortical layers and cell types using different pathway analysis methods (including Ingenuity Pathway Analysis (IPA)) showed that the most striking pathways were involved in oxidative phosphorylation, stress regulation, and mitochondrial dysfunction15. While these pathways were also detected in our microarray analysis (Table 2, Supplementary Table 3), they do not represent the most significant findings. These differences may be due to a number of factors including 1) differences in subject ages, disease length, and medication history, 2) analysis of different brain regions (ACC vs. DLPFC)33, 3) differing normalization, statistical analysis and differential gene expression analysis approaches, and/or 4) our use of cutting-edge pathway analysis methodology. Previous studies used either IPA or GO, KEGG, Biocarta and Reactome pathway databases, analyzing only significantly differentially expressed genes. In contrast, we performed GSEA with the entire ranked gene profile, which has the advantage of being able to detect more subtle changes in the data sets14. GSEA is particularly useful for human studies, which typically have more variation among subjects and thus reduced power to detect effects with analyses that only use the top ranked changes14.
Table 2.
Comparison of cell-level gene expression studies in schizophrenia
| Arion 2015 | Arion 2017 | Present study | ||||
|---|---|---|---|---|---|---|
| Biological Pathways | Sup | Deep | Sup | Deep | Sup | Deep |
| Mitochondrial | X | X | X | X | X | X |
| Ubiquitin-proteasome system | - | X | X | - | - | X |
| Stress regulation | - | - | X | X | X | X |
| Mitosis | - | - | - | X | - | X |
| Immunity | - | - | - | - | X | X |
| Olfactory function | - | - | - | - | X | X |
| Protein modification | - | - | - | - | X | X |
| Synapse/neurotransmitter | - | - | - | - | X | X |
Reported biological pathways from the present study and 2 other published cell-level studies of pyramidal neuron mRNA expression in schizophrenia. Abbreviations: superficial (Sup), pathway present (X), pathway absent (-).
Although the superficial and deep neurons do not have dramatic differences in the differentially expressed genes, a large number of differences in pathways were detected in schizophrenia using GSEA. This is likely due to subtle differences in the differential expression gene profiles that would not be detected if only the top differentially expressed genes (for example top 50 or 100) were analyzed. This is an important advantage of GSEA, as we also found differences using this technique between superficial and deep pyramidal neurons that would not have been apparent using typical approaches.
It’s well documented that schizophrenia pathophysiology is partially related to immune system, namely pro-inflammatory cytokine secretion, innate immunity activation, T cell activation, autoantibody production, and microglia dysfunction34–37. In our GSEA analysis, the most significantly altered pathways are immune system related. Among these, 57% are cytokine and chemokine related, indicating cytokines and chemokines may play an important role in schizophrenia pathophysiology. Previous studies have shown alterations of cytokines TNFα and IL-8 in schizophrenia postmortem brain in the prefrontal cortex38, consistent with our results (Fig. 2). In addition, in peripheral blood mononuclear cells (PBMCs) and plasma from schizophrenia patients, alterations of CCL5, MCP-1, IL-8, IL-18, IFN-r, IL-2, MIP1a, IL-1β, and IL-6 were detected39, 40.
Studies have also assessed cerebrospinal fluid (CSF) and found increased IL-8 in schizophrenia subjects41, 42, consistent with our results. They also found marginally increased IL-10 and TNFα in the CSF, while these cytokines were more dramatically increased in the serum41. The pathways that regulate these two cytokines were also detected in our pathway analysis. Elevated IL-1β protein was detected in the CSF in schizophrenia43, while other evidence suggests that IL-1β may be a state marker for acute schizophrenia44, which may explain why it is not detected in our pathway analysis considering the chronic nature of our cohort. In addition, multiple CSF studies had found altered IL-6 levels34, 45, 46, but IL-6 related pathways were not detected in our analyses. Further, other studies found detectable IL-4 only in a younger (mean of age 16) cohort schizophrenia subjects47, a result not detected in our aged chronic cohort (Mean of age 73). Although detection of cytokine/chemokine pathways is possibly partially due to cross-talk with pathways of other categories, observing these pathways clearly show the involvement of cytokines and chemokines in schizophrenia pathophysiology in pyramidal neurons. The dysregulation of cytokine IL-8 and TNFα gene sets only in the deep neurons, but not in the superficial neurons, indicates the deep and superficial neurons may possess differential regulation in certain immune pathways.
In addition to cytokines and chemokines, adaptive immune cell processes, such as T- and B-cell activation pathways, were also hits in our analyses. By combining multiple single nucleotide polymorphism (SNP)-based genome-wide association studies in schizophrenia, a prior Meta-analysis found several significant associations in the major histocompatibility complex (MHC) region on chromosome 6p21.3–22.148. Taken together, these data suggest involvement of adaptive immunity pathways, including MHC molecules known for selection and activation during normal and/or pathological development and T-cell priming. Interestingly, while a majority of immune pathways are downregulated in schizophrenia, we detected upregulated antigen presentation pathways, which could be a compensatory mechanism. Although the genetic association between MHC and schizophrenia is robust, there is a lack of direct experimental evidence explaining the relationship between altered MHC expression and schizophrenia. Even though our analysis suggests the deficits of adaptive immunity and antigen presentation in schizophrenia pathophysiology, it is possible that the detection of these pathways may be partially due to pathway cross-talk or microglial contamination in our enriched LCM pyramidal neuron samples.
In addition to immunity related pathways, we hypothesized that we would identify pathways related to the synapse and proteolysis, which have previously been reported in schizophrenia. Gray matter reduction in the frontal cortex of schizophrenia patients has been demonstrated by histopathological imaging49 and this gray matter reduction is associated with synaptic, but not neuronal loss50. In addition, glutamate levels in the pre- and post-synapse between neurons and astrocytes are tightly regulated to maintain normal synaptic functions, while glutamate dysregulation plays a critical role in psychotic diseases, such as schizophrenia12, 51–53. These studies suggest that synaptic function is disrupted in schizophrenia. We detected only upregulated synaptic pathways, which may be a compensatory mechanism. Two of the synaptic pathways upregulated only in deep neurons are asymmetric synapse and glutamatergic synapse pathways, which indicates that deep excitatory neurons may be more affected.
Protein degradation systems are critical for removal of damaged or toxic proteins and play an important role in normal cell homeostasis. Protein degradation dysregulation, especially ubiquitin mediated proteolysis, is associated with schizophrenia in both postmortem brains and peripheral samples16, 54–56. In our GSEA results, we detected both ubiquitin-dependent and – independent pathways. More interesting, 8/9 gene set hits in our analysis are upregulated in the deep neurons only. Consistent with our findings, microarray analysis of the DLPFC in schizophrenia also detected dysregulated ubiquitin-proteasome system in layer V (deep neurons) but not layer III (superficial neurons)16. It is not yet clear why altered ubiquitin-dependent pathways are identified in deep but not superficial neurons in schizophrenia.
Olfactory sensory pathways were detected as top hits in our analyses which was unexpected. Biopsied olfactory neuroepithelium from schizophrenia patients showed increased mitosis rate in vitro and altered cell proliferation pathways in microarray analysis57. Another microarray study in biopsied olfactory epithelium identified downregulated SMAD (a family of intracellular mediators of TGF-beta signaling58) pathway, which affects neuronal development and maintenance59. Different from other sensory systems, the olfactory sensing bypasses the brain stem and thalamus, projecting directly to olfactory bulbs60. In schizophrenia patients, smaller olfactory bulbs and reduced synaptic efficacy in the olfactory bulbs have been reported61, 62 and reduced chondroitin sulfate proteoglycans were found in the schizophrenia olfactory epithelium tissues63. G protein mediated dopamine and serotonin signaling upregulation has also been linked to schizophrenia pathophysiology64. These may affect odor detection, precision, and processing, which is consistent with our pathway analyses, indicating that olfactory sensing dysfunction in schizophrenia may be present throughout the olfactory system.
While olfactory function is affected in schizophrenia, changes in olfactory gene expression may be secondary to the critical role of G protein coupled receptors (GPCRs) in this disease65 and the crosstalk of GPCR and olfactory pathways (more detailed discussion in the supplementary materials). In addition, in our pathway confirmation study, we were not able to show similarity between our pathways and previously published datasets, at the gene expression and pathway levels. This may be due to the smaller number of olfactory related genes detected in other datasets. Confirming the correlation between schizophrenia and olfactory sensing requires further investigation.
Antipsychotics can significantly affect gene expression66, 67. The potential impact of antipsychotic medications should always be considered in postmortem studies. This is a particular challenge in studies with small sample sizes where many, if not most subjects, are on medication; in our study 7/12 subjects were prescribed typical antipsychotics. To assess if the dependent measures in our analysis were influenced by antipsychotic treatment, we compared the fold-change rank ordered transcriptional profiles of schizophrenia versus control subjects to 51 previously published antipsychotic drug treatment profiles. We only detected marginal (AUC < 0.55) similarity of the superficial neuron profile and risperidone treated datasets, 5mg/kg/d, 21d; haloperidol, 0.25mg/kg/d, 21d; haloperidol, 1mg/kg, 8h and haloperidol, 3mg/kg/d, 30d. Deep neuron profiles had no significant similarity to any antipsychotic treatment datasets. Considering that our positive control analysis showed high similarity (AUC > 0.85, Supplementary materials) between clozapine treated profiles and the consensus treatment profile, the similarity between our results and the antipsychotic treatment profiles is minor. In addition, compared to the generally lifelong treatment of schizophrenia subjects, the antipsychotic treatment in these 4 profiles are much shorter (1 is 8h; 2 are 21d; and 1 is 30d). Our data had no significant similarity to the longer treatments (up to 12 weeks) in the profiles.
We observed that the downregulated genes have more variability in our antipsychotic treatment AUROC analysis. Based on our current and previous studies, we note that subjects with schizophrenia have more downregulated than upregulated genes, in general. We speculate that the polarity of the effects of antipsychotic medications may be to decrease gene expression; given that there is significant variation in antipsychotic drug, dose, and duration, this may account for the higher variation observed in downregulated genes in our schizophrenia dataset. One limitation of our antipsychotic analyses is that the antipsychotic datasets we analyzed were all in rodents, and thus may not be directly comparable to humans. Somewhat mitigating these limitations, we included a large number of datasets (51 in total) and used a consensus gene list generated from rodents treated with clozapine to provide a positive control, increasing the reliability of our analysis. This novel analysis, the first of its kind combining data for 51 antipsychotic treatment studies, suggests our GSEA findings are not secondary to effects of treatment with antipsychotic medications.
The traditional confirmatory approach for microarray and/or RNAseq studies is to perform PCR assays on individual genes. Such studies are confounded by selection bias, and confirmation rates using QPCR are often around 50% or lower68. As the primary outcome of the present study was in the form of biological pathways, we devised a novel confirmation strategy comparing our pathway findings, with pathways generated from previously published transcriptome datasets in schizophrenia subjects.
Among the selected 13 top rated GSEA-derived pathways in our dataset, we detected that 8/13 pathways had the same directionality with more than half of the previously published datasets (Figure 4). These pathways are mostly involved in innate immunity and post-synaptic density membrane. Although we also looked into pathways involved in olfactory system and proteolysis, no similarity was found between ours and previously reported datasets. Our pathway confirmation analyses indicated that our top-rated pathways have similarity with previously published datasets. However, we noticed large variation among the datasets, even among the studies done by the same research group in different subject cohorts. This suggests that the results could be affected by many factors, such as different brain regions, different cohorts, and platforms used for collecting raw gene expression data, and strategies for data normalization. Importantly, one major reason for variability in the results may be due to some studies using older microarray technology, compared to more recent work using RNAseq, as there are different levels of gene coverage for these different techniques.
There are several potential limitations for this study. Cell-level studies offer greater insight in disease-relevant changes than region-level analysis revealing transcriptional profiles of specific cell-subtypes, neurons, in different cortical layers. Since LCM samples only include the neuronal cell body, mRNA in the processes, axons, and dendrites is excluded from the samples. Another limitation of LCM is the possible inclusion of neuropil or processes from non-neuronal cell types, including astroglia, due to their close association with neurons. However, we have previously demonstrated robust enrichment of pyramidal neurons with our protocol, using well-established- neurochemical markers5–10. Microarray technology is a powerful tool to broadly assess changes in gene transcription. However, it can only detect the genes with the given probes in the array, while other methods, like RNAseq, have the capacity for unsupervised gene mapping, which potentially can detect every transcript in a sample. At the time that this study was performed, it was not technically feasible to combine cell-subtype specific LCM protocols with RNAseq. Another limitation is that we have lower number of subjects (n = 12 per group), a necessary limitation to balance the time and cost of capturing and analyzing thousands of individual cells from postmortem brain. We sought to mitigate this concern by having our primary outcome measures be pathways based on the full transcriptional signature, rather than only using the top differentially expressed genes. This more comprehensive analysis allows detection of subtle changes in the biological pathways and particularly suits postmortem studies, which often have higher variation and lower power.
Finally, another potential limitation is the age of our subjects. Some of the identified pathways, such as immunity and protein degradation, are known to change with age. While we have carefully matched our schizophrenia subjects for age with our control subjects, this does not preclude a disease by age interaction. Additional studies in younger cohorts with shorter disease course will need to be performed to address this limitation, although younger cohorts have their own limitations, including higher levels of substance use and higher suicide rates, factors known to have an impact on gene expression in the brain3.
In summary, we compared the transcriptional profiles of DLPFC superficial (layer II and III) and deep (layer V and VI) pyramidal neurons from control and schizophrenia subjects. Our pathway analysis showed results consistent with previous reports, including implicated pathways involved in ubiquitin-dependent proteolysis, mitochondria function, glutamatergic synapse, and postsynaptic density in schizophrenia. We also identified novel pathways related to protein modification, specifically peptidyl-threonine phosphorylation, protein oxidation, and protein poly ubiquitination, and olfactory sensation in schizophrenia. In addition, we also detected a large number of immune related pathways, which suggests alterations of immune functions in both superficial and deep pyramidal neurons in schizophrenia. Our study provides new insight regarding the pathophysiology of schizophrenia at the cell level, yielding new directions for future investigation, including verifying these detected immune pathways in schizophrenia and control iPSCs; characterizing how olfactory pathway alterations could potentially affect olfactory sensation in schizophrenia patients; and confirming these findings in younger schizophrenia subjects with a shorter disease course.
Supplementary Material
Acknowledgement
We acknowledge Brett Mcintyre, Jiwon Lee, and Roshni Panda from Institute of Medical Sciences, University of Toronto, and Centre for Addiction and Mental Health, Toronto, Ontario, Canada, for their contribution in curating the antipsychotic datasets and providing guidance. Grant support: R01 MH107487, R01 AG05759, R01 MH121102, R01 MH094445, R21 MH107916, RC1 MH088752.
Footnotes
Conflict of interest statement
The authors have no conflict of interest to declare.
References
- 1.Ross CA, Margolis RL, Reading SA, Pletnikov M, Coyle JT. Neurobiology of schizophrenia. Neuron 2006; 52(1): 139–153. [DOI] [PubMed] [Google Scholar]
- 2.Schizophrenia Freedman R.. N Engl J Med 2003; 349(18): 1738–1749. [DOI] [PubMed] [Google Scholar]
- 3.McCullumsmith RE, Hammond JH, Shan D, Meador-Woodruff JH. Postmortem brain: an underutilized substrate for studying severe mental illness. Neuropsychopharmacology 2014; 39(1): 65–87. [DOI] [PMC free article] [PubMed] [Google Scholar]
- 4.McCullumsmith RE, Meador-Woodruff JH. Novel approaches to the study of postmortem brain in psychiatric illness: old limitations and new challenges. Biol Psychiatry 2011; 69(2): 127–133. [DOI] [PubMed] [Google Scholar]
- 5.McCullumsmith RE, O’Donovan SM, Drummond JB, Benesh FS, Simmons M, Roberts R et al. Cell-specific abnormalities of glutamate transporters in schizophrenia: sick astrocytes and compensating relay neurons? Mol Psychiatry 2016; 21(6): 823–830. [DOI] [PMC free article] [PubMed] [Google Scholar]
- 6.O’Donovan SM, Sullivan C, Koene R, Devine E, Hasselfeld K, Moody CL et al. Cell-subtype-specific changes in adenosine pathways in schizophrenia. Neuropsychopharmacology 2018; 43(8): 1667–1674. [DOI] [PMC free article] [PubMed] [Google Scholar]
- 7.O’Donovan SM, Hasselfeld K, Bauer D, Simmons M, Roussos P, Haroutunian V et al. Glutamate transporter splice variant expression in an enriched pyramidal cell population in schizophrenia. Transl Psychiatry 2015; 5: e579. [DOI] [PMC free article] [PubMed] [Google Scholar]
- 8.Sullivan CR, Mielnik CA, O’Donovan SM, Funk AJ, Bentea E, DePasquale EA et al. Connectivity Analyses of Bioenergetic Changes in Schizophrenia: Identification of Novel Treatments. Mol Neurobiol 2019; 56(6): 4492–4517. [DOI] [PMC free article] [PubMed] [Google Scholar]
- 9.Sodhi MS, Simmons M, McCullumsmith R, Haroutunian V, Meador-Woodruff JH. Glutamatergic gene expression is specifically reduced in thalamocortical projecting relay neurons in schizophrenia. Biol Psychiatry 2011; 70(7): 646–654. [DOI] [PMC free article] [PubMed] [Google Scholar]
- 10.Sullivan CR, Koene RH, Hasselfeld K, O’Donovan SM, Ramsey A, McCullumsmith RE. Neuron-specific deficits of bioenergetic processes in the dorsolateral prefrontal cortex in schizophrenia. Mol Psychiatry 2019; 24(9): 1319–1328. [DOI] [PMC free article] [PubMed] [Google Scholar]
- 11.Gerfen CR, Economo MN, Chandrashekar J. Long distance projections of cortical pyramidal neurons. J Neurosci Res 2018; 96(9): 1467–1475. [DOI] [PMC free article] [PubMed] [Google Scholar]
- 12.Oni-Orisan A, Kristiansen LV, Haroutunian V, Meador-Woodruff JH, McCullumsmith RE. Altered vesicular glutamate transporter expression in the anterior cingulate cortex in schizophrenia. Biol Psychiatry 2008; 63(8): 766–775. [DOI] [PMC free article] [PubMed] [Google Scholar]
- 13.Han W, Sestan N. Cortical projection neurons: sprung from the same root. Neuron 2013; 80(5): 1103–1105. [DOI] [PMC free article] [PubMed] [Google Scholar]
- 14.Shukla R, Prevot TD, French L, Isserlin R, Rocco BR, Banasr M et al. The Relative Contributions of Cell-Dependent Cortical Microcircuit Aging to Cognition and Anxiety. Biol Psychiatry 2019; 85(3): 257–267. [DOI] [PubMed] [Google Scholar]
- 15.Arion D, Huo Z, Enwright JF, Corradi JP, Tseng G, Lewis DA. Transcriptome Alterations in Prefrontal Pyramidal Cells Distinguish Schizophrenia From Bipolar and Major Depressive Disorders. Biol Psychiatry 2017; 82(8): 594–600. [DOI] [PMC free article] [PubMed] [Google Scholar]
- 16.Arion D, Corradi JP, Tang S, Datta D, Boothe F, He A et al. Distinctive transcriptome alterations of prefrontal pyramidal neurons in schizophrenia and schizoaffective disorder. Mol Psychiatry 2015; 20(11): 1397–1405. [DOI] [PMC free article] [PubMed] [Google Scholar]
- 17.Beneyto M, Kristiansen LV, Oni-Orisan A, McCullumsmith RE, Meador-Woodruff JH. Abnormal glutamate receptor expression in the medial temporal lobe in schizophrenia and mood disorders. Neuropsychopharmacology 2007; 32(9): 1888–1902. [DOI] [PubMed] [Google Scholar]
- 18.McCullumsmith RE, Meador-Woodruff JH. Striatal excitatory amino acid transporter transcript expression in schizophrenia, bipolar disorder, and major depressive disorder. Neuropsychopharmacology 2002; 26(3): 368–375. [DOI] [PubMed] [Google Scholar]
- 19.Schmitt A, Leonardi-Essmann F, Durrenberger PF, Wichert SP, Spanagel R, Arzberger T et al. Structural synaptic elements are differentially regulated in superior temporal cortex of schizophrenia patients. Eur Arch Psychiatry Clin Neurosci 2012; 262(7): 565–577. [DOI] [PMC free article] [PubMed] [Google Scholar]
- 20.Wu JQ, Wang X, Beveridge NJ, Tooney PA, Scott RJ, Carr VJ et al. Transcriptome sequencing revealed significant alteration of cortical promoter usage and splicing in schizophrenia. PLoS One 2012; 7(4): e36351. [DOI] [PMC free article] [PubMed] [Google Scholar]
- 21.Hwang Y, Kim J, Shin JY, Kim JI, Seo JS, Webster MJ et al. Gene expression profiling by mRNA sequencing reveals increased expression of immune/inflammation-related genes in the hippocampus of individuals with schizophrenia. Transl Psychiatry 2013; 3: e321. [DOI] [PMC free article] [PubMed] [Google Scholar]
- 22.Pietersen CY, Mauney SA, Kim SS, Lim MP, Rooney RJ, Goldstein JM et al. Molecular profiles of pyramidal neurons in the superior temporal cortex in schizophrenia. J Neurogenet 2014; 28(1–2): 53–69. [DOI] [PMC free article] [PubMed] [Google Scholar]
- 23.Arion D, Horvath S, Lewis DA, Mirnics K. Infragranular gene expression disturbances in the prefrontal cortex in schizophrenia: signature of altered neural development? Neurobiol Dis 2010; 37(3): 738–746. [DOI] [PMC free article] [PubMed] [Google Scholar]
- 24.Beneyto M, Meador-Woodruff JH. Lamina-specific abnormalities of AMPA receptor trafficking and signaling molecule transcripts in the prefrontal cortex in schizophrenia. Synapse 2006; 60(8): 585–598. [DOI] [PubMed] [Google Scholar]
- 25.Korostynski M, Piechota M, Dzbek J, Mlynarski W, Szklarczyk K, Ziolkowska B et al. Novel drug-regulated transcriptional networks in brain reveal pharmacological properties of psychotropic drugs. BMC Genomics 2013; 14: 606. [DOI] [PMC free article] [PubMed] [Google Scholar]
- 26.Sun W, Lee S, Zhabotynsky V, Zou F, Wright FA, Crowley JJ et al. Transcriptome atlases of mouse brain reveals differential expression across brain regions and genetic backgrounds. G3 (Bethesda) 2012; 2(2): 203–211. [DOI] [PMC free article] [PubMed] [Google Scholar]
- 27.Kondo MA, Tajinda K, Colantuoni C, Hiyama H, Seshadri S, Huang B et al. Unique pharmacological actions of atypical neuroleptic quetiapine: possible role in cell cycle/fate control. Transl Psychiatry 2013; 3: e243. [DOI] [PMC free article] [PubMed] [Google Scholar]
- 28.Rizig MA, McQuillin A, Ng A, Robinson M, Harrison A, Zvelebil M et al. A gene expression and systems pathway analysis of the effects of clozapine compared to haloperidol in the mouse brain implicates susceptibility genes for schizophrenia. J Psychopharmacol 2012; 26(9): 1218–1230. [DOI] [PubMed] [Google Scholar]
- 29.Kim Y, Giusti-Rodriguez P, Crowley JJ, Bryois J, Nonneman RJ, Ryan AK et al. Comparative genomic evidence for the involvement of schizophrenia risk genes in antipsychotic effects. Mol Psychiatry 2018; 23(3): 708–712. [DOI] [PMC free article] [PubMed] [Google Scholar]
- 30.a Wengen DF. [Alternatives to flaring spreader flaps and upper lateral advancement for the internal nasal valve]. HNO 2012; 60(7): 595–596. [DOI] [PubMed] [Google Scholar]
- 31.Yamaguchi KD, Ruderman DL, Croze E, Wagner TC, Velichko S, Reder AT et al. IFN-beta-regulated genes show abnormal expression in therapy-naive relapsing-remitting MS mononuclear cells: gene expression analysis employing all reported protein-protein interactions. J Neuroimmunol 2008; 195(1–2): 116–120. [DOI] [PubMed] [Google Scholar]
- 32.Khaled Alganem RS, Eby Hunter, Abel Mackenzie, Zhang Xiaolu, McIntyre William Brett, Lee Jiwon, Au-Yeung Christy, Asgariroozbehani Roshanak, Panda Roshni, O’Donovan Sinead M, Funk Adam, Hahn Margaret, Meller Jarek, McCullumsmith Robert. Kaleidoscope: A New Bioinformatics Pipeline Web Application for In Silico Hypothesis Exploration of Omics Signatures. bioRxiv 2020. [Google Scholar]
- 33.Katsel P, Davis KL, Gorman JM, Haroutunian V. Variations in differential gene expression patterns across multiple brain regions in schizophrenia. Schizophr Res 2005; 77(2–3): 241–252. [DOI] [PubMed] [Google Scholar]
- 34.Khandaker GM, Cousins L, Deakin J, Lennox BR, Yolken R, Jones PB. Inflammation and immunity in schizophrenia: implications for pathophysiology and treatment. Lancet Psychiatry 2015; 2(3): 258–270. [DOI] [PMC free article] [PubMed] [Google Scholar]
- 35.Birnbaum R, Jaffe AE, Chen Q, Shin JH, BrainSeq C, Kleinman JE et al. Investigating the neuroimmunogenic architecture of schizophrenia. Mol Psychiatry 2018; 23(5): 1251–1260. [DOI] [PubMed] [Google Scholar]
- 36.Cai HQ, Catts VS, Webster MJ, Galletly C, Liu D, O’Donnell M et al. Increased macrophages and changed brain endothelial cell gene expression in the frontal cortex of people with schizophrenia displaying inflammation. Mol Psychiatry 2018. [DOI] [PMC free article] [PubMed] [Google Scholar]
- 37.Mowry BJ, Gratten J. The emerging spectrum of allelic variation in schizophrenia: current evidence and strategies for the identification and functional characterization of common and rare variants. Mol Psychiatry 2013; 18(1): 38–52. [DOI] [PubMed] [Google Scholar]
- 38.Pandey GN, Rizavi HS, Zhang H, Ren X. Abnormal gene and protein expression of inflammatory cytokines in the postmortem brain of schizophrenia patients. Schizophr Res 2018; 192: 247–254. [DOI] [PMC free article] [PubMed] [Google Scholar]
- 39.Reale M, Patruno A, De Lutiis MA, Pesce M, Felaco M, Di Giannantonio M et al. Dysregulation of chemo-cytokine production in schizophrenic patients versus healthy controls. BMC Neurosci 2011; 12: 13. [DOI] [PMC free article] [PubMed] [Google Scholar]
- 40.Lesh TA, Careaga M, Rose DR, McAllister AK, Van de Water J, Carter CS et al. Cytokine alterations in first-episode schizophrenia and bipolar disorder: relationships to brain structure and symptoms. J Neuroinflammation 2018; 15(1): 165. [DOI] [PMC free article] [PubMed] [Google Scholar]
- 41.Maxeiner HG, Marion Schneider E, Kurfiss ST, Brettschneider J, Tumani H, Bechter K. Cerebrospinal fluid and serum cytokine profiling to detect immune control of infectious and inflammatory neurological and psychiatric diseases. Cytokine 2014; 69(1): 62–67. [DOI] [PubMed] [Google Scholar]
- 42.Wang AK, Miller BJ. Meta-analysis of Cerebrospinal Fluid Cytokine and Tryptophan Catabolite Alterations in Psychiatric Patients: Comparisons Between Schizophrenia, Bipolar Disorder, and Depression. Schizophr Bull 2018; 44(1): 75–83. [DOI] [PMC free article] [PubMed] [Google Scholar]
- 43.Soderlund J, Schroder J, Nordin C, Samuelsson M, Walther-Jallow L, Karlsson H et al. Activation of brain interleukin-1beta in schizophrenia. Mol Psychiatry 2009; 14(12): 1069–1071. [DOI] [PMC free article] [PubMed] [Google Scholar]
- 44.Altamura AC, Pozzoli S, Fiorentini A, Dell’osso B. Neurodevelopment and inflammatory patterns in schizophrenia in relation to pathophysiology. Prog Neuropsychopharmacol Biol Psychiatry 2013; 42: 63–70. [DOI] [PubMed] [Google Scholar]
- 45.Garver DL, Tamas RL, Holcomb JA. Elevated interleukin-6 in the cerebrospinal fluid of a previously delineated schizophrenia subtype. Neuropsychopharmacology 2003; 28(8): 1515–1520. [DOI] [PubMed] [Google Scholar]
- 46.Hayes LN, Severance EG, Leek JT, Gressitt KL, Rohleder C, Coughlin JM et al. Inflammatory molecular signature associated with infectious agents in psychosis. Schizophr Bull 2014; 40(5): 963–972. [DOI] [PMC free article] [PubMed] [Google Scholar]
- 47.Mittleman BB, Castellanos FX, Jacobsen LK, Rapoport JL, Swedo SE, Shearer GM. Cerebrospinal fluid cytokines in pediatric neuropsychiatric disease. J Immunol 1997; 159(6): 2994–2999. [PubMed] [Google Scholar]
- 48.Stefansson H, Ophoff RA, Steinberg S, Andreassen OA, Cichon S, Rujescu D et al. Common variants conferring risk of schizophrenia. Nature 2009; 460(7256): 744–747. [DOI] [PMC free article] [PubMed] [Google Scholar]
- 49.Osimo EF, Beck K, Reis Marques T, Howes OD. Synaptic loss in schizophrenia: a meta-analysis and systematic review of synaptic protein and mRNA measures. Mol Psychiatry 2019; 24(4): 549–561. [DOI] [PMC free article] [PubMed] [Google Scholar]
- 50.Glantz LA, Lewis DA. Decreased dendritic spine density on prefrontal cortical pyramidal neurons in schizophrenia. Arch Gen Psychiatry 2000; 57(1): 65–73. [DOI] [PubMed] [Google Scholar]
- 51.Bauer D, Gupta D, Harotunian V, Meador-Woodruff JH, McCullumsmith RE. Abnormal expression of glutamate transporter and transporter interacting molecules in prefrontal cortex in elderly patients with schizophrenia. Schizophr Res 2008; 104(1–3): 108–120. [DOI] [PMC free article] [PubMed] [Google Scholar]
- 52.Harrison PJ, Law AJ, Eastwood SL. Glutamate receptors and transporters in the hippocampus in schizophrenia. Ann N Y Acad Sci 2003; 1003: 94–101. [DOI] [PubMed] [Google Scholar]
- 53.Berdenis van Berlekom A, Muflihah CH, Snijders G, MacGillavry HD, Middeldorp J, Hol EM et al. Synapse Pathology in Schizophrenia: A Meta-analysis of Postsynaptic Elements in Postmortem Brain Studies. Schizophr Bull 2019. [DOI] [PMC free article] [PubMed] [Google Scholar]
- 54.Bousman CA, Chana G, Glatt SJ, Chandler SD, Lucero GR, Tatro E et al. Preliminary evidence of ubiquitin proteasome system dysregulation in schizophrenia and bipolar disorder: convergent pathway analysis findings from two independent samples. Am J Med Genet B Neuropsychiatr Genet 2010; 153B(2): 494–502. [DOI] [PMC free article] [PubMed] [Google Scholar]
- 55.Liu C, Bousman CA, Pantelis C, Skafidas E, Zhang D, Yue W et al. Pathway-wide association study identifies five shared pathways associated with schizophrenia in three ancestral distinct populations. Transl Psychiatry 2017; 7(2): e1037. [DOI] [PMC free article] [PubMed] [Google Scholar]
- 56.Rubio MD, Wood K, Haroutunian V, Meador-Woodruff JH. Dysfunction of the ubiquitin proteasome and ubiquitin-like systems in schizophrenia. Neuropsychopharmacology 2013; 38(10): 1910–1920. [DOI] [PMC free article] [PubMed] [Google Scholar]
- 57.McCurdy RD, Feron F, Perry C, Chant DC, McLean D, Matigian N et al. Cell cycle alterations in biopsied olfactory neuroepithelium in schizophrenia and bipolar I disorder using cell culture and gene expression analyses. Schizophr Res 2006; 82(2–3): 163–173. [DOI] [PubMed] [Google Scholar]
- 58.Schiffer M, von Gersdorff G, Bitzer M, Susztak K, Bottinger EP. Smad proteins and transforming growth factor-beta signaling. Kidney Int Suppl 2000; 77: S45–52. [DOI] [PubMed] [Google Scholar]
- 59.Horiuchi Y, Kondo MA, Okada K, Takayanagi Y, Tanaka T, Ho T et al. Molecular signatures associated with cognitive deficits in schizophrenia: a study of biopsied olfactory neural epithelium. Transl Psychiatry 2016; 6(10): e915. [DOI] [PMC free article] [PubMed] [Google Scholar]
- 60.Kiparizoska S, Ikuta T. Disrupted Olfactory Integration in Schizophrenia: Functional Connectivity Study. Int J Neuropsychopharmacol 2017; 20(9): 740–746. [DOI] [PMC free article] [PubMed] [Google Scholar]
- 61.Turetsky BI, Moberg PJ, Roalf DR, Arnold SE, Gur RE. Decrements in volume of anterior ventromedial temporal lobe and olfactory dysfunction in schizophrenia. Arch Gen Psychiatry 2003; 60(12): 1193–1200. [DOI] [PubMed] [Google Scholar]
- 62.Egbujo CN, Sinclair D, Borgmann-Winter KE, Arnold SE, Turetsky BI, Hahn CG. Molecular evidence for decreased synaptic efficacy in the postmortem olfactory bulb of individuals with schizophrenia. Schizophr Res 2015; 168(1–2): 554–562. [DOI] [PMC free article] [PubMed] [Google Scholar]
- 63.Pantazopoulos H, Boyer-Boiteau A, Holbrook EH, Jang W, Hahn CG, Arnold SE et al. Proteoglycan abnormalities in olfactory epithelium tissue from subjects diagnosed with schizophrenia. Schizophr Res 2013; 150(2–3): 366–372. [DOI] [PMC free article] [PubMed] [Google Scholar]
- 64.Borgmann-Winter KE, Wang HY, Ray R, Willis BR, Moberg PJ, Rawson NE et al. Altered G Protein Coupling in Olfactory Neuroepithelial Cells From Patients With Schizophrenia. Schizophr Bull 2016; 42(2): 377–385. [DOI] [PMC free article] [PubMed] [Google Scholar]
- 65.Bychkov ER, Ahmed MR, Gurevich VV, Benovic JL, Gurevich EV. Reduced expression of G protein-coupled receptor kinases in schizophrenia but not in schizoaffective disorder. Neurobiol Dis 2011; 44(2): 248–258. [DOI] [PMC free article] [PubMed] [Google Scholar]
- 66.McCullumsmith RE, Stincic TL, Agrawal SM, Meador-Woodruff JH. Differential effects of antipsychotics on haloperidol-induced vacuous chewing movements and subcortical gene expression in the rat. Eur J Pharmacol 2003; 477(2): 101–112. [DOI] [PubMed] [Google Scholar]
- 67.Funk AJ, Rumbaugh G, Harotunian V, McCullumsmith RE, Meador-Woodruff JH. Decreased expression of NMDA receptor-associated proteins in frontal cortex of elderly patients with schizophrenia. Neuroreport 2009; 20(11): 1019–1022. [DOI] [PMC free article] [PubMed] [Google Scholar]
- 68.Shi Y, He M. Differential gene expression identified by RNA-Seq and qPCR in two sizes of pearl oyster (Pinctada fucata). Gene 2014; 538(2): 313–322. [DOI] [PubMed] [Google Scholar]
Associated Data
This section collects any data citations, data availability statements, or supplementary materials included in this article.