

Abstract
Developmental methylmercury (MeHg) exposure selectively targets the cerebral and cerebellar cortices, as seen by disruption of cytoarchitecture and glutamatergic (GLUergic) neuron hypoplasia. To begin to understand the mechanisms of this loss of GLUergic neurons, we aimed to develop a model of developmental MeHg neurotoxicity in human-induced pluripotent stem cells differentiating into cortical GLUergic neurons. Three dosing paradigms at 0.1μM and 1.0μM MeHg, which span different stages of neurodevelopment and reflect toxicologically relevant accumulation levels seen in human studies and mammalian models, were established. With these exposure paradigms, no changes were seen in commonly studied endpoints of MeHg toxicity, including viability, proliferation, and glutathione levels. However, MeHg exposure induced changes in mitochondrial respiration and glycolysis and in markers of neuronal differentiation. Our novel data suggests that GLUergic neuron hypoplasia seen with MeHg toxicity may be due to the partial inhibition of neuronal differentiation, given the increased expression of the early dorsal forebrain marker FOXG1 and corresponding decrease in expression on neuronal markers MAP2 and DCX and the deep layer cortical neuronal marker TBR1. Future studies should examine the persistent and latent functional effects of this MeHg-induced disruption of neuronal differentiation as well as transcriptomic and metabolomic alterations that may mediate MeHg toxicity.
Keywords: Methylmercury, human-induced pluripotent stem cells, developmental neurotoxicity, glutamatergic neurons
1. Introduction
Methylmercury (MeHg) has long been studied as a developmental neurotoxicant, with the main route of exposure for humans through fish consumption. Historic accidental poisonings that occurred in Minamata Bay, Japan have shown that the nervous system of the developing fetus, exposed in utero, is targeted by MeHg toxicity, whereas the mothers remained relatively unharmed (Harada, 1978). Specifically, autopsies revealed that the cerebral and cerebellar cortices are the most notably affected regions of the brain, while the hypothalamus, basal ganglia, and brainstem appeared to be unaffected upon histological examination ( Choi et al., 1978; Harada, 1995; Hunter & Russell, 1954; Matsumoto et al., 1965). In utero exposure to MeHg resulted in gross morphological changes and atrophied cells in the cortex. However, the cerebellum exhibited a specific loss of the glutamatergic (GLUergic) granule cells, with the GABAergic Purkinje cells being left largely unaltered in both congenital cases (Harada, 1995) and adult cases (Hunter & Russell, 1954). These studies suggest that GLUergic neurons and their progenitors may be preferentially targeted by MeHg toxicity
The toxicity of MeHg in GLUergic neuronal lineages has been extensively studied using both in vivo and in vitro models. Similar to human autopsy studies, rodent models of MeHg exposure have shown that the cerebral and cerebellar cortices appear to be preferentially targeted by MeHg, with granule cells in the cerebellar cortex being disrupted and Purkinje cells unharmed (Miyamoto et al., 2001; Sager, et al., 1984; Sakamoto et al., 1998). Disruption of glutamate homeostasis is thought to play a pivotal role in MeHg-induced neurotoxicity (Aschner & Syversen, 2005;Aschner et al., 2007). Glutamate uptake in primary astrocytes is inhibited by MeHg, while glutamate efflux is enhanced ( Aschner et al., 1993). MeHg also decreases glutamate uptake into rat synaptic vesicles (Porciuncula et al., 2003) and intracellular glutamate content in mouse cerebellar granule cells (Vendrell et al., 2007). Ex vivo studies in rodent cortical slices have also shown that MeHg reduces glutamate uptake (Farina et al., 2003; Manfroi et al., 2004; Moretto et al., 2005). Microdialysis sampling of rat frontal cortex supported these findings, showing increased extracellular glutamate concentrations upon MeHg exposure (Juarez et al., 2002). Excess synaptic glutamate has been long known to cause damage of juxtaposed neurons, a phenomenon known as excitotoxicity (Choi, 1988; Choi et al., 1987; Finkbeiner & Stevens, 1988; Rothstein et al., 1993).
The most frequently referenced mechanisms of MeHg toxicity include disruption of mitochondrial function and oxidative stress, MeHg binding to and inhibiting sulfhydryl and selenol groups, disruption of calcium signaling and microtubule assembly (Aschner & Syversen, 2005; Caito & Aschner, 2015; Castoldi et al., 2001; Clarkson & Magos, 2006; Farina et al., 2011). Regardless, the exact mechanisms of MeHg toxicity and targeting the development of GLUergic neurons is unknown, as are the most sensitive timepoints in development. Although, it has been suggested that the human fetal brain, especially in the second trimester, may be particularly sensitive to MeHg due to MeHg-induced interference with cell migration and division and the brain’s inability for repair (Clarkson & Magos, 2006; Marsh et al., 1981), little data are available to support these hypotheses. Understanding these mechanisms and sensitive timepoints may be critical to developing more accurate exposure guidelines for fish consumption during pregnancy, as fish consumption comes with both the risk of MeHg exposure and the benefits of important nutrients such as omega-3 fatty acids (Mahaffey, 2004; Mahaffey et al., 2011). In fact, epidemiological studies, primarily from the Seychelles, have found no association between MeHg exposure and neurodevelopmental deficits, and it has thus been hypothesized that the benefits of fish consumption outweigh the toxic effects of MeHg (Myers et al., 2000). Alternatively, it has been suggested that genetics may play role in the discrepancies among studies examining the association between MeHg exposure and neurodevelopmental outcomes (Julvez & Grandjean, 2013). For example, single nucleotide polymorphisms within cytochrome p450 genes, glutathione-related genes, and in ABC transporter genes have been associated with Hg body burden (Barcelos et al., 2013; Custodio et al., 2004; de Oliveira et al., 2014; Gundacker et al., 2007; Llop et al., 2014; Schlawicke Engstrom et al., 2008) and neurodevelopmental outcomes (Engstrom et al., 2016; Llop et al., 2017; Wahlberg et al., 2018). However, due to confounding variables such as multiple toxic exposures and unknown timelines of exposures, both genetic predispositions and sensitive timepoints of MeHg exposure may be difficult to deduct from these studies.
Therefore, we aimed here to establish human induced pluripotent stem cells (hiPSCs) as a model to study the effects of chronic developmental MeHg exposure. hiPSC-derived models of neurodevelopment are attractive models, because they provide a platform to incorporate subject-specific genetics and the possibility to study the development of any neuronal lineage (Prince et al., 2019). To this end, we examined the effects of MeHg on cell death, glutathione levels, mitochondrial function, and cortical GLUergic neuron differentiation. To better characterize sensitive times of development, we established exposure paradigms that cover a period of time early in neurodevelopment when radial glial cells first arise (early neurodevelopmental exposure, “E”) and also later in neurodevelopment when the intermediate progenitor cells first arise and subsequently terminally differentiate into immature post-mitotic GLUergic neurons (late neurodevelopmental exposure, “L”), or exposure across both time periods (“E+L”). These exposures, resulting in cellular MeHg levels that reflect estimated humanexposure levels, disrupt neuronal development, as seen by changes in expression of established developmental markers.
2. Materials and Methods
2.1. Differentiation of cortical GLUergic neurons.
Five lines of human induced pluripotent stem cells (hiPSCs), derived from three healthy subjects (CA11, CD10, CC1, CC3, and CC5 lines), were used for this study. Methods of creating and validating these lines are described elsewhere (Neely et al.., 2011; Tidball et al., 2016). hiPSCs were derived from primary human fibroblasts and stem cells were maintained as described previously (Neely et al., 2011). Briefly, stem cells were maintained in mTeSR1 medium (STEMCELL Technologies, 85850) on Matrigel (Fisher, 08-774-552) coated 6-well plates. Upon reaching 90–100% confluency, stem cells were dissociated from plates with accutase (Fisher NC9839010), resuspended in mTeSR1 plus 10μM rock inhibitor, Y-27632 (Selleck Chemicals, S1049) and plated at a density of 20,000 cells/cm2 into Matrigel-coated 6 well plates. Upon reaching 80–90% confluency, cortical GLUergic neuronal differentiation was initiated. This protocol was derived from Chambers et al. (2009) (Chambers et al., 2009) and modifications have been previously described by our lab (Brown et al., 2016; Joshi et al., 2019; Neely et al., 2012). Upon initiating neuralization, mTeSR1 medium was replaced with neuralization medium containing Knockout DMEM/F12(Invitrogen, 12660), 15% Knockout serum (Invitrogen, 10828), 1x Glutamax (Invitrogen, 35050-061), 1X Pen/Strep (Fisher 15-140-122), 1X non-essential amino acids (Invitrogen, M7145), and 55μM β-mercaptoethanol (Sigma, M3148). Neuralization medium was supplemented with 10μM SB431542 (SB4) (either Tocris 1614 or Selleck Chemicals S1067) and 0.4μM LDN193189 (LDN) (either Stemgent 04-0074 or Selleck Chemicals S2618). This medium was replaced daily starting on day 0 (D0) of differentiation until D4 of differentiation. On D5 and D6, the medium was changed to 75% neuralization medium and 25% Studer N2 medium (DMEM/F12 + glutamax (Invitrogen 10565-018), 4.5g/L D-glucose, and N2 supplement (Invitrogen 17502-048), plus LDN and SB4, as above). From D7–8, the medium was changed to 50% neuralization medium and 50% Studer N2 medium with SB4 and LDN, and from D9–10 to 75% neuralization medium and 25% Studer N2 medium with SB4 and LDN. On D11 through the rest of the experiment, the medium consists of Cortical media, which is 50% Neurobasal medium (Life Technologies 21103-049) with B27 supplement (Life Technologies 17504044) and 1X glutamax and 50%DMEM/F12 + glutamax with N2 supplement, 1X non-essential amino acids, 1X Pen/Strep, and 100μM β-mercaptoethanol and is replaced daily.
2.2. Exposures to MeHg.
Methylmercury chloride dissolved in water at 1000ppm (4mM) was purchased from Alfa Aesar (33553) and dissolved in cell culture media to final concentrations of 0.1 and 1.0μM. Three separate exposure paradigms were established. For exposure during the early stage of differentiation (E exposure), cells were exposed for 6 days from D4 until D10 of differentiation, replacing the media daily. On D10, the media was replaced with MeHg-free media daily until the end of the experiment. For the exposures during later stage of differentiation (L exposure), MeHg was added to the cell culture media beginning on D14 of differentiation and replaced daily until D20, when the MeHg media was replaced with MeHg-free media daily until the end of the experiment. For exposures covering both early and later periods of differentiation (E+L exposure) cells were exposed between both D4–10 and D14–20.
2.3. Cell preparation and collection.
In all experiments, on D11 or D21 of differentiation, MeHg exposed cells were rinsed, lifted off the plate with accutase, resuspended in cell culture medium plus 10μM rock inhibitor, and centrifugated at 200g for 5 minutes. Cells were resuspended in the appropriate day’s medium containing rock inhibitor (10μM) with a glass pipette. Cells were then counted on a Cellometer Auto T4 (Nexcelom Bioscience).
2.4. Mercury quantification.
Cell collection.
Cells were exposed and collected as described above. Cell pellets were lysed in 400–500μL of RIPA containing protease and phosphatase inhibitor cocktails (Sigma P8340, P0044, P5726). 50–100μL of the total cell lysate was used for mercury quantification. Cellular total mercury was measured using a tri-cell Direct Mercury Analyzer (DMA-80, Milestone Scientific). A 1000μg/mL Hg stock standard (LGC Standards VHG-PHGN-250) was used for calibration. From this stock, three standards were prepared via gravimetric serial dilutions with final concentrations of 1000ng/mL, 100ng/mL, and 10ng/mL. All standards were prepared with 0.4% HCl (Ricca Chemical, RABH0010-500D1) in Ultrapure deinonized water. These standards were then used to calibrate the DMA-80 from 0 to 500ng of Hg, based on the height of the atomic absorbance peak of Hg at 245nm. Each sample was loaded into a quartz boat and the weight of the sample was recorded. The DMA-80 was set to dry the sample for 1 minute at 200°C and decompose the sample at 725°C for 1.5 minutes. The limit of quantification was determined to be 0.5ng of Hg. Total ng of Hg was normalized to mg of protein.The remainingcell lysates were centrifugated at 20,000xg for 15 minutes and the protein concentration of the supernatant determined by BCA assay as per the manufacturer’s instructions (Thermo Scientific 23227). Statistical analysis. Data represent 5–8 independent replicates from CA11 (n=2–3), CC3 (n=2–3), and CD10 (n=2). Differences in mercury levels between the D11 E and D21 L and E+L exposures were examined using a one-way analysis of variance (ANOVA) with Tukey’s multiple comparison’s test with GraphPad Prism version 9.0.0 (La Jolla, California USA). Any outliers were detected using the Graphpad software Robust Regression and Outlier Removal (ROUT) method, with the Q coefficient set to 1%.
2.5. Cell Counts Viability.
Cells were grown in 6 well plates and exposed and collected as described above. The concentration of cells in suspension was determined with a Cellometer Auto T4, and total cell counts were noted by multiplying concentration by total suspension volume. For viability assays, an equivalent fraction of each cell suspension was then plated on black 96 well plates, coated in Matrigel. After 24 hours, 2μL of 10% triton X was added to some wells for kill wells, for background subtraction. 20μL of Cell Titer Blue (Promega G8081) was added to each well and the fluorescence signal was read on a Synergy H1 microplate reader (BioTek) at 560/590nm every 15 minutes for two hours. A single time point in the linear phase of the curve was chosen for quantification, to ensure that saturation had not occurred. Background was subtracted and each exposure was normalized to its vehicle control.Statistical Analysis. Data represent 5 independent replicates (CC3, n=3 and CD10, n=2). For D11 cell counts, a one-way ANOVA was performed using GraphPad Prism version 9.0.0 (La Jolla, California USA). For D12 cell viability, a one-way ANOVA with Tukey’s multiple comparisons test was conducted. For D21 cell counts, a two-way ANOVA with Dunnet’s multiple comparisons test was performed. For D22 cell viability, a two-way ANOVA, to examine interactions between exposure time (E, L, and E+L) and MeHg concentration, with Tukey’s multiple comparisons test was conducted.
2.6. Net Proliferation:
On either D11 or D21 of differentiation, cells were plated in black 96-well plates coated with Matrigel at 150,000 cells/cm2 in the corresponding day’s media with rock inhibitor. Twenty-four hours after replating, cell viability was assessed on half of the plated cultures with a Cell Titer Blue assay according to the manufacturer’s instructions. Forty-eight hours after replating a Cell Titer Blue assay was performed on the other half of the plated cultures, to compare proliferation rates between control and MeHg treated cells. We assessed statistical significance using a repeated-measures ANOVA design that included both the 24-hour and 48-hour Cell Titer Blue data points (as repeated measures of viability for each sample replicate) for the MeHg exposed samples normalized to their respective vehicle control for each time point to provide a measure of net proliferation rate. Statistical Analysis. For the D12–13 proliferation assay, data represent 6 independent replicates (CC3, n=3; CC1, n=2, CC5, n=1). For the D22–23 proliferation assay, data represent 5 independent replicates (CC3, n=2; CC1, n=1; CC5, n=2) for the L exposure and 4 independent replicates for the E+ L exposure (CC3, n=2; CC1, n=1; CC5, n=1). The two-way repeated measures ANOVA with Sidak’s multiple comparisons test was conducted using GraphPad Prism version 9.0.0 (La Jolla, California USA).
2.7. Glutathione Assays.
On D11 and D21 of differentiation, cells were plated in black 96 well plates as described above. Twenty-four hours later, the medium was aspirated, the cells were washed with HBSS and lysed in 120μL of 1X Passive lysis buffer (Promega E1941). Glutathione content was quantified in 40μL of the cell lysate using the GSH-Glo assay (Promega V6911), according to the manufacturer’s protocols. Luminescence was read using a Synergy H1 microplate reader (BioTek) and normalized to the corresponding 0μM control luminescence reading.Statistical Analysis. For D12, the data represent 6 independent replicates (CC3, n=3; CC1, n=2, CC5, n=1). For D22, the data represent 5 independent replicates (CC3, n=2; CC1, n=1; CC5, n=2) for the L exposure and 4 independent replicates for the E+L exposure (CC3, n=2; CC1, n=1; CC5, n=1). A one-way ANOVA with Tukey’s multiple comparisons test was conducted using GraphPad Prism version 9.0.0 (La Jolla, California USA).
2.8. Extracellular metabolic flux analyses.
On D11 and D21 of differentiation, cells were plated in Seahorse XF96 V3 PS Cell Culture Microplates (Agilent 101085-004) as described above. The Seahorse XFe96 bioanalyzer (Agilent, Santa Clara, California) was used to conduct all experiments. One hour before the start of the assay, medium was replaced with XF Base Medium (Agilent). XF Base Medium was supplemented with 10mM glucose (Sigma-Aldrich), 2mM glutamine (Life Technologies), and 1mM pyruvate (Life Technologies). To determine basal, leak, and maximum respiration rates, the MitoStress Test program was used for recording 3 mix and measure cycles following the addition of each drug. 1μM oligomycin, 1μM FCCP, and 0.5μM rotenone and antimycin were determined to be the most effective concentrations, similar to previously published results which used the same concentrations with STHdh cells, with the exception of oligomycin which was used at 2μM (Warren et al., 2020). All compounds used for these experiments were obtained from Sigma-Aldrich. Following extracellular flux analysis, Hoechst (1:2000, Thermo Fisher Scientific) was added to each well to facilitate nuclear staining for cell counting. Cells were counted using the MetaXpress imager (Molecular Devices, Sunnyvale, California) with automated software. Assay measurements were normalized to cell number. To compare measurements between cell lines, OCR and ECAR values were mean-centered to the third measurement cycle before calculating basal, leak, and max OCR values, and basal ECAR values. Statistical Analysis. All statistics were conducted in Graphpad Prism or R (cran.r-project.org). For each exposure condition (E, L, and E+L), the cell lines (CC1, CC3, and CC5) were considered as independent replicates (CC1, n=8–14; CC3, n=8–16; CC5; n=8–14). For extracellular flux analysis, non-parametric permutation omnibus tests were performed to detect a main effect of MeHg concentration while using cell line as a second factor, using the ezPerm function. If a significant main effect of dose was found, post-hoc Dunn tests were performed with Benjamini-Yekutieli correction for multiple comparisons. Comparisons were considered significant if p < 0.05.
2.9. Quantitative Real Time Polymerase Chain Reaction (qPCR).
RNA Isolation.
Cell pellets were lysed in RLT Buffer Plus (Qiagen, 1053393) with 10μL/mL β-mercaptoethanol (Sigma, M3148), immediately flash frozen in liquid nitrogen, and stored at −80°C. For RNA isolation, a total volume of 350μL of the cell lysates was homogenized with a QIAshredder (Qiagen, 769656) by spinning at full speed (21,000 x g) for two minutes at room temperature. RNA was then isolated using the Invitrogen PureLink Mini Kit (Fisher 12-183-025) according to the manufacturer’s protocol. The optional on-column DNase digestion was performed with RNase-Free DNase (Qiagen, 79256). RNA was eluted from the column using nuclease free water (Invitrogen, 10977015). Elution was performed twice in 40μL of water each time, for a total of 80μL. RNA concentration was determined using a Nanodrop One microvolume UV-Vis Spectrophotometer (ThermoScientific). RNA samples were then divided into two RNase free microcentrifuge tubes and frozen at −80°C.cDNA synthesis. cDNA was synthesized using SuperScript III First-Strand kit (Invitrogen, 18080051), according to the manufacturer’s protocol. For each cDNA synthesis reaction, 300–1000ng of RNA was added to a reaction. The amount of RNA utilized was based on final RNA yield within a biological replicate and was matched between treated and control samples within a biological replicate. Oligo(dT)s were used as primers for these reactions and cDNA was stored at −20°C.qPCR. For qPCR experiments, SsoAdvanced Universal Probes Supermix (Biorad, 1725280), PrimePCR Primers, and PrimePCR Assays (Biorad) were used (Supplementary Table 1). cDNA was diluted to a concentration of 1.5ng/μL, assuming a 100% efficiency for the cDNA synthesis reactions, in nuclease free water (Invitrogen,10977015). 3μL cDNA was then added to each reaction, for a total of 4.5ng per reaction in a 384 well plate (Biorad HSP3905). PrimePCR Primers and Assays were diluted to a final concentration of 1X in the Supermix. A single reaction consisted of final volume of 10μL per well. PrimePCR Assays were utilized to ensure cDNA integrity and no gDNA contamination or other contamination that could influence results. Any samples not passing these quality control measures were discarded. qPCR was performed using a CFX384 Optics Module (Biorad). Actin was used as a reference gene, as it was not influenced by exposure (Supplementary Figure 1), and the ΔΔCt method was used to compare treatment to control (Livak & Schmittgen, 2001). Statistical Analysis. For D11, data represent 6–8 independent replicates (CA11). A one-way ANOVA with Tukey’s multiple comparisons test was conducted using GraphPad Prism version 9.0.0 (La Jolla, California USA). For D21, data represent 3–8 independent replicates (CA11). A two-way ANOVA, to examine interactions between exposure paradigm (E, L, E+L exposures) and MeHg concentration, with Tukey’s multiple comparisons test was conducted.
2.10. Immunocytochemistry.
Immunofluorescence staining.
At D11 or D21, cells were plated onto Greiner Bio-One Cellstar 96-well μclear Flat Bottomed Microplates (Fisher Scientific 07-000-166) for immunocytochemistry at a density of 90,000 cells/cm2. Cells were fixed 24 hours later with 4% paraformaldehyde for 30 minutes at room temperature. Cells were permeabilized in PBS with 0.2% Triton X-100 (PBS+) for 20 minutes and blocked in PBS with 5% donkey serum and 0.05% TritonX-100 (PBS++) for 2 hours. Primary antibodies were diluted in PBS++ and incubated on cells overnight at 4°C. Primary antibodies included: gt anti-SOX1 (R&D Systems AF3369) diluted 1:100, rb anti-PAX6 (BioLegend 901301) diluted 1:200, rb anti-Ki67 (Abcam Ab16667) diluted 1:100, rabbit anti-FOXG1 (Abcam AB18259) diluted 1:100, and mouse anti-MAP2 (ThermoFisher Scientific 131500) diluted 1:500. Secondaries used included: Alexa Fluor 488 AffiniPure donkey anti-goat IgG, donkey anti-mouse IgG (Jackson ImmunoResearch Laboratories 715-545-150), and donkey anti-rabbit IgG (Jackson ImmunoResearch Laboratories 715-545-152). Secondaries were diluted 1:800 in PBS++ and incubated for 3 hours at room temperature. Cells were incubated for 5 minutes with Hoechst nuclear dye (ThermoFisher Scientific H3570) at 2μg/mL and stored in PBS, protected from light, at 4°C until imaging.
Imaging and Quantification.
Cells were imaged using a Nikon Eclipse Ti2A inverted fluorescent microscope at 10X. A single image was gathered for each well by positioning the middle of the well in the plane of view. Each biological replicate contained two wells which were averaged together. Exposure time and cut-offs were standardized across all treatment groups and biological replicates. These settings were based on the no primary control wells and were set so that no background could be seen, ensuring that any signal seen was a positive signal. All images were then blinded against treatment group. Percentage of cells expressing each marker was quantified using ImageJ software (NIH). All nuclear stains were quantified by creating a threshold and using ImageJ’s Analyze Particles Feature. MAP2 was quantified using ImageJ’s multipoint feature. MAP2 positive cells were defined as any cell with a MAP2 positive projection longer than the length of the nucleus or any two cells that were interacting with a MAP2 positive projection.
Statistical analysis.
Data represent 3 independent replicates (CA11). For D11, a one-way ANOVA with Tukey’s multiple comparisons test was conducted using GraphPad Prism version 9.0.0 (La Jolla, California USA). For D21, a two-way ANOVA with matched values, to examine interactions between exposure time (E, L, and E+L) and MeHg concentration, with Tukey’s multiple comparisons test was conducted.
3. Results
3.1. Mercury levels 24 hours after E, L, and E+L exposures.
To understand how mercury accumulation compares to other studies, particularly epidemiological studies, we measured total mercury content in our cultures, 24 hours after the last exposure. At D11, our cells had accumulated an average of 11.3ng Hg/mg protein and 94.9ng Hg/mg protein, for the 0.1μM and 1.0μM E exposures, respectively (Figure 1A). At D21, cells accumulated an average of 10.9ng Hg/mg protein and 120.9ng Hg/mg protein, for the 0.1μM and 1.0μM L exposures respectively, and 13.4ng Hg/mg protein and 119.3ng Hg/mg protein, for the 0.1μM and 1.0μM E+L exposures, respectively (Figure 1B). No significant differences in Hg accumulation were seen between the D11, D21 L and D21 E+L exposure groups. All 0μM exposure groups measured below the 0.5ng Hg limit of quantification (Supplementary Figure 2).
Figure 1.

Hg uptake at days 11 and 21 of differentiation, 24 hours after MeHg exposure paradigms. Total Hg levels were assessed by DMA80 at D11 and D21 for the A.) 0.1μM and B.) 1.0 μM exposure paradigms. All values are expressed as mean ± SD (n=7–8)
3.2. Cell Viability and Cell Counts.
To quantify MeHg induced cytotoxicity, we examined cell viability through two methods, cell counts were performed on D11 and D21 (24 hours after MeHg exposure ended), and the cell titer blue (CTB) assays were performed on D12 and D22, 48 hours after MeHg exposure ended. Neither cell counts nor the Cell Titer Blue assay showed significant cell death at D12 (Figures 2A and 2C). At D21, no changes were seen in cell numbers (Figure 2B.). A small increase in signal was seen in the CTB assays at the 1.0μM L exposure (p=0.03) as well as the 1.0μM E+L exposure, although this value did not reach statistical significance (p=0.07) (Figure 2D). As there were no differences in cell numbers at D21, this increase may indicate that MeHg exposures are slightly increasing the metabolic activity, the proliferation rate, or survival rate after replating of the cells.
Figure 2.

The MeHg exposure paradigms do not significantly induce cell loss in differentiating cortical neurons. A). Cell counts at D11 of cells exposed to either 0.1 or 1.0μM from days 4 to 9 of differentiation (E exposure). B.) Cell counts at D21 of cells exposed to either 0.1 or 1.0μM during E, L, and E + L stages of differentiation. C.) Cell Titer Blue fluorescence (560/590), normalized to control, at D12 of cells exposed to either 0.1 or 1.0μM from D4 to 10 of differentiation (E exposure). D.) Cell Titer Blue fluorescence (560/590), normalized to control, at D22 of cells exposed to either 0.1 or 1.0 μM from during E, L, and E + L stages of differentiation. A two-way analysis indicated a MeHg-dependent increase in CTB fluorescence: Finteraction(4, 36) = 1.030, p=0.4049; Fexposure paradigm(2, 36) = 0.6890, p=0.5086; FMeHg(2, 36) = 5.027, p=0.019. *p=0.0284 with Tukey’s multiple comparison’s test. All values are expressed as mean ± SD (n=5).
3.3. Effects of MeHg on Cell Proliferation.
MeHg has previously been shown to alter cell cycle and proliferation (Kim et al., 2007; Breier et al., 2008; Burke et al., 2006; Sager et al., 1984). Therefore, we quantified the Cell Titer Blue (CTB) signals 48 and 72 hours after E, L, and E+L exposures ended. No effects of MeHg at any exposure paradigm on CTB signal were observed (Fig. 3). Thus, since we observed no cytotoxicity, and the cells are still proliferating at these times of differentiation, we conclude that MeHg does not affect proliferation of these cells. We further conclude that the MeHg-induced increase in CTB signal measured on D22 (Figure 2D) is not likely due to an increase in proliferation but rather an increase in metabolic reductase activities or a higher survival rate after replating of the cells.
Figure 3.

MeHg does not significantly alter cell proliferation in this model. Control normalized Cell Titer Blue signals of A.) E exposed cells at D12 and D13 (n=6) B.), D22 and 23 cells, L exposed (n=5) C.) and D22 and D23 cells, E+L exposed (n=4). Two-way repeated measures ANOVA with Sidak’s multiple comparisons test indicated no significant differences between exposure groups. All values are expressed as mean ± SD.
3.4. Glutathione levels upon MeHg exposure.
GSH and GSH precursors have also been shown to be protective of MeHg toxicity, while buthionine sulfoximine, which depletes GSH, potentiates MeHg toxicity (Sanfeliu et al., 2001; Shanker et al., 2005). Thus, as GSH plays an important role in MeHg toxicity, we examined GSH levels in our hiPSC model. GSH levels were examined on D12 and D22 of differentiation, 48 hours after the E, L, and E+L exposures ended. No significant changes in glutathione levels were seen in any of the exposure paradigms (Figure 4).
Figure 4.

No significant changes to total glutathione levels were seen with any of the MeHg exposure paradigms. Total glutathione per well was measured and normalized to 0μM control, at A). D12, 48 hours after the E exposure (n=6), B.) D22, 48 hours after the L exposure (n=5), and C.) D22, 48 hours after the E + L exposure (n=4). One-way ANOVA with Tukey’s multiple comparisons test indicated no significant differences between exposure groups. All values are expressed as mean ± SD.
3.5. Extracellular metabolic flux analyses.
We next evaluated if the MeHg developmental exposures were associated with a change in cellular energetics by performing a Seahorse MitoStress test and simultaneously measuring mitochondrial respiration (using oxygen consumption rate (OCR) measurements) and glycolysis (using extracellular acidification rate (ECAR) measurements). We observed subtle but significant changes in specific measures of cellular energetics across the different exposure types and stages. First, following the E exposure, we observed a subtle but significant decrease in glycolysis at D14, with no impact on mitochondrial respiration measures for both the 0.1μM exposure (p<0.0001) and the 1.0μM exposure (p=0.001) (Figure 5A). After the L exposure paradigm at D23, we observed a subtle but significant decrease in basal (p<0.0001) and maximum (p=0.002) OCR at the 1.0μM exposure level, with no effect on glycolysis (Figure 5B). A subtle but significant increase in maximum OCR was also seen with the 0.1μM exposure (p=0.014). Following the longer E+L exposure at D23, we observed a slight increase in ECAR with the 0.1μM exposure (p=0.003) (Figure 5C). Together, these data suggest that all three MeHg exposure paradigms have changes in cellular energetics 3 to 4 days after the exposure has ceased. Importantly, the direction and/or magnitude of these changes are different among the three different MeHg exposure paradigms and neuronal differentiation stages.
Figure 5.

MeHg exposure paradigms differentially alter OCR and ECAR of developing neuroprogenitors. Oxygen consumption rate (OCR) and extracellular acidification rate (ECAR) were measured using the MitoStress test. A.) Basal, leak, and max OCR, and basal ECAR were measured 96 hours (D14) after the E exposure (n=8–16 across groups). A two-way permutation test detected a significant effect of MeHg exposure on basal ECAR (p < 0.000). A Dunn post-hoc test with Benjamini-Yekutieli correction for multiple comparisons revealed a significant reduction in basal ECAR at 0.1μM (*** p< 0.0000) and 1μM (** p < 0.001). B.) Basal, leak, and max OCR, and basal ECAR were measured 72 hours (D23) after the L exposure (n=8–16 across groups). A two-way permutation test detected a significant effect of MeHg exposure on basal OCR (p < 0.000), leak OCR (p<0.000), max OCR (p<0.000), and basal ECAR (p<0.04). A Dunn post-hoc test with Benjamini-Yekutieli correction for multiple comparisons revealed a significant reduction in basal ECAR at 1μM (*** p < 0.0000), a significant increase in max OCR at 0.1μM (* p = 0.014), and a significant decrease in max OCR at 1μM (** p = 0.002). C.) Basal, leak, and max OCR, and basal ECAR were measured 72 hours (D23) after the E+L exposure (n=8–16 across groups). A two-way permutation test detected a significant effect of MeHg exposure on basal ECAR (p < 0.000). A Dunn post-hoc test with Benjamini-Yekutieli correction for multiple comparisons revealed a significant increase in basal ECAR at 0.1μM (* p =0.003). For all plots, cell line (CC1, CC3, and CC5) group means are overlaid on individual well values.
3.6. Effects of MeHg Exposures on mRNA Expression of Stage-specific Markers.
MeHg has previously been shown to alter the differentiation of neural progenitor cells, embryonic stem cells, and neural cell lines (Edoff et al., 2017; He et al., 2012; Jebbett et al., 2013; Moors et al., 2009; Popova et al., 2017; Stummann et al., 2009; Tamm et al., 2006; Zimmer et al., 2011). Therefore, we examined the expression of various markers of radial glial cells and intermediate progenitor cells at D11, 24 hours after the E exposure (Figure 6). Expression of markers of radial glial cells, intermediate progenitor cells, and postmitotic neurons were also examined at D21 (Figure 7). A significant increase in CCND1 expression, a marker of radial glial cells, which was seen with the 1.0μM exposure (Figure 6C., p=0.004). No significant changes were seen for any other lineage marker examined. At D21, in contrast to D11, CCND1 expression was decreased with the 1.0μM exposure (Figure 7C., p=0.04). FOXG1, a marker of dorsal forebrain that is first expressed early in cortical development (radial glia stage), was significantly increased with the 1.0μM E+L exposure (Figure 7B, p<0.0001). With the 1.0μM E+L exposure, expression of the cortical layer 1 and deep layer GLUergic neuronal marker TBR1 (Figures 7G., p=0.0005) and the neuronal marker DCX (Figure 7H., p=0.048) were significantly reduced. Expression of MAP2, another neuronal marker was also reduced, albeit not significantly (Figure 7I., p=0.08).
Figure 6.

MeHg exposure increases mRNA expression of the radial glial and intermediate progenitor marker CCND1. Marker expression was assessed with qPCR at D11, 24 hours after the E exposure ended for the following markers: A.) PAX6, B.) FOXG1, C.) CCND1, one-way ANOVA with Tukey’s multiple comparisons tests revealed a significant effect of MeHg exposure versus the vehicle control, F (2,19) = 7.491, p= 0.0040; *p=0.0043. D.) TBR2, E.) NEUROD4, and F.) NEUROG1. All values are expressed as mean ± SD (n=6–8) fold-change relative to the vehicle control levels for each replicate. Vehicle levels are thus defined as 1.0, shown as the dotted line at 1.0.
Figure 7.

MeHg exposure alters mRNA expression of a subset of intermediate progenitor cell and neuronal markers. Marker expression was assessed with qPCR at D21 for the following markers: A.) PAX6, B.) FOXG1, two-way ANOVA with Tukey’s multiple comparisons showed a significant effect of MeHg and exposure paradigm versus vehicle controls, Finteraction (4, 39) = 2.578, p=0.0523; Fexposure paradigm (2, 39) = 7.140, p=0.0023; FMeHg (2, 39) = 7.096, p=0.0024; ****p<0.0001, C.) CCND1, Two-way ANOVA with Tukey’s multiple comparisons showed a significant effect of MeHg versus vehicle controls: Finteraction (4, 39) = 1.167, p=0.3401; Fexposure paradigm (2, 39) = 2.356, p=0.1082; FMeHg (2, 39) = 5.993, p=0.0054; *p=0.042, D.) TBR2, E.) NEUROD4, F.) NEUROG1, G.) TBR1, two-way ANOVA with Tukey’s multiple comparisons showed a significant interaction between MeHg and exposure paradigm versus vehicle controls, Finteraction (4, 39) = 4.558, p=0.0041; Fexposure paradigm (2, 39) = 2.738, p=0.0771; FMeHg (2, 39) = 3.212, p=0.0511; ***p=0.0005 H.) DCX, *p=0.0481, two-way ANOVA with Tukey’s multiple comparisons for MeHg versus vehicle controls and I.) MAP2. All values are expressed as mean ± SD (n=3–8) fold-change relative to the vehicle control levels for each replicate. Vehicle levels are thus defined as 1.0, shown as the dotted line at 1.0.
3.7. Effects of MeHg Exposures on the Percentage of Cells Expressing Stage-specific Markers
To further examine the effects of MeHg on differentiation, we stained for various markers with immunofluorescence and quantified the percentage of cells expressing these markers at D12 and D22 of differentiation. No significant changes were seen with any marker at D12 (Figure 8). At D22, no significant changes in percentage of cells expressing either PAX6 or FOXG1 were seen (Figure 9 A-D and Figure 9 E-H). However, the percentage of cells expressing the neuronal marker MAP2 was significantly decreased with the 1.0μM E+L exposure (Figure 9 I-L, p=0.004). Additional images of replicates of the MAP2 immunofluorescence can be seen in Supplementary Figure 3. Thus, our MeHg neurodevelopmental exposure model using a dorsal forebrain cortical GLUergic differentiation is associated with significant changes in the levels of neuronal markers and specific GLUergic lineage markers, coupled with changes in measures of cellular energetics, but without significant effects on cell viability or glutathione homeostasis detected. Further, these toxicological effects are anchored with specific cellular MeHg dose measurements that can be compared to real human exposure levels.
Figure 8.
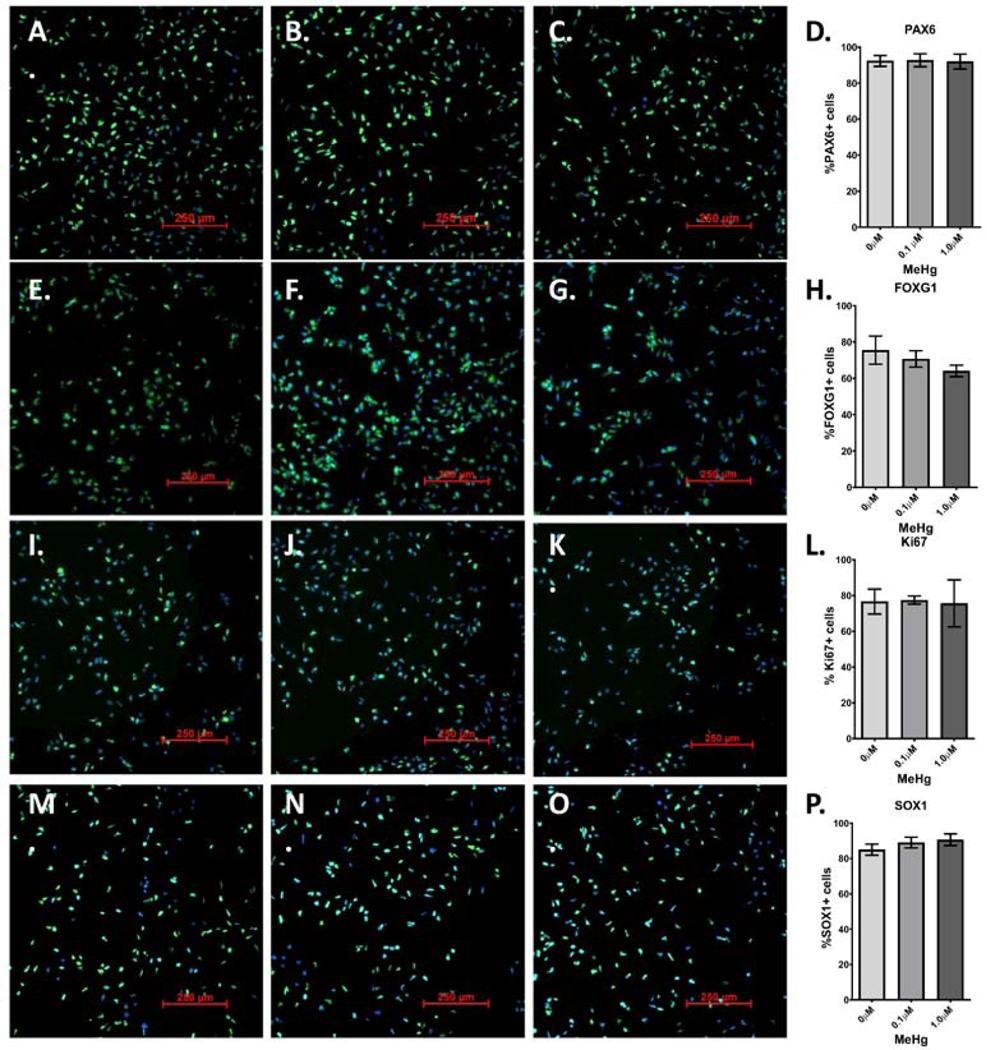
MeHg “E” exposure does not affect the percentage of cells expressing radial glial and intermediate progenitor cell markers. 48 hours after “E” exposure to 0μM (A., E., I, M.), 0.1μM (B., F., J., N.) or 1.0μM (C, G. K., D., O.), cells were immunostained with antibodies for: A-C.) PAX6, E-G.), FOXG1, I-K.) Ki67, and M-D.) SOX1. Percentage of cells expressing each marker-D.) PAX6, H.), FOXG1, L.) Ki67, and P.) SOX1 -was quantified. One-way ANOVA with Tukey’s multiple comparisons revealed no significant differences. All values are expressed as mean ± SD (n=3)
Figure 9.
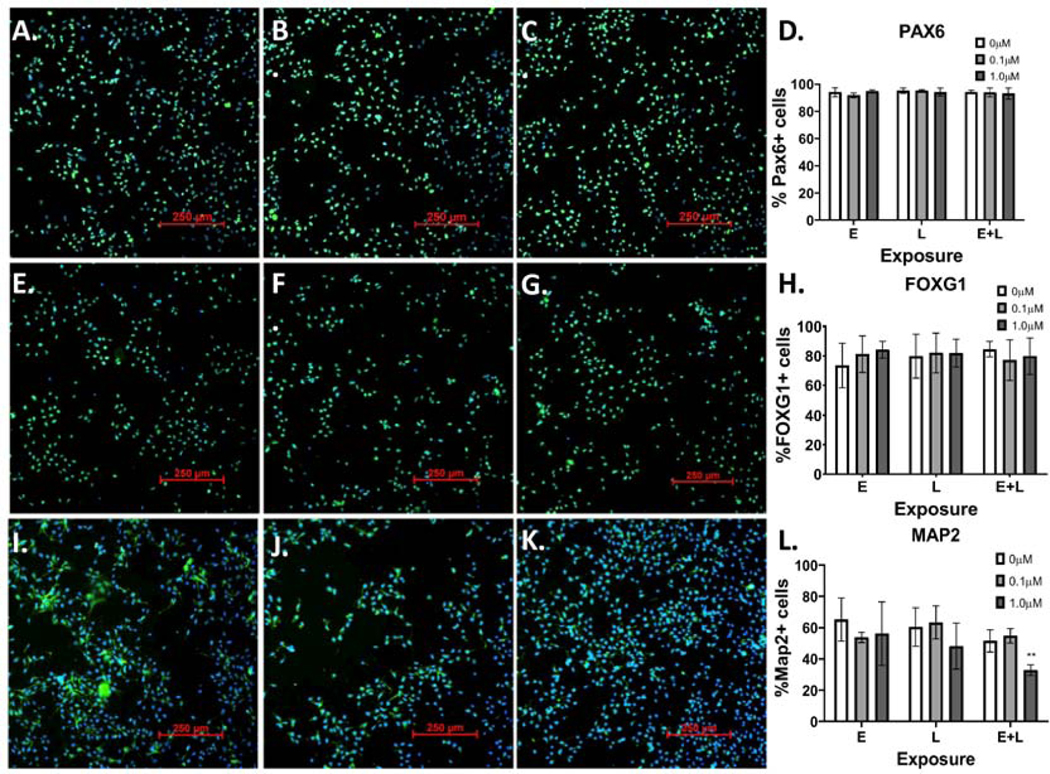
MeHg “E+L” exposure reduces the percentage of cells expressing MAP2. 48 hours after “E+L” exposure to 0μM (A., E., I.), 0.1μM (B., F., J.) or 1.0μM (C, G. K.), cells were immunostained with antibodies for: A-C.) PAX6, E-G.), FOXG1, I-K.) MAP2. Percentage of cells expressing each marker- D.) PAX6, H.) FOXG1, L.) Map2; two-way ANOVA with Tukey’s multiple comparisons revealed a significant effect of MeHg exposure: Finteraction (4, 12) = 2.929, p=0.0665; Fexposure paradigm (2, 6) = 1.301 p=0.3395; FMeHg (2, 12) = 10.91, p=0.002; *p=0.0116- was quantified for all exposure groups. All values are expressed as mean ± SD (n=3).
4. Discussion
Here, we aimed to establish a human-induced pluripotent stem cell model of early neurodevelopmental MeHg toxicity. Both human autopsy studies and rodent in vivo studies have shown that MeHg toxicity primarily targets the cerebral and cerebellar cortices, with GLUergic granule cells in the cerebellum being disrupted, yet GABAergic Purkinje cells remaining largely unaffected (Choi et al., 1978; Harada, 1995; Hunter & Russell, 1954; Matsumoto et al., 1965; Miyamoto et al., 2001; Sager et al., 1984). In autopsy studies, abnormal architecture, indicative of a disruption of neuronal migration, as well as neuron hypoplasia, and degeneration of neurons along with astrocytosis has been described (Choi et al., 1978; Harada, 1995; Matsumoto et al., 1965). A rodent model of developmental MeHg toxicity suggested that neuronal loss may be due to mitotic arrest (Sager et al., 1984). Therefore, to further understand the preferential targeting of GLUergic neurons and the mechanisms behind this neuronal loss, we focused our studies on cerebral GLUergic neuron development and differentiation.
Subtle changes in neuronal differentiation markers were seen with the E + L exposure at D22. Specifically, an increase in FOXG1 mRNA expression, with a corresponding decrease in the expression of the specific post-mitotic neuronal markers DCX and TBR1 was seen. In addition, we saw a trending decrease in MAP2 mRNA and a significant decrease in the number of cells expressing MAP2. Further, we did not see changes in the number of cells expressing FOXG1 with immunofluorescence. This could indicate that the number of cells expressing FOXG1 at detectable levels is unchanged by MeHg. The relative abundance of positive cell types with higher expression of FOXG1 (e.g. radial glia and early neurons) versus positive cell types with lower expression levels (e.g. intermediate progenitor cells) may instead be the driver for the differences in total FOXG1 mRNA detected. Changes in fluorescent intensity by immunocytochemistry may not be sensitive enough to detect small differences in total FOXG1 protein expression. Nonetheless, collectively the changes in gene expression level and immunocytochemical cell marker quantification for these various neuronal lineage markers suggest that MeHg is partially stalling or inhibiting differentiation. This effect may also contribute to the abnormal architecture or neuron hypoplasia seen in human autopsies and in animal models. Interestingly, exposure of human embryonic stem cells to 0.8μM MeHg from D0-D6 of differentiation, specifically reduced FOXG1 expression, while not affecting the expression of PAX6 or SOX1 (Balmer et al., 2012), suggesting differentiation-stage specific effects of MeHg on gene expression. However, at this time it is unclear how changes in FOXG1 gene expression may alter differentiation later in development, and more in-depth studies are necessary to address this point. Future studies are also necessary to understand stage-specific effects of exposure. Interestingly, we observed significant effect on differentiation markers only for the E+L exposure paradigm, even though this exposure paradigm resulted in an equivalent mercury accumulation as the L exposure paradigm at D21 and the E exposure paradigm at D11. In contrast, L exposure led to reduced basal and max OCR, whereas E+L exposure had no effects on OCR. This suggests that the timing of MeHg exposure during differentiation plays an important role in the cellular outcome.
Interestingly, we failed to detect significant effects on typically studied endpoints of acute MeHg toxicity, including cell death, cell replication, or GSH levels, in any of our exposure paradigms. Thus, despite the subtle but significant changes in cell lineage markers and cellular energetics, our MeHg exposure levels are below the Lowest Observed Effect Concentration (LOEC) for these widely reported cellular toxicity endpoints. The reported effects of MeHg on GSH levels varies between model systems and exposure paradigm, however. Glutathione levels have been shown to be reduced in primary mouse cerebellar astrocytes and neurons exposed to 5μM MeHg for 30 minutes (Kaur et al, 2006) and in cerebral neurons exposed to 5μM MeHg for 50 minutes (Kaur et al., 2007). In mice exposed to MeHg in utero, cerebral GSH levels were also seen to be reduced in pups with cerebral Hg concentrations less than 3ppm (Stringari et al., 2008). However, a 0.3μM MeHg exposure on mouse primary cerebellar granule cells for 4 days had no effects on total GSH or reduced glutathione (GSSG) levels, but decreased glutathione peroxidase (GPx) levels (Farina et al., 2009). Likewise, rat primary astrocytes exposed to 0.1 and 1.0μM MeHg for 6 hours, showed increased GSH levels, while 5 and 10μM exposures decreased the levels of both GSH and GSSG (Wang, Jiang, Yin, Aschner, & Cai, 2009). The absence of a change in GSH in our exposure models suggests that alterations of GSH and the redox status by MeHg may only occur above a certain threshold level that perhaps is just below or near levels that cause overt cytotoxicity. Additionally, cellular homeostatic processes may be able to maintain GSH levels with chronic and sub-chronic exposures, as we utilized here, that are nonetheless associated with neurodevelopmental neurotoxicity.
The ability to model chronic and sub-chronic exposures in vitro is an important consideration, as many groups have been calling for a greater emphasis on in vitro developmental neurotoxicology (DNT) testing, with standardized tests to examine endpoints such as proliferation, apoptosis, neuron differentiation, neurite outgrowth, and network formation (Aschner et al., 2017; Sachana et al., 2019). Chronic, low dose exposures have previously been modeled in mouse and human embryonic stem cells. These studies have shown that 6- to 27-day exposures with nanomolar concentrations of MeHg reduces expression of key neuronal markers such as MAP2, β3tubulin, and synapsin (He et al., 2012; Stummann et al., 2009; Tamm et al., 2006; Zimmer et al., 2011), similar to the results reported in this manuscript. However, hiPSCs are an attractive, translational model for MeHg toxicity due to their versatility in generating various lineages of neurons, their ability to model human neuronal development while remaining a relatively high-throughput model. This model also allows for testing of distinct developmental timepoints, which can aid in the understanding of which stage(s) of development are most sensitive to MeHg exposure. Furthermore, without confounding factors, such as unknown exposure timeline and multiple exposures in epidemiological studies, the use of the hiPSC model will allow for a clearer understanding of the molecular mechanisms and genetic and environmental modifying factors that may play pivotal roles in the human susceptibility to MeHg (L. M. Prince, M. Aschner, & A. B. Bowman, 2019). Potential differences between human and rodent cultures should also be considered in DNT testing. For instance, studies have shown that primary rodent neuronal cultures may be less sensitive than hiPSC-derived neuronal cultures (Tukker et al., 2020) and may also have opposing effects (Tukker et al., 2020).
Another important difference between MeHg exposures in cell lines and primary cultures is the density of the cultures themselves. For instance a hiPSC cortical culture at D11, can range from approximately 7 to 11 million cells (7.5 × 10⁵ to 1.1×10⁶ cells/cm2) and at D21 from 8 to 22 million (8.3 × 10⁵ to 2.3 × 10⁶ cells/cm2 (Figure 1A-B), which are similar to three-dimensional cultures, as they do not grow as a monolayer. Additionally, these cultures contain several different cell types, and thus are arguably more similar to a tissue or organ than monolayer cell lines. In contrast, many in vitro studies report exposing their cultures when the cells reach 70–90% confluency (Heggland, Kaur, & Syversen, 2009; Jebbett et al., 2013; Tiernan et al., 2015). As it has been shown that the accumulation of a toxicant depends on the mole toxicant/cell ratio (Meacham et al., 2003), it is important to consider both cellular density, medium volume and exposure level when interpreting results. Here, we saw average Hg concentrations of 10.413.4ng Hg/mg protein in 0.1μM exposures and 94.9–120.9ng Hg/mg protein in 1.0μM exposures, which are comparable to whole brain levels of 1.04–1.34μg/g (ppm) and 9.49–12.1μg/g (ppm) respectively, considering that the brain has been shown to contain 100mg protein/g of wet weight (Banayschwartz, Kenessey, Deguzman, Lajtha, & Palkovits, 1992). These levels have been described as low and moderatehigh brain doses, which correlate with neurodevelopmental effects such as delayed psychomotor development and mental deficiency, respectively (Burbacher, Rodier, & Weiss, 1990). Additionally, the 0.1μM exposure reflects brain levels within the range of the lowest observed adverse effect level for clinical outcomes (0.3–1ppm) and the 1.0μM exposure is in line with brain concentrations seen in Iraq (up to 13.7ppm) (Aschner, 2012; Burbacher et al., 1990; Choi et al., 1978).
Although the effects of our exposure paradigms appear to be subtle, understanding how these slight changes in differentiation may alter not only cellular composition, but also neuronal function, as the neurons mature is necessary for understanding the full effect of these development exposures. Human neurodevelopment occurs over a time period far more prolonged than our E and E+L exposure paradigms in this in vitro human cortical neurodevelopmental model (which at most had 12 days of total exposure). Thus, more protracted exposure periods in actual in vivo developing human cortex might be expected to lead to more substantial impacts on neurodevelopment at the same total internal dose. Nevertheless, many studies, in both animal models and animals, have shown that the effects of MeHg can be latent. For example, mice exposed to MeHg in utero appeared to be normal upon birth through weaning but began to show overt signs of neurological impairment such as ataxia and tremor at 6 months to 1 year of age (Spyker, 1975). Monkeys exposed to MeHg early in life also showed no signs of toxicity until 6 to 9 years later, when somatosensory function and fine motor skills became impaired (Rice, 1989, 1996). Humans exposed to MeHg have been known to experience symptoms with a delay of weeks or even years (referred to as the latent phase) after the exposure occurred (Amin-Zaki et al., 1979; Bakir et al., 1973; Weiss et al., 2002). Additionally, exposure to MeHg earlier in life has been shown to increase the aging process, as seen by increased tremor and significant impairments in hearing and fine motor skills (Kinjo et al., 1993; Yorifuji et al., 2018). Currently, the mechanism(s) underlying these latent effects are unknown. Therefore, future studies will focus on the persistent and latent effects of MeHg on neuronal developmental trajectory, synaptogenesis, cellular function, transcriptomics and metabolomics. Finally, our novel work has established a human based neurodevelopmental exposure model near the threshold of functional neurotoxicity, being at or below the No Observed Adverse Effect Concentration (NOAEC) for cytotoxicity and cellular GSH levels, but at or just above the LOEC for cellular energetics and markers of neuronal differentiation. Further these NOAEC and LOEC values can be directly compared to internal dose measures from human exposures. Thus, providing a cellular mechanistic model for immediate, latent and persistent neurotoxicity of MeHg in a human cellular system.
Supplementary Material
Supplementary Figure 1. Actin Cq values at D21 of differentiation for 0, 0.1, and 1.0μM E, L, and E+L exposure paradigms. All values are expressed as mean ± SD (n=3–8)
Supplementary Figure 2. Hg levels measure in 0μM controls. A.) Total Hg levels in ng of Hg. B.) Total ng of Hg normalized to mg of protein. All values are expressed as mean ± SD (n=5–8)
Supplementary Figure 3. The 1.0μM E+L exposure reduces MAP2 staining at D22. Three biological replicates are shown for A, C, E.) 0μM and B, D, E.) 1.0μM RG + IPC exposure. Scale bar is 100μM.
Supplementary Table 1. Table of all Biorad Assays used, including primer name, assay ID, and fluorophore associated with each assay.
Highlights.
Human-induced pluripotent stem model of early developmental MeHg neurotoxicity
Developmental MeHg causes changes in neuronal differentiation and energetics
No Observed Adverse Effect Concentration (NOAEC) for MeHg cytotoxicity and GSH levels
Neuron hypoplasia by MeHg may be due to inhibition of neuronal differentiation
5. Acknowledgements
We thank Bingying Han for technical assistance with the human stem cell modeling. The Seahorse experiments were performed in the Vanderbilt High-Throughput Screening (HTS) Core Facility that receives support from the Vanderbilt Institute of Chemical Biology and the Vanderbilt Ingram Cancer Center (P30 CA68485). The Agilent Seahorse Extracellular Flux Analyzer is housed and managed within the Vanderbilt High-Throughput Screening Core Facility, an institutionally supported core, and was funded by NIH Shared Instrumentation Grant 1S10OD018015. Further financial support for provided by NIH/NIEHS R01 ES07331 to MA and ABB.
Footnotes
Declaration of interests
The authors declare that they have no known competing financial interests or personal relationships that could have appeared to influence the work reported in this paper.
Publisher's Disclaimer: This is a PDF file of an unedited manuscript that has been accepted for publication. As a service to our customers we are providing this early version of the manuscript. The manuscript will undergo copyediting, typesetting, and review of the resulting proof before it is published in its final form. Please note that during the production process errors may be discovered which could affect the content, and all legal disclaimers that apply to the journal pertain.
8. References
- Amin-Zaki L, Majeed MA, Elhassani SB, Clarkson TW, Greenwood MR, & Doherty RA (1979). Prenatal methylmercury poisoning. Clinical observations over five years. Am J Dis Child, 133(2), 172–177. [PubMed] [Google Scholar]
- Aschner M. (2012). Considerations on methylmercury (MeHg) treatments in in vitro studies. Neurotoxicology, 33(3), 512–513. doi: 10.1016/j.neuro.2012.05.002 [DOI] [PMC free article] [PubMed] [Google Scholar]
- Aschner M, Ceccatelli S, Daneshian M, Fritsche E, Hasiwa N, Hartung T, Hogberg HT, Leist M, Li A, Mundi WR, Padilla S, Piersma AH, Bal-Price A, Seiler A, Westerink RH, Zimmer B. and Lein PJ (2017). Reference compounds for alternative test methods to indicate developmental neurotoxicity (DNT) potential of chemicals: example lists and criteria for their selection and use. ALTEX, 34(1), 49–74. doi: 10.14573/altex.1604201 [DOI] [PMC free article] [PubMed] [Google Scholar]
- Aschner M, Du YL, Gannon M, & Kimelberg HK (1993). Methylmercury-induced alterations in excitatory amino acid transport in rat primary astrocyte cultures. Brain Research, 602(2), 181–186. doi: 10.1016/0006-8993(93)90680-l [DOI] [PubMed] [Google Scholar]
- Aschner M, & Syversen T. (2005). Methylmercury: recent advances in the understanding of its neurotoxicity. Therapeutic Drug Monitoring, 27(3), 278–283. doi: 10.1097/01.ftd.0000160275.85450.32 [DOI] [PMC free article] [PubMed] [Google Scholar]
- Aschner M, Syversen T, Souza DO, Rocha JB, & Farina M. (2007). Involvement of glutamate and reactive oxygen species in methylmercury neurotoxicity. Braz J Med Biol Res, 40(3), 285–291. [DOI] [PubMed] [Google Scholar]
- Bakir F, Damluji SF, Amin-Zaki L, Murtadha M, Khalidi A, al-Rawi NY, Tikriti S, Dahahir HI, Clarkson TW, Smith JC and Doherty RA (1973). Methylmercury poisoning in Iraq. Science, 181(4096), 230–241. doi: 10.1126/science.181.4096.230 [DOI] [PubMed] [Google Scholar]
- Balmer NV, Weng MK, Zimmer B, Ivanova VN, Chambers SM, Nikolaeva E, Jagtap S, Sachinidis A, Hescheler J, Waldmann T. and Leist M. (2012). Epigenetic changes and disturbed neural development in a human embryonic stem cell-based model relating to the fetal valproate syndrome. Human Molecular Genetics, 21(18), 4104–4114. doi: 10.1093/hmg/dds239 [DOI] [PubMed] [Google Scholar]
- Banayschwartz M, Kenessey A, Deguzman T, Lajtha A, & Palkovits M. (1992). Protein-Content of Various Regions of Rat-Brain and Adult and Aging Human Brain. Age, 15(2), 51–54. doi: 10.1007/Bf02435024 [DOI] [Google Scholar]
- Barcelos GR, Grotto D, de Marco KC, Valentini J, Lengert Av, de Oliveira AA, Garcia SC, Braga, Schlawicke Engstrom K, Colus IM, Broberg K. and Barbosa F Jr. (2013). Polymorphisms in glutathione-related genes modify mercury concentrations and antioxidant status in subjects environmentally exposed to methylmercury. Sci Total Environ, 463-464, 319–325. doi: 10.1016/j.scitotenv.2013.06.029 [DOI] [PubMed] [Google Scholar]
- Breier JM, Radio NM, Mundy WR, &Shafer TJ (2008). Development of a high-throughput screening assay for chemical effects on proliferation and viability of immortalized human neural progenitor cells. Toxicological Sciences, 105(1), 119–133. doi: 10.1093/toxsci/kfn115 [DOI] [PubMed] [Google Scholar]
- Brown JA, Codreanu SG, Shi M, Sherrod SD, Markov DA, Neely MD, Britt CM, Hoilett OS, Reiserer RS, Samson PC, McCawley LJ, Webb DJ, Bowman AB, McLean JA and Wikswo JP (2016). Metabolic consequences of inflammatory disruption of the blood-brain barrier in an organ-on-chip model of the human neurovascular unit. J Neuroinflammation, 13(1), 306. doi: 10.1186/s12974-016-0760-y [DOI] [PMC free article] [PubMed] [Google Scholar]
- Burbacher TM, Rodier PM, & Weiss B. (1990). Methylmercury developmental neurotoxicity: a comparison of effects in humans and animals. Neurotoxicology and Teratology, 12(3), 191–202. doi: 10.1016/0892-0362(90)90091-p [DOI] [PubMed] [Google Scholar]
- Burke K, Cheng Y, Li B, Petrov A, Joshi P, Berman RF, Reuhl KR and DiCicco-Bloom E. (2006). Methylmercury elicits rapid inhibition of cell proliferation in the developing brain and decreases cell cycle regulator, cyclin E. Neurotoxicology, 27(6), 970–981. doi: 10.1016/j.neuro.2006.09.001 [DOI] [PMC free article] [PubMed] [Google Scholar]
- Caito SW, & Aschner M. (2015). Mitochondrial Redox Dysfunction and Environmental Exposures. Antioxid Redox Signal, 23(6), 578–595. doi: 10.1089/ars.2015.6289 [DOI] [PMC free article] [PubMed] [Google Scholar]
- Castoldi AF, Coccini T, Ceccatelli S, & Manzo L. (2001). Neurotoxicity and molecular effects of methylmercury. Brain Res Bull, 55(2), 197–203. doi: 10.1016/s0361-9230(01)00458-0 [DOI] [PubMed] [Google Scholar]
- Chambers SM, Fasano CA, Papapetrou EP, Tomishima M, Sadelain M, & Studer L. (2009). Highly efficient neural conversion of human ES and iPS cells by dual inhibition of SMAD signaling. Nat Biotechnol, 27(3), 275–280. doi: 10.1038/nbt.1529 [DOI] [PMC free article] [PubMed] [Google Scholar]
- Choi BH, Lapham LW, Aminzaki L, & Saleem T. (1978). Abnormal Neuronal Migration, Deranged Cerebral Cortical Organization, and Diffuse White Matter Astrocytosis of Human Fetal Brain - Major Effect of Methylmercury Poisoning Inutero. Journal of Neuropathology and Experimental Neurology, 37(6), 719–733. doi: 10.1097/00005072-197811000-00001 [DOI] [PubMed] [Google Scholar]
- Choi DW (1988). Glutamate neurotoxicity and diseases of the nervous system. Neuron, 1(8), 623–634. doi: 10.1016/0896-6273(88)90162-6 [DOI] [PubMed] [Google Scholar]
- Choi DW, Maulucci-Gedde M, & Kriegstein AR (1987). Glutamate neurotoxicity in cortical cell culture. J Neurosci, 7(2), 357–368. doi: 10.1523/JNEUROSCI.07-02-00357.1987 [DOI] [PMC free article] [PubMed] [Google Scholar]
- Clarkson TW, & Magos L. (2006). The toxicology of mercury and its chemical compounds. Crit Rev Toxicol, 36(8), 609–662. doi: 10.1080/10408440600845619 [DOI] [PubMed] [Google Scholar]
- Custodio HM, Broberg K, Wennberg M, Jansson JH, Vessby B, Hallmans G, Stegmayr B. and Skerfving S. (2004). Polymorphisms in glutathione-related genes affect methylmercury retention. Arch Environ Health, 59(11), 588–595. doi: 10.1080/00039890409603438 [DOI] [PubMed] [Google Scholar]
- de Oliveira AA, de Souza MF, Lengert Av, de Oliveira MT, Camargo RB, Braga GU, Colus IM, Barbosa F Jr. and Barcelos GR (2014). Genetic polymorphisms in glutathione (GSH-) related genes affect the plasmatic Hg/whole blood Hg partitioning and the distribution between inorganic and methylmercury levels in plasma collected from a fish-eating population. Biomed Res Int, 2014, 940–952. doi: 10.1155/2014/940952 [DOI] [PMC free article] [PubMed] [Google Scholar]
- Edoff K, Raciti M, Moors M, Sundstrom E, & Ceccatelli S. (2017). Gestational Age and Sex Influence the Susceptibility of Human Neural Progenitor Cells to Low Levels of MeHg. Neurotox Res, 32(4), 683–693. doi: 10.1007/s12640-017-9786-x [DOI] [PMC free article] [PubMed] [Google Scholar]
- Engstrom K, Love TM, Watson GE, Zareba G, Yeates A, Wahlberg K, Alhamdow A, Thurston SW, Mulhern M, McSorley EM, Strain JJ, Davidson PW, Shamlaye CF, Myers GJ, Rand MD, van Wijngaarden E. and Broberg K. (2016). Polymorphisms in ATP-binding cassette transporters associated with maternal methylmercury disposition and infant neurodevelopment in mother-infant pairs in the Seychelles Child Development Study. Environment International, 94, 224–229. doi: 10.1016/j.envint.2016.05.027 [DOI] [PMC free article] [PubMed] [Google Scholar]
- Farina M, Campos F, Vendrell I, Berenguer J, Barzi M, Pons S, & Sunol C. (2009). Probucol increases glutathione peroxidase-1 activity and displays long-lasting protection against methylmercury toxicity in cerebellar granule cells. Toxicological Sciences, 112(2), 416–426. doi: 10.1093/toxsci/kfp219 [DOI] [PubMed] [Google Scholar]
- Farina M, Frizzo MES, Soares FAA, Schwalm FD, Dietrich MO, Zeni G, Rocha JBT and Souza DO (2003). Ebselen protects against methylmercury-induced inhibition of glutamate uptake by cortical slices from adult mice. Toxicology Letters, 144(3), 351–357. doi: 10.1016/S0378-4274(03)00242-X [DOI] [PubMed] [Google Scholar]
- Farina M, Rocha JB, & Aschner M. (2011). Mechanisms of methylmercury-induced neurotoxicity: evidence from experimental studies.Life Sciences, 89(15–16), 555–563. doi: 10.1016/j.lfs.2011.05.019 [DOI] [PMC free article] [PubMed] [Google Scholar]
- Finkbeiner S, & Stevens CF (1988). Applications of quantitative measurements for assessing glutamate neurotoxicity. Proc Natl Acad Sci U S A, 85(11), 4071–4074. doi: 10.1073/pnas.85.11.4071 [DOI] [PMC free article] [PubMed] [Google Scholar]
- Gundacker C, Komarnicki G, Jagiello P, Gencikova A, Dahmen N, Wittmann KJ, & Gencik M. (2007). Glutathione-S-transferase polymorphism, metallothionein expression, and mercury levels among students in Austria. Sci Total Environ, 385(1–3), 37–47. doi: 10.1016/j.scitotenv.2007.07.033 [DOI] [PubMed] [Google Scholar]
- Harada M. (1978). Congenital Minamata disease: intrauterine methylmercury poisoning. Teratology, 18(2), 285–288. doi: 10.1002/tera.1420180216 [DOI] [PubMed] [Google Scholar]
- Harada M. (1995). Minamata disease: methylmercury poisoning in Japan caused by environmental pollution. Crit Rev Toxicol, 25(1), 1–24. doi: 10.3109/10408449509089885 [DOI] [PubMed] [Google Scholar]
- He X, Imanishi S, Sone H, Nagano R, Qin XY, Yoshinaga J, Akanuma H, Yamane J, Fujibuchi W. and Ohsako S. (2012). Effects of methylmercury exposure on neuronal differentiation of mouse and human embryonic stem cells. Toxicology Letters, 212(1), 1–10. doi: 10.1016/j.toxlet.2012.04.011 [DOI] [PubMed] [Google Scholar]
- Heggland I, Kaur P, & Syversen T. (2009). Uptake and efflux of methylmercury in vitro: comparison of transport mechanisms in C6, B35 and RBE4 cells. Toxicol In Vitro, 23(6), 1020–1027. doi: 10.1016/j.tiv.2009.06.018 [DOI] [PubMed] [Google Scholar]
- Hunter D, & Russell DS (1954). Focal cerebellar and cerebellar atrophy in a human subject due to organic mercury compounds. Journal of neurology, neurosurgery, and psychiatry, 17(4), 235–241. doi: 10.1136/jnnp.17.4.235 [DOI] [PMC free article] [PubMed] [Google Scholar]
- Jebbett NJ, Hamilton JW, Rand MD, & Eckenstein F. (2013). Low level methylmercury enhances CNTF-evoked STAT3 signaling and glial differentiation in cultured cortical progenitor cells. Neurotoxicology, 38, 91–100. doi: 10.1016/j.neuro.2013.06.008 [DOI] [PMC free article] [PubMed] [Google Scholar]
- Joshi P, Bodnya C, Ilieva I, Neely MD, Aschner M, & Bowman AB (2019). Huntington’s disease associated resistance to Mn neurotoxicity is neurodevelopmental stage and neuronal lineage dependent. Neurotoxicology, 75, 148–157. doi: 10.1016/j.neuro.2019.09.007 [DOI] [PMC free article] [PubMed] [Google Scholar]
- Juarez BI, Martinez ML, Montante M, Dufour L, Garcia E, & Jimenez-Capdeville ME (2002). Methylmercury increases glutamate extracellular levels in frontal cortex of awake rats. Neurotoxicology and Teratology, 24(6), 767–771. doi 10.1016/S0892-0362(02)00270-2 [DOI] [PubMed] [Google Scholar]
- Julvez J, & Grandjean P. (2013). Genetic susceptibility to methylmercury developmental neurotoxicity matters. Front Genet, 4, 278. doi: 10.3389/fgene.2013.00278 [DOI] [PMC free article] [PubMed] [Google Scholar]
- Kaur P, Aschner M, & Syversen T. (2006). Glutathione modulation influences methyl mercury induced neurotoxicity in primary cell cultures of neurons and astrocytes. Neurotoxicology, 27(4), 492500. doi: 10.1016/j.neuro.2006.01.010 [DOI] [PubMed] [Google Scholar]
- Kaur P, Aschner M, & Syversen T. (2007). Role of glutathione in determining the differential sensitivity between the cortical and cerebellar regions towards mercury-induced oxidative stress. Toxicology, 230(2–3), 164–177. doi: 10.1016/j.tox.2006.11.058 [DOI] [PubMed] [Google Scholar]
- Kim YJ, Kim YS, Kim MS, & Ryu JC (2007). The inhibitory mechanism of methylmercury on differentiation of human neuroblastoma cells. Toxicology, 234(1–2), 1–9. doi: 10.1016/j.tox.2007.01.003 [DOI] [PubMed] [Google Scholar]
- Kinjo Y, Higashi H, Nakano A, Sakamoto M, & Sakai R. (1993). Profile of subjective complaints and activities of daily living among current patients with Minamata disease after 3 decades. Environ Res, 63(2), 241–251. doi: 10.1006/enrs.1993.1144 [DOI] [PubMed] [Google Scholar]
- Livak KJ, & Schmittgen TD (2001). Analysis of Relative Gene Expression Data Using Real-Time Quantitative PCR and the 2−ΔΔCT Method. Methods, 25(4), 402–408. doi: 10.1006/meth.2001.1262 [DOI] [PubMed] [Google Scholar]
- Llop S, Engstrom K, Ballester F, Franforte E, Alhamdow A, Pisa F, Tratnik JS, Mazej D, Murcia M, Rebagliato M, Bustamante M, Sunyer J, Sofianou-Katsoulis A, Prasouli A, Antonopoulou E, Antoniadou I, Nakou S, Barbone F, Horvat M. and Broberg K. (2014). Polymorphisms in ABC transporter genes and concentrations of mercury in newborns--evidence from two Mediterranean birth cohorts. Plos One, 9(5), e97172. doi: 10.1371/journal.pone.0097172 [DOI] [PMC free article] [PubMed] [Google Scholar]
- Llop S, Tran V, Ballester F, Barbone F, Sofianou-Katsoulis A, Sunyer J, Engstrom K, Alhamdow A, Love TM, Watson GE, Bustamante M, Murcia M, Iniguez C, Shamlaye CF, Rosolen V, Mariuz M, Horvat M, Tratnik JS, Mazej D, van Wijngaarden E, Davidson PW, Myers GJ, Rand MD and Broberg K. (2017). CYP3A genes and the association between prenatal methylmercury exposure and neurodevelopment. Environment International, 105, 34–42. doi: 10.1016/j.envint.2017.04.013 [DOI] [PMC free article] [PubMed] [Google Scholar]
- Mahaffey KR (2004). Fish and shellfish as dietary sources of methylmercury and the omega-3 fatty acids, eicosahexaenoic acid and docosahexaenoic acid: risks and benefits. Environ Res, 95(3), 414–428. doi: 10.1016/j.envres.2004.02.006 [DOI] [PubMed] [Google Scholar]
- Mahaffey KR, Sunderland EM, Chan HM, Choi AL, Grandjean P, Marien K, Oken E, Sakamoto M, Schoeny R, Weihe P, Yan CH and Yasutake A. (2011). Balancing the benefits of n-3 polyunsaturated fatty acids and the risks of methylmercury exposure from fish consumption. Nutr Rev, 69(9), 493–508. doi: 10.1111/j.1753-4887.2011.00415.x [DOI] [PMC free article] [PubMed] [Google Scholar]
- Manfroi CB, Schwalm FD, Cereser V, Abreu F, Oliveira A, Bizarro L, Rocha JB, Frizzo ME, Souza DO and Farina M. (2004). Maternal milk as methylmercury source for suckling mice: neurotoxic effects involved with the cerebellar glutamatergic system. Toxicological Sciences, 81(1), 172–178. doi: 10.1093/toxsci/kfh201 [DOI] [PubMed] [Google Scholar]
- Marsh DO, Myers GJ, Clarkson TW, Amin-Zaki L, Tikriti S, Majeed MA, & Dabbagh AR (1981). Dose-response relationship for human fetal exposure to methylmercury. Clin Toxicol, 18(11), 1311–1318. doi: 10.3109/00099308109035071 [DOI] [PubMed] [Google Scholar]
- Matsumoto H, Koya G, & Takeuchi T. (1965). Fetal Minamata disease. A neuropathological study of two cases of intrauterine intoxication by a methyl mercury compound. J Neuropathol Exp Neurol, 24(4), 563–574. [PubMed] [Google Scholar]
- Meacham CA, Freudenrich TM, Anderson WL, Sui L, Barone S, Gilbert ME, Mundy WR and Shafer TJ (2003). Accumulation of the persistent environmental toxicants methylmercury or polychlorinated biphenyls in in vitro models of rat neuronal tissue. Toxicological Sciences, 72, 265–266. doi: 10.1016/j.taap.2004.08.024 [DOI] [PubMed] [Google Scholar]
- Miyamoto K, Nakanishi H, Moriguchi S, Fukuyama N, Eto K, Wakamiya J, Murao K, Arimura K. and Osame M. (2001). Involvement of enhanced sensitivity of N-methyl-D-aspartate receptors in vulnerability of developing cortical neurons to methylmercury neurotoxicity. Brain Research, 901(1–2), 252–258. doi: 10.1016/s0006-8993(01)02281-8 [DOI] [PubMed] [Google Scholar]
- Moors M, Rockel TD, Abel J, Cline JE, Gassmann K, Schreiber T, Schuwald J, Weinmann N. and Fritsche E. (2009). Human neurospheres as three-dimensional cellular systems for developmental neurotoxicity testing. Environ Health Perspect, 117(7), 1131–1138. doi: 10.1289/ehp.0800207 [DOI] [PMC free article] [PubMed] [Google Scholar]
- Moretto MB, Funchal C, Santos AQ, Gottfried C, Boff B, Zeni G, Pessoa-Pureur R, Souza DO, Wofchuk S. and Rocha JBT (2005). Ebselen protects glutamate uptake inhibition caused by methyl mercury but does not by Hg2+. Toxicology, 214(1–2), 57–66. doi: 10.1016/j.tox.2005.05.022 [DOI] [PubMed] [Google Scholar]
- Myers GJ, Davidson PW, Cox C, Shamlaye C, Cernichiari E, & Clarkson TW (2000). Twenty-seven years studying the human neurotoxicity of methylmercury exposure. Environ Res, 83(3), 275–285. doi: 10.1006/enrs.2000.4065 [DOI] [PubMed] [Google Scholar]
- Neely MD, Litt MJ, Tidball AM, Li GG, Aboud AA, Hopkins CR, Chamberlin R, Hong CC, Ess KC and Bowman AB (2012). DMH1, a Highly Selective Small Molecule BMP Inhibitor Promotes Neurogenesis of hiPSCs: Comparison of PAX6 and SOX1 Expression during Neural Induction. Acs Chemical Neuroscience, 3(6), 482–491. doi: 10.1021/cn300029t [DOI] [PMC free article] [PubMed] [Google Scholar]
- Neely MD, Tidball AM, Aboud AA, Ess KC, & Bowman AB (2011). Induced Pluripotent Stem Cells (iPSCs): An Emerging Model System for the Study of Human Neurotoxicology. Cell Culture Techniques, 56, 27–61. doi: 10.1007/978-1-61779-077-5_2 [DOI] [Google Scholar]
- Popova D, Karlsson J, & Jacobsson SOP (2017). Comparison of neurons derived from mouse P19, rat PC12 and human SH-SY5Y cells in the assessment of chemical- and toxin-induced neurotoxicity. BMC Pharmacol Toxicol, 18(1), 42. doi: 10.1186/s40360-017-0151-8 [DOI] [PMC free article] [PubMed] [Google Scholar]
- Porciuncula LO, Rocha JB, Tavares RG, Ghisleni G, Reis M, & Souza DO (2003). Methylmercury inhibits glutamate uptake by synaptic vesicles from rat brain. Neuroreport, 14(4), 577–580. doi: 10.1097/00001756-200303240-00010 [DOI] [PubMed] [Google Scholar]
- Prince LM, Aschner M, & Bowman AB (2019). Human-induced pluripotent stems cells as a model to dissect the selective neurotoxicity of methylmercury. Biochim Biophys Acta Gen Subj, 1863(12), 129300. doi: 10.1016/j.bbagen.2019.02.002 [DOI] [PMC free article] [PubMed] [Google Scholar]
- Rice DC (1989). Delayed neurotoxicity in monkeys exposed developmentally to methylmercury. Neurotoxicology, 10(4), 645–650. [PubMed] [Google Scholar]
- Rice DC (1996). Evidence for delayed neurotoxicity produced by methylmercury. Neurotoxicology, 17(3–4), 583–596. [PubMed] [Google Scholar]
- Rothstein JD, Jin L, Dykes-Hoberg M, & Kuncl RW (1993). Chronic inhibition of glutamate uptake produces a model of slow neurotoxicity. Proc Natl Acad Sci U S A, 90(14), 6591–6595. doi: 10.1073/pnas.90.14.6591 [DOI] [PMC free article] [PubMed] [Google Scholar]
- Sachana M, Bal-Price A, Crofton KM, Bennekou SH, Shafer TJ, Behl M, & Terron A. (2019). International Regulatory and Scientific Effort for Improved Developmental Neurotoxicity Testing. Toxicological Sciences, 167(1), 45–57. doi: 10.1093/toxsci/kfy211 [DOI] [PubMed] [Google Scholar]
- Sager PR, Aschner M, & Rodier PM (1984). Persistent, Differential Alterations in Developing Cerebellar Cortex of Male and Female Mice after Methylmercury Exposure. Developmental Brain Research, 12(1), 1–11. doi: 10.1016/0165-3806(84)90170-6 [DOI] [PubMed] [Google Scholar]
- Sakamoto M, Wakabayashi K, Kakita A, Hitoshi T, Adachi T, & Nakano A. (1998). Widespread neuronal degeneration in rats following oral administration of methylmercury during the postnatal developing phase: a model of fetal-type minamata disease. Brain Research, 784(1–2), 351–354. doi: 10.1016/s0006-8993(97)01400-5 [DOI] [PubMed] [Google Scholar]
- Sanfeliu C, Sebastia J, & Ki SU (2001). Methylmercury neurotoxicity in cultures of human neurons, astrocytes, neuroblastoma cells. Neurotoxicology, 22(3), 317–327. doi: 10.1016/s0161813x(01)00015-8 [DOI] [PubMed] [Google Scholar]
- Schlawicke Engstrom K, Stromberg U, Lundh T, Johansson I, Vessby B, Hallmans G, Skerfving S. and Broberg K. (2008). Genetic variation in glutathione-related genes and body burden of methylmercury. Environ Health Perspect, 116(6), 734–739. doi: 10.1289/ehp.10804 [DOI] [PMC free article] [PubMed] [Google Scholar]
- Shanker G, Syversen T, Aschner JL, & Aschner M. (2005). Modulatory effect of glutathione status and antioxidants on methylmercury-induced free radical formation in primary cultures of cerebral astrocytes. Brain Res Mol Brain Res, 137(1–2), 11–22. doi: 10.1016/j.molbrainres.2005.02.006 [DOI] [PubMed] [Google Scholar]
- Spyker JM (1975). Assessing the impact of low level chemicals on development: behavioral and latent effects. Fed Proc, 34(9), 1835–1844. [PubMed] [Google Scholar]
- Stringari J, Nunes AK, Franco JL, Bohrer D, Garcia SC, Dafre AL, Milatovic D, Souza DO, Rocha JB, Aschner M. and Farina M (2008). Prenatal methylmercury exposure hampers glutathione antioxidant system ontogenesis and causes long-lasting oxidative stress in the mouse brain. Toxicol Appl Pharmacol, 227(1), 147–154. doi: 10.1016/j.taap.2007.10.010 [DOI] [PMC free article] [PubMed] [Google Scholar]
- Stummann TC, Hareng L, & Bremer S. (2009). Hazard assessment of methylmercury toxicity to neuronal induction in embryogenesis using human embryonic stem cells. Toxicology, 257(3), 117–126. doi: 10.1016/j.tox.2008.12.018 [DOI] [PubMed] [Google Scholar]
- Tamm C, Duckworth J, Hermanson O, & Ceccatelli S. (2006). High susceptibility of neural stem cells to methylmercury toxicity: effects on cell survival and neuronal differentiation. Journal of Neurochemistry, 97(1), 69–78. doi: 10.1111/j.1471-4159.2006.03718.x [DOI] [PubMed] [Google Scholar]
- Tidball AM, Neely MD, Chamberlin R, Aboud AA, Kumar KK, Han B, Bryan MR, Aschner M, Ess KC and Bowman AB (2016). Genomic Instability Associated with p53 Knockdown in the Generation of Huntington’s Disease Human Induced Pluripotent Stem Cells. Plos One, 11(3), e0150372. doi: 10.1371/journal.pone.0150372 [DOI] [PMC free article] [PubMed] [Google Scholar]
- Tiernan CT, Edwin EA, Hawong HY, Rios-Cabanillas M, Goudreau JL, Atchison WD, & Lookingland KJ (2015). Methylmercury impairs canonical dopamine metabolism in rat undifferentiated pheochromocytoma (PC12) cells by indirect inhibition of aldehyde dehydrogenase. Toxicological Sciences, 144(2), 347–356. doi: 10.1093/toxsci/kfv001 [DOI] [PMC free article] [PubMed] [Google Scholar]
- Tukker AM, Bouwman LMS, van Kleef R, Hendriks HS, Legler J, & Westerink RHS (2020). Perfluorooctane sulfonate (PFOS) and perfluorooctanoate (PFOA) acutely affect human alpha1beta2gamma2L GABAA receptor and spontaneous neuronal network function in vitro. Sci Rep, 10(1), 5311. doi: 10.1038/s41598-020-62152-2 [DOI] [PMC free article] [PubMed] [Google Scholar]
- Tukker AM, Wijnolts FMJ, de Groot A, & Westerink RHS (2020). Applicability of hiPSC-Derived Neuronal Cocultures and Rodent Primary Cortical Cultures for In Vitro Seizure Liability Assessment. Toxicological Sciences, 178(1), 71–87. doi: 10.1093/toxsci/kfaa136 [DOI] [PMC free article] [PubMed] [Google Scholar]
- Vendrell I, Carrascal M, Vilaro MT, Abian J, Rodriguez-Farre E, & Sunol C. (2007). Cell viability and proteomic analysis in cultured neurons exposed to methylmercury. Hum Exp Toxicol, 26(4), 263272. doi: 10.1177/0960327106070455 [DOI] [PubMed] [Google Scholar]
- Wahlberg K, Love TM, Pineda D, Engstrom K, Watson GE, Thurston SW, Yeates AJ, Mulhern MS, McSorley EM, Strain JJ, Smith TH, Davidson PW, Shamlaye CF, Myers GJ, Rand MD, van Wijngaarden E. and Broberg K. (2018). Maternal polymorphisms in glutathione-related genes are associated with maternal mercury concentrations and early child neurodevelopment in a population with a fish-rich diet. Environment International, 115, 142149. doi: 10.1016/j.envint.2018.03.015 [DOI] [PMC free article] [PubMed] [Google Scholar]
- Wang L, Jiang H, Yin Z, Aschner M, & Cai J. (2009). Methylmercury toxicity and Nrf2-dependent detoxification in astrocytes. Toxicological Sciences, 107(1), 135–143. doi: 10.1093/toxsci/kfn201 [DOI] [PMC free article] [PubMed] [Google Scholar]
- Warren EB, Bryan MR, Morcillo P, Hardeman KN, Aschner M, & Bowman AB (2020). Manganese-induced Mitochondrial Dysfunction Is Not Detectable at Exposures Below the Acute Cytotoxic Threshold in Neuronal Cell Types. Toxicological Sciences, 176(2), 446–459. doi: 10.1093/toxsci/kfaa079 [DOI] [PMC free article] [PubMed] [Google Scholar]
- Weiss B, Clarkson TW, & Simon W. (2002). Silent latency periods in methylmercury poisoning and in neurodegenerative disease. Environ Health Perspect, 110 Suppl 5, 851–854. doi: 10.1289/ehp.02110s5851 [DOI] [PMC free article] [PubMed] [Google Scholar]
- Yorifuji T, Takaoka S, & Grandjean P. (2018). Accelerated functional losses in ageing congenital Minamata disease patients. Neurotoxicology and Teratology, 69, 49–53. doi: 10.1016/j.ntt.2018.08.001 [DOI] [PubMed] [Google Scholar]
- Zimmer B, Schildknecht S, Kuegler PB, Tanavde V, Kadereit S, & Leist M. (2011). Sensitivity of dopaminergic neuron differentiation from stem cells to chronic low-dose methylmercury exposure. Toxicological Sciences, 121(2), 357–367. doi: 10.1093/toxsci/kfr054 [DOI] [PubMed] [Google Scholar]
Associated Data
This section collects any data citations, data availability statements, or supplementary materials included in this article.
Supplementary Materials
Supplementary Figure 1. Actin Cq values at D21 of differentiation for 0, 0.1, and 1.0μM E, L, and E+L exposure paradigms. All values are expressed as mean ± SD (n=3–8)
Supplementary Figure 2. Hg levels measure in 0μM controls. A.) Total Hg levels in ng of Hg. B.) Total ng of Hg normalized to mg of protein. All values are expressed as mean ± SD (n=5–8)
Supplementary Figure 3. The 1.0μM E+L exposure reduces MAP2 staining at D22. Three biological replicates are shown for A, C, E.) 0μM and B, D, E.) 1.0μM RG + IPC exposure. Scale bar is 100μM.
Supplementary Table 1. Table of all Biorad Assays used, including primer name, assay ID, and fluorophore associated with each assay.