Abstract
Objective
The aim of the study was to construct and validate a robust prognostic model based on liquid‐liquid phase separation (LLPS)–related genes in lung squamous cell carcinoma (LUSC).
Methods
The Cancer Genome Atlas dataset was used as the discovery set to identify the LLPS‐related differentially expressed genes (DEGs) between LUSC and normal tissue. These DEGs were screened by the LASSO Cox regression analysis to identify the genes with nonzero coefficient, which were next included in the multivariate Cox regression analysis to construct the prediction model. The dataset GSE41271 was adopted as the validation set to verify the efficacy of the model. Enrichment analysis and the CIBERSORT were performed to illustrate potential immune mechanisms underlying the prediction model.
Results
A total of 48 LLPS‐related genes were aberrantly expressed in LUSC. Among them, 7 genes were selected by the LASSO Cox regression analysis to construct the prediction model. Risk index (RI) was calculated according to the model for each patient. The prognosis was significantly different between the patients with high and low RI in the discovery set and the validation set (p < 0.001 and p = 0.028, respectively). The multivariate survival analysis confirmed RI as an independent prognostic factor in LUSC (in the discovery set: p < 0.001, HR = 2.643, 95% CI = 1.986–3.518; in the validation set: p = 0.042, HR = 2.144, 95% CI = 1.026–4.480). A series of pathways involving immune cells were found to be related to RI. The distribution pattern of immune cells and chemokines varied according to the value of RI.
Conclusion
The prediction model based on LLPS‐related genes was constructed and validated as a robust prognostic tool for LUSC using multiple datasets. LLPS might have an impact on LUSC through immune pathways.
Keywords: immune, liquid‐liquid phase separation, lung squamous cell carcinoma, prediction model, prognosis
A prognostic model based on the LLPS‐related genes using LASSO regression and multivariate Cox regression analyses was constructed and validated for LUSC. The risk index (RI) calculated for each patient according to the model was significantly related to patients’ prognosis and caner‐related immune activities.
1. INTRODUCTION
Non–small‐cell lung cancer (NSCLC), one of the most common malignancies worldwide, is characterized by high morbidity and mortality. 1 Lung squamous cell carcinoma (LUSC) is known as a main pathological subtype of NSCLC. 2 , 3 Although molecular targeted therapy has been constantly applied in clinical practice, its effect against LUSC remained limited. 4 , 5 The prognosis of LUSC is still dismal, especially in patients with advanced‐stage disease. 6 Recently, the promising outcome of immune checkpoint inhibitors (ICIs) such as anti‐PD‐1 agents has shed light on the anti‐LUSC strategies. 7 , 8 Its treatment response is mainly predicted by expression level of PD‐L1. 9 , 10 However, only a small group of patients with NSCLC can benefit from ICIs. 11 More predictors for the efficacy of immunotherapy and more profound understanding of the underlying mechanisms become an urgent requirement for clinical practice.
The important roles and comprehensive mechanisms of liquid‐liquid phase separation (LLPS) of proteins and nucleic acids in cellular activities have been continuously uncovered by recent studies. 12 , 13 , 14 Its correlation with the development of some human diseases has been indicated by a growing number of studies and has become a new paradigm in relevant researches. 15 , 16 Emerging evidence also revealed the correlation of LLPS‐related activities with anti‐tumoral immune response, providing a new perspective for understanding tumor immunology. 17 , 18 All these findings indicated the potential impact of LLPS on cancer development by its direct and indirect effects.
The aim of this study was to construct and validate a model based on LLPS‐related genes for predicting the prognosis of LUSC, and to preliminarily uncover the relationship between LLPS‐ and tumor‐related immune activities in LUSC.
2. MATERIALS AND METHODS
2.1. Study cohorts and LLPS‐related genes
The list of LLPS‐related genes was downloaded from PhaSepDB 19 (a database provides a collection of manually curated phase separation proteins and membraneless organelles–related proteins; http://db.phasep.pro/). The gene expression data of LUSC patients were downloaded from The Cancer Genome Atlas (TCGA; https://portal.gdc.cancer.gov/). Among them, 550 cases with sufficient clinical and survival data were enrolled as the discovery set to identify the LLPS‐related differentially expressed genes (DEGs) between LUSC and normal tissue, and to construct the prediction model. Another dataset (GSE41271) obtained from Gene Expression Omnibus (GEO; https://www.ncbi.nlm.nih.gov/geo/) was used to validate the prediction model. The workflow of this study is shown in Figure 1.
FIGURE 1.
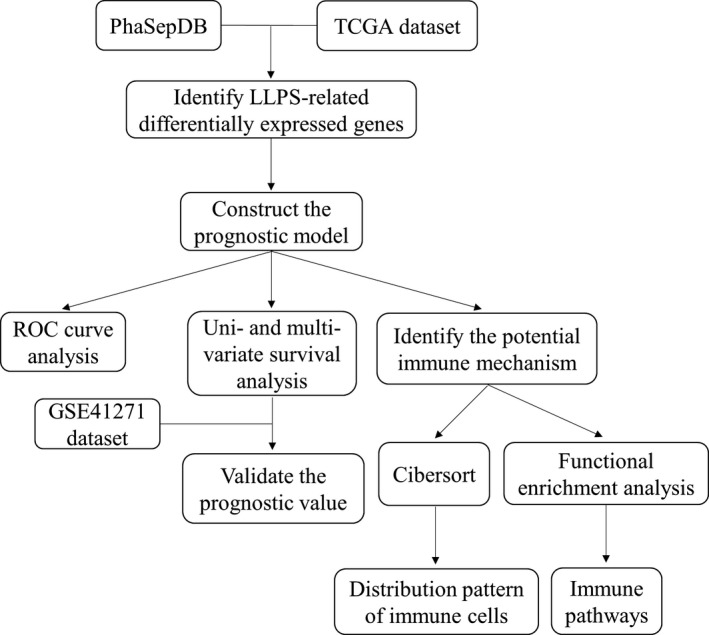
Workflow of the present study
2.2. Construction of a LLPS‐related prediction model
TCGA dataset was adopted to calculate the LLPS‐related DEGs between LUSC and normal tissue using “limma” package in R. The genes with fold changes >1.5 and p value <0.05 were considered to be statistically significant.
All the LLPS‐related DEGs in the discovery set were subjected to least absolute shrinkage and selection operator (LASSO) Cox regression. Then, the genes with nonzero coefficients found in the LASSO Cox analysis by using the “glmnet” package were put into the multivariate Cox regression analysis to construct the prediction model. The model was expressed as:
In the formula, “Exp” represented the expression value of a gene, and “Coef” represented the coefficient of the gene.
2.3. Prognostic value of the prediction model
RI was calculated for each individual in the discovery set according to our prediction model. The prognosis of 2 patient groups divided by the level of RI was compared to illustrate the prognostic value of the model. Then, RI and other clinical characteristics were subjected to the multivariate Cox regression analysis to confirm the independence of RI (cases with missing data for these variables were excluded).
All the aforementioned analyses were additionally performed in the validation set to confirm the efficacy of the model.
2.4. Enrichment analysis and the CIBERSORT method
Enrichment analysis was conducted in order to identify the related biological pathways through the Gene Ontology (GO) database and Kyoto Encyclopedia of Genes and Genomes (KEGG) database by using “clusterProfiler” and “enrichplot” packages in R. The significant cutoff threshold was defined as adjusted p value <0.05 and |NES|>1.5.
The CIBERSORT method, known as a useful tool to convert gene expression profile to relative proportion of different types of immune cells, 20 was performed to assess the distribution of tumor‐infiltrating immune cells (TICs) in LUSC using TCGA data.
2.5. Statistical analysis
All the statistical analysis was performed using R (version 4.1.1) (https://www.r‐project.org). Statistical significance was defined as a two‐sided p value <0.05 for all results in this study, unless otherwise stated.
3. RESULTS
3.1. Construction of the prediction model based on LLPS‐related genes
LLPS‐related genes were derived from PhaSepDB and matched in the discovery set. A total of 43 LLPS‐related genes were identified to be up‐regulated, and 5 of them were down‐regulated in LUSC compared with normal tissues (Figure 2A). Next, all the LLPS‐related DEGs of 493 LUSC patients were included in the LASSO Cox regression model. After the screening, 7 genes remained with nonzero regression coefficient, including HOXA13, SSX1, MAGEA4, DPPA2, PLA2G1B, CALML5, and H2BC9 (Figure 2B,C). These selected genes were used to construct a prognostic model for LUSC patients using multivariate Cox regression analysis (Figure 2D). The formula of the model was expressed as follows: Risk index (RI) = −0.03359×HOXA13+0.11907×SSX1+0.01246×MAGEA4+0.06373×DPPA2+0.09617×PLA2G1B +0.02794×CALML5‐0.13094×H2BC9.
FIGURE 2.
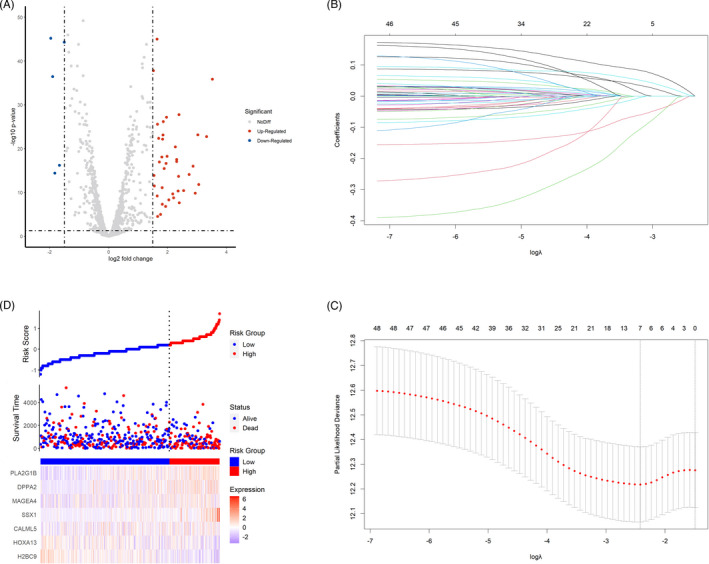
Construction of the prognostic model based on liquid‐liquid phase separation (LLPS)‐related genes. (A) The volcano plot showing the different expression of LLPS‐related genes between lung squamous cell carcinoma (LUSC) and normal lung tissue. (B) The coefficient profiles of the 7 LLPS‐related genes selected by the least absolute shrinkage and selection operator (LASSO) Cox regression analysis. (C) Selection of the optimal parameter in the LASSO Cox regression analysis with 10‐fold cross‐validation. (D) The 7 LLPS‐related genes constituting the prediction model in the discovery set
The area under the curve (AUC) of the model was calculated to reveal its efficacy. The AUC at 1 year, 3 years, and 5 years equaled to 62.76, 64.24, and 65.40, respectively (Figure 3A). The result of the log‐rank test indicated that RI was significantly related to OS in LUSC (p < 0.001). Patients with high RI had a poorer prognosis in comparison with those with low RI (Figure 3B). Additionally, RI and the other clinical characteristics including age, gender, and cancer stage were included in the multivariate Cox analysis. As a result, the prognostic value of RI remained significant (p < 0.001, hazard ratio [HR] = 2.643, 95% confidence interval [CI] = 1.986–3.518; Figure 3C).
FIGURE 3.
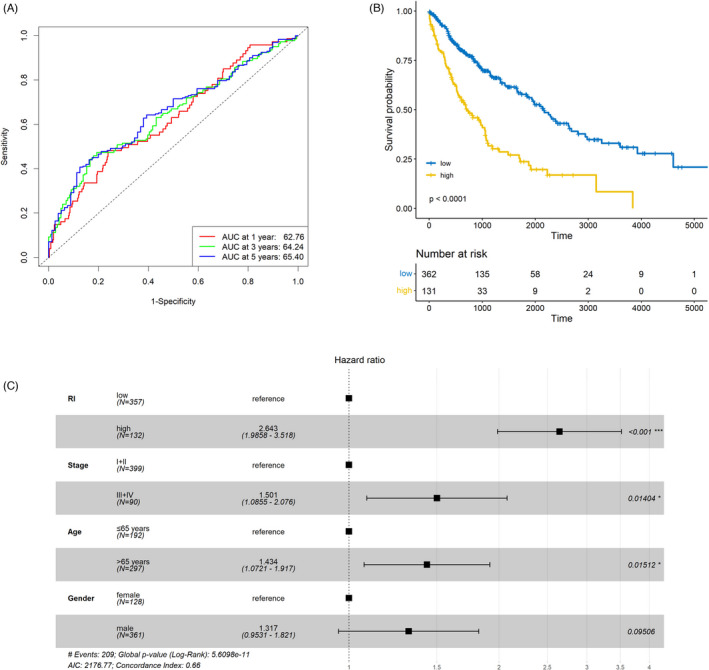
Predictive value of the prognostic model. (A) The area under the curve (AUC) of the prediction model in the discovery set. (B) Significantly different overall survival (OS) between patients with high and low risk index (RI). (C) RI as an independent prognostic factor in lung squamous cell carcinoma (LUSC) in comparison with routine clinical characteristics
3.2. Validation of the prediction model
Patients were divided into two groups according to the level of RI in the validation set. As shown in Figure 4A, high RI was significantly related to shorter OS (p = 0.028). After multivariate analysis, RI remained as an independent predictor for the prognosis of LUSC (p = 0.042, HR = 2.144, 95% CI = 1.026–4.480; Figure 4B).
FIGURE 4.
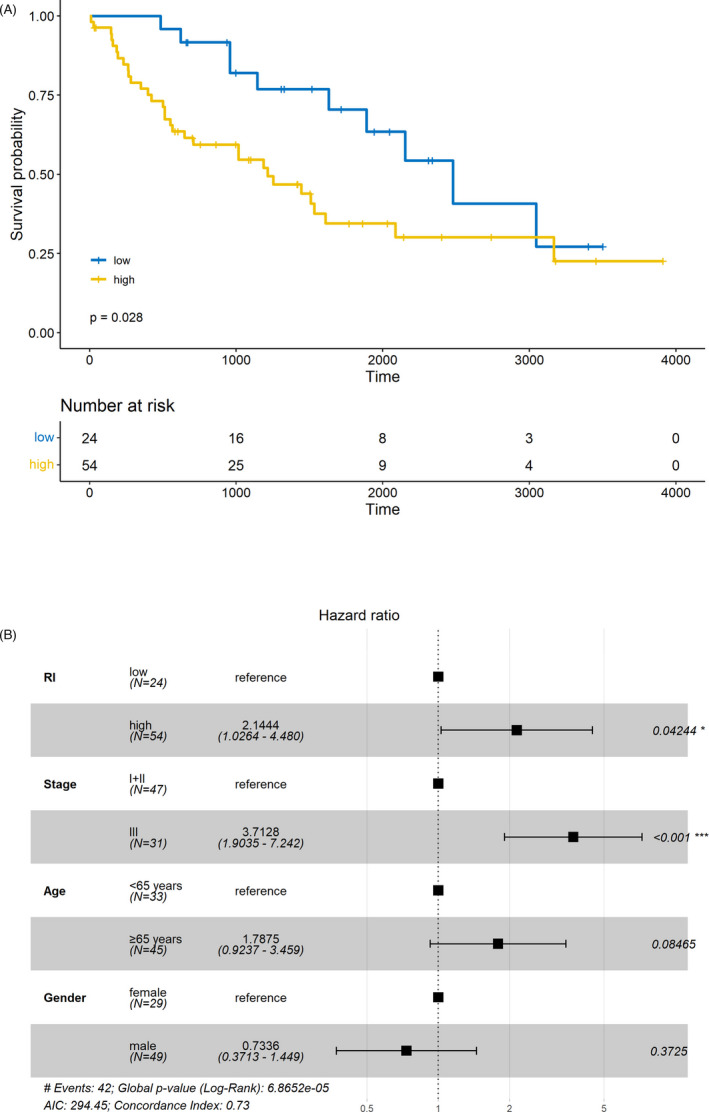
Validation of the liquid‐liquid phase separation (LLPS)‐related prediction model. (A) The worse prognosis of patients with high risk index (RI) compared to those with low RI in the validation set. (B) The independent predictive value of RI in the validation set
3.3. Correlation between LLPS and immune in LUSC
In order to identify the plausible mechanisms to illustrate the prognostic effect of RI, enrichment analysis was performed between patients with low and high RI in TCGA dataset. Interestingly, a series of immune‐related pathways were found to be associated with RI in LUSC, such as “cytokine production” (NES = 1.818, adjusted p = 0.003), “activation of immune response” (NES = 1.704, adjusted p = 0.003), and “leukocyte‐mediated immunity” (NES = 1.781, adjusted p = 0.003) (Figure 5A,B). Next, the distribution pattern of tumor‐infiltrating immune cells was compared according to the level of RI. The results indicated that natural killer cells and CD8+ T cells were more abundant in the low‐RI group (p < 0.05 and p < 0.01, respectively), and more resting CD4+ memory T cells were found in the high‐RI group (p < 0.05; Figure 6A). The phenotypes of CD8+ cells were further analyzed between low‐ and high‐RI groups. Exhaustion phenotype markers such as PDCD1 (PD‐1) and HAVCR2 (TIM‐3) were highly expressed in the patients with high RI (p < 0.05 and p < 0.001, respectively; Figure 6B). The expression of chemokines from CC, CXC, XC, and CX3C subfamily was also analyzed according to the level of RI. Among them, CXCL12, CCL23, and CCL14 were found to be correlated with RI (|r|>0.3, p < 0.05; Figure 6C–E).
FIGURE 5.
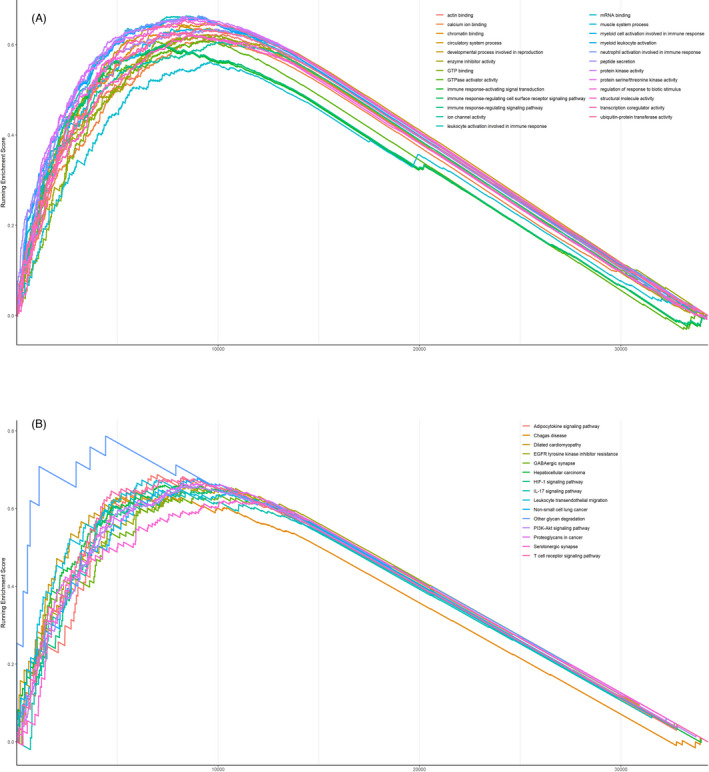
Immune‐related pathways involving in risk index (RI) identified by the Gene Ontology (GO) term enrichment analysis (A) and Kyoto Encyclopedia of Genes and Genomes (KEGG) pathway enrichment analysis (B)
FIGURE 6.
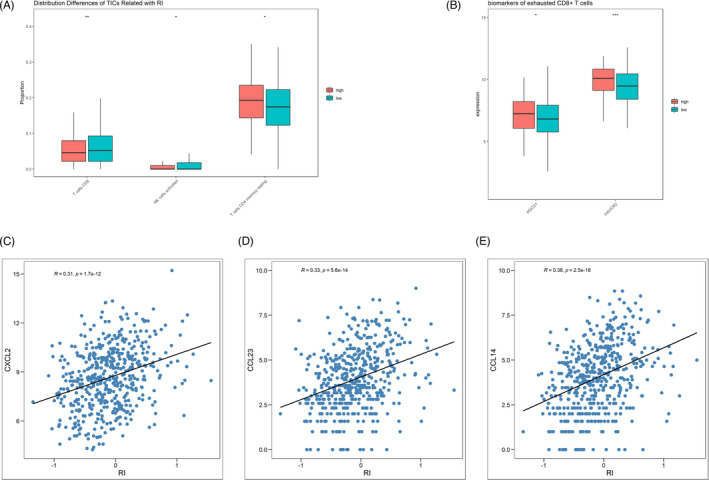
Distribution patterns and phenotypes of tumor‐infiltrating immune cells (TICs) and immune molecules in patients with high and low risk index (RI). (A) Distribution differences in TICs according to the value of RI. (B) Higher density of exhausted CD8+ T cells in the high‐RI group than in the low‐RI group. (C–E) The correlation between the level of RI and CXCL2, CCL23, and CCL14
4. DISCUSSION
Aberrant LLPS of molecules in living cells might trigger abnormal cellular activities, leading to human diseases. Previous studies presented robust evidence regarding the various LLPS‐related biological processes in the progression of neurodegenerative diseases. 15 , 16 As for the impact of LLPS on the development of cancer, relevant studies were limited. In the present study, the expression of LLPS‐related genes in LUSC was significantly different from normal tissues, which indicated the potential roles of LLPS processes in the cancer development.
The LASSO Cox regression analysis was known as an efficient method dealing with a high‐dimensional data and avoiding overfitting problems. 21 , 22 Thus, LASSO Cox was adopted in this study to provide the optimal solution for the prediction model by screening the suitable genes from a large number of candidates with low mutual correlation. In addition, the efficacy of the prediction model constructed by the selected genes was verified by the validation set.
The indispensable role of TICs in different types of cancer including LUSC has been reported by numerous studies. 23 , 24 , 25 Complex immune mechanisms illustrated the various effects of immune cells and immune molecules on cancer development, providing potential therapeutic targets and anti‐tumor strategies. 26 , 27 Recently, some studies tried to interpret immune activities in tumor microenvironment from the perspective of LLPS. 17 , 18 However, this field is still in its infancy. In the present study, our analysis identified a series of immune‐related processes were correlated with LLPS in LUSC, including pathways involving different immune cells, adaptive and innate immune response, and immune checkpoint. Thus, we further investigated the distribution pattern of TICs and immune molecules with different LLPS‐related gene signatures. As a result, the abundance of some critical cells in anti‐cancer immune activities, including CD8+ T cells, NK cells and CD4+ T cells, varied according to the value of RI. Additionally, the functions of CD8+ T cells were altered in patients with high RI in comparison with low RI. It was noteworthy that these biomarkers indicating the function of CD8+ T cells were also known as immune checkpoint, such as PD‐1 and TIM‐3. The differential expression of immune checkpoint was correlated with the level of RI, which implied the potential predictive value of RI for the therapeutic effectiveness of ICIs. The significant correlation between the expression of some chemokines and RI further indicated the immune effect of LLPS‐related processes in LUSC.
There were several limitations of this study. First, all the datasets were obtained from retrospective studies. A prospective study should be performed in the future to confirm these findings. Second, our conclusion was based on bioinformatic analysis without verification of molecular biological experiments.
In conclusion, the LLPS‐related gene–based prediction model was a robust prognostic tool for LUSC patients. The correlation between LLPS processes and immune activities might have an impact on the development of LUSC.
CONFLICT OF INTEREST
All authors have completed the ICMJE uniform disclosure form. The authors have no conflicts of interest to declare.
AUTHOR CONTRIBUTIONS
LZ and KZ conceptualized and designed the study. QB provided administrative support. ZZ and YL contributed to the provision of study materials or patients. WG collected and assembled the data. LZ analyzed and interpreted the data. All authors wrote the article and gave final approval of the article.
Zhuge L, Zhang K, Zhang Z, Guo W, Li Y, Bao Q. A novel model based on liquid‐liquid phase separation–Related genes correlates immune microenvironment profiles and predicts prognosis of lung squamous cell carcinoma. J Clin Lab Anal.2022;36:e24135. doi: 10.1002/jcla.24135
Lingdun Zhuge and Kun Zhang contributed equally to this work.
Contributor Information
Lingdun Zhuge, Email: ldzhuge16@fudan.edu.cn.
Qi Bao, Email: samsammama@163.com.
DATA AVAILABILITY STATEMENT
The relevant data that support the findings of this study are openly available from TCGA (https://portal.gdc.cancer.gov/) and GEO database (https://www.ncbi.nlm.nih.gov/geo/).
REFERENCES
- 1. Siegel RL, Miller KD, Fuchs HE, et al. Cancer statistics, 2021. CA Cancer J Clin. 2021;71(1):7‐33. [DOI] [PubMed] [Google Scholar]
- 2. Villanueva MT. Squamous cell lung cancer changes driver. Nat Rev Drug Discov. 2021;20:177. [DOI] [PubMed] [Google Scholar]
- 3. Gironés R, López P, Chulvi R, et al. Ten years of lung cancer in a single center: gender, histology, stage and survival. J Cancer Metastasis Treat. 2015;1:201. [Google Scholar]
- 4. Rekhtman N, Paik PK, Arcila ME, et al. Clarifying the spectrum of driver oncogene mutations in biomarker‐verified squamous carcinoma of lung: lack of EGFR/KRAS and presence of PIK3CA/AKT1 mutations. Clin Cancer Res. 2012;18:1167‐1176. [DOI] [PMC free article] [PubMed] [Google Scholar]
- 5. Zhang XC, Wang J, Shao GG, et al. Comprehensive genomic and immunological characterization of Chinese non‐small cell lung cancer patients. Nat Commun. 2019;10(1):1772. [DOI] [PMC free article] [PubMed] [Google Scholar]
- 6. Herbst RS, Morgensztern D, Boshoff C. The biology and management of non‐small cell lung cancer. Nature. 2018;553:446‐454. [DOI] [PubMed] [Google Scholar]
- 7. Paz‐Ares L, Luft A, Vicente D, et al. Pembrolizumab plus chemotherapy for squamous non‐small‐cell lung cancer. N Engl J Med. 2018;379(21):2040‐2051. [DOI] [PubMed] [Google Scholar]
- 8. Hirsch FR, Kerr KM, Bunn PA Jr, et al. Molecular and immune biomarker testing in squamous‐cell lung cancer: effect of current and future therapies and technologies. Clin Lung Cancer. 2018;19(4):331‐339. [DOI] [PubMed] [Google Scholar]
- 9. Mok TSK, Wu YL, Kudaba I, et al. Pembrolizumab versus chemotherapy for previously untreated, PD‐L1‐expressing, locally advanced or metastatic non‐small‐cell lung cancer (KEYNOTE‐042): a randomised, open‐label, controlled, phase 3 trial. Lancet. 2019;393:1819‐1830. [DOI] [PubMed] [Google Scholar]
- 10. Tomasini P, Greillier L. Targeted next‐generation sequencing to assess tumor mutation burden: ready for prime‐time in non‐small cell lung cancer? Transl Lung Cancer Res. 2019;8:S323‐S326. [DOI] [PMC free article] [PubMed] [Google Scholar]
- 11. Miura Y, Kasahara N, Sunaga N. Immune checkpoint inhibitors and driver oncogenes in non‐small cell lung cancer. Transl Cancer Res. 2019;8:S628‐S632. [DOI] [PMC free article] [PubMed] [Google Scholar]
- 12. Li P, Banjade S, Cheng HC, et al. Phase transitions in the assembly of multivalent signalling proteins. Nature. 2012;483(7389):336‐340. [DOI] [PMC free article] [PubMed] [Google Scholar]
- 13. Case LB, Ditlev JA, Rosen MK, et al. Regulation of transmembrane signaling by phase separation. Annu Rev Biophys. 2019;48:465‐494. [DOI] [PMC free article] [PubMed] [Google Scholar]
- 14. Frottin F, Schueder F, Tiwary S, et al. The nucleolus functions as a phase‐separated protein quality control compartment. Science. 2019;365(6451):342‐347. [DOI] [PubMed] [Google Scholar]
- 15. Wegmann S, Eftekharzadeh B, Tepper K, et al. Tau protein liquid‐liquid phase separation can initiate tau aggregation. EMBO J. 2018;37(7):e98049. [DOI] [PMC free article] [PubMed] [Google Scholar]
- 16. Deng H, Gao K, Jankovic J, et al. The role of FUS gene variants in neurodegenerative diseases. Nat Rev Neurol. 2014;10(6):337‐348. [DOI] [PubMed] [Google Scholar]
- 17. Xiao Q, McAtee CK, Su X. Phase separation in immune signalling. Nat Rev Immunol. 2021. [DOI] [PMC free article] [PubMed] [Google Scholar]
- 18. Lu J, Qian J, Xu Z, et al. Emerging roles of liquid‐liquid phase separation in cancer: from protein aggregation to immune‐associated signaling. Front Cell Dev Biol. 2021;9:631486. [DOI] [PMC free article] [PubMed] [Google Scholar]
- 19. You K, Huang Q, Yu C, et al. PhaSepDB: a database of liquid‐liquid phase separation related proteins. Nucleic Acids Res. 2020;48(D1):D354‐D359. [DOI] [PMC free article] [PubMed] [Google Scholar]
- 20. Newman AM, Liu CL, Green MR, et al. Robust enumeration of cell subsets from tissue expression profiles. Nat Methods. 2015;12(5):453‐457. [DOI] [PMC free article] [PubMed] [Google Scholar]
- 21. Tibshirani R. The lasso method for variable selection in the Cox model. Stat Med. 1997;16(4):385‐395. [DOI] [PubMed] [Google Scholar]
- 22. Tibshirani R. Regression shrinkage and selection via the lasso: a retrospective. J R Stat Soc Series B Stat Methodol. 2011;73(3):273‐282. [Google Scholar]
- 23. Jiang Y, Zhang Q, Hu Y, et al. ImmunoScore signature: a prognostic and predictive tool in gastric cancer. Ann Surg. 2018;267(3):504‐513. [DOI] [PubMed] [Google Scholar]
- 24. Fu H, Zhu Y, Wang Y, et al. Identification and validation of stromal immunotype predict survival and benefit from adjuvant chemotherapy in patients with muscle‐invasive bladder cancer. Clin Cancer Res. 2018;24(13):3069‐3078. [DOI] [PubMed] [Google Scholar]
- 25. Turley SJ, Cremasco V, Astarita JL, et al. Immunological hallmarks of stromal cells in the tumour microenvironment. Nat Rev Immunol. 2015;15(11):669‐682. [DOI] [PubMed] [Google Scholar]
- 26. Borghaei H, Paz‐Ares L, Horn L, et al. Nivolumab versus docetaxel in advanced nonsquamous non‐small‐cell lung cancer. N Engl J Med. 2015;373:1627‐1639. [DOI] [PMC free article] [PubMed] [Google Scholar]
- 27. Brahmer J, Reckamp KL, Baas P, et al. Nivolumab versus docetaxel in advanced squamous‐cell non‐small‐cell lung cancer. N Engl J Med. 2015;373:123‐135. [DOI] [PMC free article] [PubMed] [Google Scholar]
Associated Data
This section collects any data citations, data availability statements, or supplementary materials included in this article.
Data Availability Statement
The relevant data that support the findings of this study are openly available from TCGA (https://portal.gdc.cancer.gov/) and GEO database (https://www.ncbi.nlm.nih.gov/geo/).


