

Abstract
Background
Vascular calcification (VC) is usually associated with cardiovascular diseases (CVDs), which are one of the main causes of mortality in the world. This study aimed to analyze the expression of circular RNAs (circRNAs) in patients with VC and to evaluate biomarkers for the diagnosis of VC.
Methods
Calcified human aortic endothelial cells (HAECs) and the calcification in mouse aorta were detected by qRT‐PCR. Subsequently, this was verified in the plasma of patients with coronary artery calcification (CAC). The plasma of 40 patients in the control group and 31 patients in the calcified group were detected by quantitative reverse transcription polymerase chain reaction (qRT‐PCR) to detect the level of circSamd4a in the blood. The diagnostic value was evaluated by logistic regression analysis and the working characteristics of subjects.
Results
In the HAECs, the qRT‐PCR showed a significant decrease in the level of circSamd4a expression in the calcification group compared to the control group (p < 0.05). The calcified mouse aorta showed the same trend for circSamd4a expression, wherein the difference was statistically significant (p < 0.05); the expression of circSamd4a was significantly downregulated in the plasma of patients with VC (p < 0.01). The receiver operating characteristic (ROC) curves of circSamd4a in patients with VC and control group showed that the area under the curve (AUC) was 0.81 (95% CI: 0.707–0.913; p < 0.001).
Conclusion
CircSamd4a showed a stable downward trend in different specimens, and had significant advantages as a biomarker for diagnosis of VC.
Keywords: biomarkers, circSamd4a, circular RNA, coronary artery calcification, endothelial cells
CircSamd4a of calcified mouse aorta, endothelial cells and coronary artery calcified population showed a downward trend, and there was a significant negative correlation between circSamd4a and calcification score.
1. INTRODUCTION
Vascular calcification (VC) is the most common pathological phenomenon associated with cardiovascular diseases (CVDs). 1 Traditional risk factors, such as hypertension, diabetes, dyslipidemia, aging, and smoking, are involved in the development of VC. 2 , 3 VC can cause abnormal blood pressure, plaque rupture, thrombosis, and other serious consequences, resulting in the increased morbidity and mortality of those with CVDs. 4 , 5 Therefore, VC can often be used to predict adverse clinical outcomes. The early detection and intervention of VC can delay the progression of CVDs. At present, the clinical diagnosis of VC mainly relies on imaging methods. If new biomarkers can be identified to diagnose the presence of VC earlier than the imaging methods, it would have a greater clinical significance. 6
Circular RNAs (CircRNAs) are generated by a unique splice mechanism called reverse splice, 7 in which the downstream 5′ splice site serves as the splice donor, and the upstream 3′ splice site serves as the splice receptor. 8 , 9 Because circRNAs do not have 5′ or 3′ ends, they are highly stable, and their exonuclease resistance allows them to have significantly longer half‐lives than linear RNA molecules and be indigestible by exonuclease. 10 , 11 , 12 , 13 Most circRNAs are very stable and easily detectible in the peripheral blood. 14 RNA sequencing of human adult and fetal tissues (heart, kidney, liver, lung, colon, and stomach) has shown that up to 50% of circRNAs are tissue specific, 15 , 16 a property that makes them even more advantageous as biomarkers for various diseases. 15 , 17
In the study by Ryu et al., 6 the existence and biological role of circSamd4 in calcified rat smooth muscle cells (RVSMCs) was revealed, and circSamd4a was found to inhibit VC by acting as a miR‐125a‐3p/miR‐483‐5p molecular sponge. In the current study, we assessed whether circSamd4a could be used as a biomarker for the diagnosis of VC, given that there is no relevant study to date in this regard. Previous studies found that VC usually had a full layer of calcification foci, 18 mainly in vascular smooth muscle cells (VSMCs) and endothelial cells (ECs). 18 , 19 Other studies found that circSamd4a is stably expressed in the RVSMCs calcification model. Whether there is a correlation between circSamd4a and the calcification of mouse aorta, and subsequently human aortic endothelial cells (HAECs), is yet to be determined. If there is a correlation, there is a theoretical basis for using circSamd4a as a biomarker of VC, which could be further verified. We proposed to observe the expression of circSamd4a in calcified aorta by establishing a calcified aortic model in the mouse. We also conducted relevant clinical studies on coronary artery calcification (CAC). Since CAC is also a special type of VC, 20 it has been widely accepted that CAC score (CACS) can be used to quantify the degree of CAC, 21 , 22 which could be harmful. The expression of circSamd4a in the peripheral blood of patients with CAC could verify whether circSamd4a in peripheral blood can be used as a serum biomarker for patients with CAC. Ultimately, this study aimed to provide an experimental basis for confirming circSamd4a as a novel biomarker of VC.
2. MATERIALS AND METHODS
2.1. Culture and calcification induction of HAECs
HAECs were cultured with 10% fetal bovine serum (Hyclone) and placed in a 5% CO2, 37 ℃ incubator. The culture medium was changed every 2 days. When the cell proliferation reached 70%–80% of the growth surface, the cells were subcultured. When the cell proliferation reached the logarithmic growth phase, the seeds were frozen and preserved, and three‐to‐five generations of seed plates were selected, which adhered well to the wall after 24 h. The calcification of HAECs was induced using a continuous stimulation of 30 mmol/L β‐glycerophosphoric acid + 50 µg/ml l‐ascorbic acid + 100 nmol/L dexamethasone for 10 days. The culture medium was changed every 2 days, and 30 mmol/L β‐glycerophosphoric acid + 50 µg/ml l‐ascorbic acid + 100 nmol/L dexamethasone were added at the same time.
2.2. Experimental animals and models
SPF C57BL‐6 mice were collected from Qinglongshan Animal Breeding Farm (Jiangning District, Nanjing, China). The animal experiment was approved by the Animal Ethics Committee of Wuxi Clinical College that is affiliated with Anhui Medical University. All of the mice were adaptively fed at 24°C for 1 week with a 12‐h light–dark cycle and free access to water and food. Each animal was weighed and randomly grouped. The intravascular calcification model was induced by the intramuscular injection of vitamin D3‐anhydrous ethanol + 10 mg/ml nicotine‐peanut oil instillation, combined with a long‐term high‐fat diet. The control group was administered with the same dose of anhydrous ethanol intramuscular injection and peanut oil lavage, combined with normal diet feeding, for 9 weeks after death. The entire aorta (from ascending aorta to the iliac artery) was removed, and the fat and connective tissue were dissected in normal saline. Transverse sections were performed at the beginning and end of the aortic arch. The remaining vessels were kept in an embedding box and fixed with 10% neutral formalin for later use.
2.3. Clinical characteristics of the study population
The human study population was divided into two groups: the calcified group and the non‐calcified group. They were hospitalized in the Department of Cardiovascular Medicine, Wuxi Clinical College, Anhui Medical University from May 2020 to April 2021. Their chest computed tomography angiography results were collected, and their CACS were calculated. Meanwhile, blood samples from the patients were collected, centrifuged into plasma, and stored in a −80°C refrigerator. The following patients were excluded: those with incomplete clinical data, severe arrhythmia, previous acute myocardial infarction, percutaneous coronary intervention or coronary artery bypass grafting, degenerative aortic valve disease, severe insulin‐dependent diabetes, severe liver and kidney disease, acute or chronic infectious, and malignant tumors. A total of 31 patients met the inclusion criteria and were included in the calcification group (CACS 100–400, n = 13; CACS 400–800, including 400, n = 9; CACS ≥ 800, n = 9), while 40 were included in the control group (CACS = 0, n = 40). The protocol was approved by the hospital ethics committee with the informed consent obtained from all of the participants and it complied with the ethical guidelines of the Helsinki Declaration of 1975.
2.4. Methods of collecting and preserving peripheral blood
After the patients were admitted, 2–3 ml of elbow venous blood was extracted on an empty stomach in the morning of the next day and was placed in a test tube containing EDTA‐anticoagulative. Within 30 min after blood collection, the whole blood was centrifuged at 1500 g for 10 min at 4℃, and the supernatant was transferred to an RNase/Dnase‐free tube. The whole blood was then centrifuged for a second time at 12,000 g for 15 min at room temperature to remove cell fragments. The upper plasma was transferred to a new RNase/DNase‐free tube and stored in a −80℃ refrigerator. Blood samples of other biochemical items were collected at the same time and detected by automatic biochemical apparatus in the hospital laboratory.
2.5. Total RNA extraction and qRT‐PCR
According to the manufacturer's protocol, the total RNA was isolated using the TRIzol® LS Reagent (Invitrogen) extraction method, the circRNAs were extracted from the 200 µl plasma samples, and the amount and purity of circRNAs were measured using a spectrophotometer. Reverse transcription and quantitative detection were then performed according to the instructions of the Vazyme reverse transcription and quantitative kit (Vazyme Biotech Co., Ltd., Nanjing, China). The ABI7500 Real‐Time PCR system (Applied Biosystems, Foster City, CA, USA) was used for amplification. The relative expression level of circRNAs was determined using the cyclic number of qRT‐PCR. The relative expression levels of circRNAs were calculated using the 2‐ΔΔ CT method and the mean value was calculated. Primers for each target gene were designed and generated by the Gemma and Engineering Company, as shown in Table 1.
TABLE 1.
qRT‐PCR target gene primer
| Gene name | Species and genus | Primer sequence (5′−3′) |
|---|---|---|
| GAPDH | Human |
F:CATGAGAAGTATGACAACAGCCT R:AGTCCTTCCACGATACCAAAGT |
| BMP2 | Human |
F:TCAAGCCAAACACACAAACAGC R:ACGTCTGAACAATGGCATGA |
| BMP4 | Human |
F:CACCTCAACTCAACCAACCA R:CAACACCACCTTGTCATACTCA |
| circSamd4a | Human |
F:CCTTGGATTCCTGTTGCCATTGG R:GCCATGTGCCCCTCTACTCCTC |
| GAPDH | Mouse |
F:GTATCGGACGCCTGGTTAC R:CTTGCCGTGGGTAGAGTCAT |
| circSamd4a | Mouse |
F:CCTTGGATTCCTGTTGCCATTGG R:GCCACGTGCCCCTGTATTCTTC |
2.6. Von Kossa staining
The aorta of the mouse was dehydrated and fixed with 4% paraformaldehyde overnight. It was immersed in a mixture of paraffin and xylene (1:1) for 1–2 h. It was immersed in paraffin overnight. After the paraffin was solidified, the aorta was cut into five pieces, μM was placed on the slide, dewaxed and hydrated, and then stained and sealed according to Von Kossa staining solution kit (Wuhan Yibo Technology Co., Ltd.). The specimen was photographed under the microscope in the pathology department of our hospital.
2.7. Statistical analysis
Graph pad prism and MedCalc statistical software were used for statistical analysis and mapping. SPSS 23.0 software was used for statistical analysis. The CAC was analyzed by univariate analysis, and then by multivariate logistic analysis. Pearson correlation analysis was used to study the correlation between circSamd4a, traditional risk factors, and CAC. The ROC curve was further generated by MedCalc 15.2.2 statistical software. The AUC of circSamd4a was compared by Delong nonparametric method to analyze the predictive value of circSamd4a in patients with CAC; the measured data were expressed as mean ± standard deviation ( ± s), p < 0.05, the difference was statistically significant.
3. RESULTS
3.1. The CircSamd4a expression level was significantly downregulated in the calcified HAECs
We used the aforementioned calcification method to induce the calcification of HAECs. Western blot and qRT‐PCR analysis showed that the calcification model was established successfully (Figure 1A–C). We then used qRT‐PCR to detect circSamd4a expression level in calcified HAECs, and the result showed that circSamd4a expression level was significantly downregulated (Figure 1D).
FIGURE 1.

In HAECs, differential expression of circSamd4a in calcified group and non‐calcified group. (A) Calcification of HAECs was induced by β‐glycerophosphate, and the calcification‐related proteins BMP2 and BMP4 increased. (B, C) The HAECs calcification model was verified by qRT‐PCR, and calcification was successfully induced. (D) qRT‐PCR was used to detect the expression of circSamd4a in calcified HAECs.GAPDH was used as the reference gene. Data are presented as mean ± SEM. * means the difference is statistically significant
3.2. CircSamd4a expression level was significantly downregulated in the calcified mouse aorta
The calcification model of the mouse aorta was established using the aforementioned calcification induction method. After feeding time, the mice were killed and the aortas were removed. Von Kossa staining (Figure 2A), western blot (Figure 2B), and qRT‐PCR (Figure 2C) were used to detect whether the calcification model was successfully established. The result showed that the aortic calcification was successful. qRT‐PCR was used to detect circSamd4a expression levels in the calcified aorta of the mouse, and the result showed that the circSamd4a expression level was significantly downregulated (Figure 2D).
FIGURE 2.

In mouse tissues, circSamd4a was differentially expressed in calcified group and non‐calcified group. (A) Von Kossa staining of the aorta of control mice and calcified mice, the arrow shows the elastic fibers of intima and media were broken. A large number of black particles were deposited in the extracellular matrix. (B) Calcification marker protein BMP2 and BMP4 increased significantly in the blood vessels of calcified mice. (C) qRT‐PCR verified the mouse aortic calcification model, and the calcification was successfully induced. (D) qRT‐PCR was used to detect the expression of circSamd4a in calcified mouse aorta, which was significantly downregulated in calcified group. Data are presented as mean ± SEM. *means the difference is statistically significant
3.3. Statistical analysis
A total of 71 patients (35% women and 65% men) participated in the study. The study population comprised 40 controls with normal coronary arteries, with a mean age of 59.33 ± 11.48 years, and 31 patients with CAC, with a mean age of 63.61 ± 7.54 years. The following were the clinical characteristics and hematological, and biochemical indices of the two groups (Table 2). The level of circSamd4a in the calcification group was significantly lower than that in the control group (Figure 3).
TABLE 2.
Basic clinical characteristics of CAC group and non‐CAC group
| Variables | CAC (n = 31) | Non‐CAC (n = 40) | p‐value |
|---|---|---|---|
| Gender, male | 21 (68) | 25 (63) | 0.646 |
| Smoking, n (%) | 8 (26) | 7 (18) | 0.395 |
| Hypertension, n (%) | 23 (74) | 25 (63) | 0.296 |
| Diabetes mellitus, n (%) | 11 (35) | 8 (20) | 0.144 |
| Age (years) | 64 (62, 67) | 60 (56, 66) | 0.035 |
| BMI (kg/m2) | 23.77 (21.44, 25.28) | 23.65 (21.84, 26.21) | 0.462 |
| HbA1c (%) | 6.2 (5.6, 6.9) | 5.65 (5.4, 6.4) | 0.067 |
| circRNA Samd4a | 0.18 (0.051, 0.31) | 0.66 (0.36, 1.39) | <0.001 |
| LDL‐C (mmol/L) | 2.07 ± 0.75 | 2.54 ± 0.83 | 0.017 |
| HDL‐C (mmol/L) | 1.0 (0.83, 1.11) | 1.03 (0.81, 1.20) | 0.83 |
| TG (mmol/L) | 1.05 (0.78, 2.02) | 1.39 (1.10, 1.91) | 0.366 |
| TC (mmol/L) | 3.61 ± 1.02 | 4.20 ± 1.05 | 0.02 |
| ApoA1 (g/L) | 1.02 ± 0.21 | 1.0 ± 0.19 | 0.552 |
| ApoB (g/L) | 0.66 ± 0.23 | 0.83 ± 0.23 | 0.003 |
| LP (a) (mg/L) | 110.3 (18.9, 205.9) | 116.3 (56.3, 255) | 0.223 |
| UA (μmol/L) | 365 (289, 475) | 350 (281.25, 442) | 0.286 |
| SCr (μmol/L) | 67.19 ± 15.52 | 65.18 ± 16.33 | 0.597 |
| ALP (U/L) | 60 (49, 81) | 58.5 (50, 74) | 0.898 |
| FBG (mmol/L) | 5.57 (4.87, 7.86) | 4.94 (4.55, 5.55) | 0.038 |
| BUN (mmol/L) | 5.74 (4.58, 7.4) | 5.0 (4.19, 5.78) | 0.063 |
Abbreviations: ALP, alkaline phosphatase; ApoA1, apolipoprotein A1; ApoB, apolipoprotein B; BUN, blood urea nitrogen; FBG, fasting blood glucose; HbA1c, glycosylated hemoglobin; HDL‐C, high‐density lipoprotein cholesterol; LDL‐C, low‐density lipoprotein cholesterol; LP (a), lipoprotein a; SCr, serum creatinine; TC, total cholesterol; TG, triglyceride; UA, uric acid.
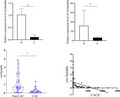
FIGURE 3.

Comparison of circSamd4a level between non‐CAC and CAC. *means the difference is statistically significant
3.4. Independent risk factors for VC
In univariate logistic analysis, the age, circSamd4a, low‐density lipoprotein cholesterol, total cholesterol, ApoB, and fasting blood glucose all showed variables with p < 0.05. After these indices were included in the multivariate logistic analysis, circSamd4a and ApoB were found to be independent risk factors for VC (Table 3).
TABLE 3.
Independent predictors of CAC
| Variables | Univariate analysis | Multivariable analysis | ||||
|---|---|---|---|---|---|---|
| p‐value | OR | 95% CI | p‐value | OR | 95% CI | |
| circSamd4a | 0.001 | 0.045 | 0.007–0.3 | 0.002 | 0.039 | 0.005–0.306 |
| ApoB (g/L) | 0.006 | 0.041 | 0.004–0.404 | 0.013 | 0.038 | 0.003–0.50 |
| LDL‐C (mmol/L) | 0.022 | 0.467 | 0.243–0.897 | ‐ | ‐ | ‐ |
| TC (mmol/L) | 0.024 | 0.57 | 0.35–0.929 | ‐ | ‐ | ‐ |
| FBG (mmol/L) | 0.048 | 1.305 | 1.002–1.699 | ‐ | ‐ | ‐ |
| Age (years) | 0.287 | 0.775 | 0.517–0.777 | ‐ | ‐ | ‐ |
Abbreviations: ApoB, apolipoprotein B; FBG, fasting blood glucose; LDL‐C, low‐density lipoprotein cholesterol; TC, total cholesterol.
3.5. Correlation between CACS and CircSamd4a expression level
After determining the differential expression of circSamd4a between the two groups, we continued to detect the correlation between circSamd4a and CACS, which was consistent with the ROC curve analysis results. The level of circSamd4a was significantly negatively correlated with CACS (r = −0.393, p < 0.001) (Figure 4).
FIGURE 4.

Spearman correlation coefficients between circSamd4a and CACS in CAC patients
3.6. The ROC curve analysis of plasma CircSamd4a among patients with CAC
To assess the potential value of plasma circSamd4a for patients with CAC, we performed a ROC curve analysis. The cut‐off point value of circSamd4a for the diagnosis of VC was 0.4417, and the AUC was 0.81 (95% CI: 0.706–0.913), with a sensitivity of 87.1% and specificity of 72.5% (Figure 5).
FIGURE 5.

ROC curve analysis of circSamd4a
4. DISCUSSION
Previous studies found that the expression of circSamd4a in RVSMCs was significantly downregulated and had a correlation with VC. In our study, HAECs calcification was induced by β‐glycerophosphic acid + l‐ascorbic acid + dexamethasone, and the calcification model was successfully established by western blot and qRT‐PCR. Combining with the previous literature, our study confirmed that circSamd4a was correlated with the calcified HAECs. In a further study, we established a model of calcified aorta induced by vitamin D3‐anhydrous ethanol intramuscular injection, and nicotine‐peanut oil lavage, combined with a long‐term high‐fat diet in the mouse. The successful establishment of the model was confirmed by pathological examination. It was confirmed that circSamd4a was correlated with calcified aorta in the mice, and circSamd4a in tissues could be used as a biomarker of VC. We studied the relationship and clinical significance between circSamd4a and CAC. We first detected the expression level of circSamd4a in plasma samples of patients with CAC, and the result confirmed the following: compared to the non‐calcified group, the level of circSamd4a was significantly decreased in the calcified group; circSamd4a and ApoB were independent risk factors for CAC in human; and there was a significant negative correlation between circSamd4a and coronary CACS. Combining the AUC, specificity, and sensitivity of the patient's working curve, circSamd4a has clinical significance in detecting the presence and severity of CAC.
More evidence suggests that circRNAs are highly expressed and evolutionarily conserved in eukaryotes and play a role in the occurrence and progression of a variety of diseases. 10 , 23 Although no single biomarker can be used for the diagnosis of VC, 4 , 24 the combination of different biomarkers can improve the sensitivity and specificity of the diagnosis. 25 Hu et al. 12 demonstrated that circSamd4a promoted the apoptosis and inflammatory development of H/R‐stimulated H9C2 cells and AMI mice by inhibiting mir‐138‐5p expression. Liu et al. 24 found that circSamd4a could inhibit the occurrence of obesity through the miR‐138‐5p/EZH2 axis. All of the aforementioned studies found that circSamd4a can target miRNA to regulate biological processes, and its conservatism and strong stability in humans and mice have potentiated the basis of circSamd4a as a biomarker for the diagnosis of VC.
CAC, as a marker of atherosclerosis, reflects the long‐term effects of the elevated risk of coronary artery disease (CAD) and independently predicts the risk of future CAD events in symptomatic patients. 26 , 27 Based on single‐center and multicenter clinical and population studies with long‐term data 28 (up to 15 years of follow‐up), CACS has emerged as a broad, stable, reproducible risk assessment method for predicting major cardiovascular outcomes, especially in planning primary prevention interventions, such as statins and aspirin, in asymptomatic populations. Clinical practice guidelines in the United States 21 and Europe 22 recognize CACS as a potentially useful way to improve the assessment of the cardiovascular risk in asymptomatic individuals and as a guide for initiating or delaying preventive therapy. Therefore, CACS is a good reference value to evaluate the occurrence of calcification. However, there is still a lack of an effective and convenient biomarker for the diagnosis and severity of VC. CircSamd4a has a high specificity and sensitivity for the diagnosis of VC and provides a reliable target for future therapeutic interventions for calcification.
In addition to the above risk factors, age and current smoking status are also independent risk factors for VC. 23 , 27 , 29 Moreover, comorbidities including hypertension, hypercholesterolemia, and diabetes are all independently associated with VC. 30 Previous studies have explored the predictive effect of VC on cardiovascular events, 25 , 31 which can predict all‐cause mortality and cardiovascular events. 32 The rapid progression of CACS is an independent predictor of mortality. CircSamd4a is a new marker of VC. If the level of circSamd4a in patients with VC can be detected regularly and its development over time can be monitored, it will provide convenience and direction for clinical detection of calcification progress and treatment. This is also the upcoming work of our research group.
5. CONCLUSION
We detected the above three kinds of calcification samples and obtained a consistent trend, that is, circSamd4a showed a downward trend in the calcification group and it serves as a stable marker for detecting VC. At the same time, it is faster and more convenient than traditional detection methods, which is conducive to detection over time. If the sample size can be expanded and continue the detection, its role as a marker of VC will be more prominent and convincing.
6. LIMITATIONS
This study was a single‐center prospective study with small sample size; thus, the sample size needs to be further expanded in subsequent studies. Meanwhile, the authors will continue to explore the possible molecular mechanism of circSamd4a and investigate downstream targets to provide therapeutic targets for delaying the progression of VC.
CONFLICT OF INTEREST
The authors declared no potential conflicts of interest concerning the research, authorship, and publication of this article.
AUTHOR CONTRIBUTIONS
Yuting Zhou and Yehong Liu conceived and designed the study. Shiyi Xuan, Tianhui Jin, Ke Chen, and Zufei Wu involved in data acquisition. Wentao Su, Liang Chen, and Gangjun Zong analyzed and interpreted the data. Yuting Zhou drafted the manuscript. Yehong Liu revised the manuscript for important intellectual content. All authors read and approved the final manuscript.
Zhou Y, Liu Y, Xuan S, et al. CircSamd4: A novel biomarker for predicting vascular calcification. J Clin Lab Anal.2022;36:e24156. doi: 10.1002/jcla.24156
Yuting Zhou and Yehong Liu have contributed equally to the writing of this article.
Funding information
This work was supported by the Natural Science Foundation of Jiangsu Province (BK20201139) and the Top Talent Support Program for young and middle‐aged people of Wuxi Health Committee (BJ2020119)
DATA AVAILABILITY STATEMENT
The data that support the findings of this study are available on request from the corresponding author. The data are not publicly available due to privacy or ethical restrictions.
REFERENCES
- 1. Malhotra R, Mauer A‐C, Cardenas‐CL L, et al. HDAC9 is implicated in atherosclerotic aortic calcification and affects vascular smooth muscle cell phenotype. Nat Genet. 2019;51(11):1580‐1587. [DOI] [PMC free article] [PubMed] [Google Scholar]
- 2. Shanahan C‐M, Crouthamel M‐H, Kapustin A, et al. Arterial calcification in chronic kidney disease: key roles for calcium and phosphate. Circ Res. 2011;109(6):697‐711. [DOI] [PMC free article] [PubMed] [Google Scholar]
- 3. Wu M, Rementer C, Giachelli C‐M. Vascular calcification: an update on mechanisms and challenges in treatment. Calcif Tissue Int. 2013;93(4):365‐373. [DOI] [PMC free article] [PubMed] [Google Scholar]
- 4. Zhu X, Tang X, Chong H, et al. Expression profiles of circular RNA in human atrial fibrillation with valvular heart diseases. Front Cardiovasc Med. 2020;7:597932. [DOI] [PMC free article] [PubMed] [Google Scholar]
- 5. Dweck M‐R, Chow M‐W, Joshi N‐V, et al. Coronary arterial 18F‐sodium fluoride uptake: a novel marker of plaque biology. J Am Coll Cardiol. 2012;59(17):1539‐1548. [DOI] [PubMed] [Google Scholar]
- 6. Ryu J, Kwon D‐H, Choe N, et al. Characterization of circular RNAs in vascular smooth muscle cells with vascular calcification. Mol Ther Nucleic Acids. 2020;19:31‐41. doi: 10.1016/j.omtn.2019.11.001 [DOI] [PMC free article] [PubMed] [Google Scholar]
- 7. Jeck W‐R, Sharpless N‐E. Detecting and characterizing circular RNAs. Nat Biotechnol. 2014;32(5):453‐461. [DOI] [PMC free article] [PubMed] [Google Scholar]
- 8. Lasda E, Parker R. Circular RNAs: diversity of form and function. RNA. 2014;20(12):1829‐1842. [DOI] [PMC free article] [PubMed] [Google Scholar]
- 9. Boeckel J‐N, Jaé N, Heumüller A‐W, et al. Identification and characterization of hypoxia‐regulated endothelial circular RNA. Circ Res. 2015;117(10):884‐890. [DOI] [PubMed] [Google Scholar]
- 10. Wang L, Shen C, Wang Y, et al. Identification of circular RNA Hsa_circ_0001879 and Hsa_circ_0004104 as novel biomarkers for coronary artery disease. Atherosclerosis. 2019;286:88‐96. doi: 10.1016/j.atherosclerosis.2019.05.006 [DOI] [PubMed] [Google Scholar]
- 11. Ouyang Q, Huang Q, Jiang Z, et al. Using plasma circRNA_002453 as a novel biomarker in the diagnosis of lupus nephritis. Mol Immunol. 2018;101:531‐538. doi: 10.1016/j.molimm.2018.07.029 [DOI] [PubMed] [Google Scholar]
- 12. Hu X, Ma R, Cao J, Du X, Cai X, Fan Y. CircSAMD4A aggravates H/R‐induced cardiomyocyte apoptosis and inflammatory response by sponging miR‐138‐5p. J Cell Mol Med. 2020. [DOI] [PMC free article] [PubMed] [Google Scholar]
- 13. Memczak S, Jens M, Elefsinioti A, et al. Circular RNAs are a large class of animal RNAs with regulatory potency. Nature. 2013;495(7441):333‐338. [DOI] [PubMed] [Google Scholar]
- 14. Werfel S, Nothjunge S, Schwarzmayr T, Strom T‐M, Meitinger T, Engelhardt S. Characterization of circular RNAs in human, mouse and rat hearts. J Mol Cell Cardiol. 2016;98:103‐107. [DOI] [PubMed] [Google Scholar]
- 15. Xu T, Wu J, Han P, Zhao Z, Song X. Circular RNA expression profiles and features in human tissues: a study using RNA‐seq data. BMC Genom. 2017;18(Suppl 6):680. [DOI] [PMC free article] [PubMed] [Google Scholar]
- 16. Bei Y, Yang T, Wang L, et al. Circular RNAs as potential theranostics in the cardiovascular system. Mol Ther Nucleic Acids. 2018;13:407‐418. [DOI] [PMC free article] [PubMed] [Google Scholar]
- 17. Wang K, Zhang S, Weber J, Baxter D, Galas DJ. Export of microRNAs and microRNA‐protective protein by mammalian cells. Nucleic Acids Res. 2010;38(20):7248‐7259. [DOI] [PMC free article] [PubMed] [Google Scholar]
- 18. Yao Y, Jumabay M, Ly A, Radparvar M, Cubberly MR, Boström KI. A role for the endothelium in vascular calcification. Circ Res. 2013;113(5):495‐504. [DOI] [PMC free article] [PubMed] [Google Scholar]
- 19. Meng F, Zhao Y, Wang B, et al. Endothelial cells promote calcification in aortic smooth muscle cells from spontaneously hypertensive rats. Cell Physiol Biochem. 2018;49(6):2371‐2381. [DOI] [PubMed] [Google Scholar]
- 20. Nonin S, Iwata S, Sugioka K, et al. Plaque surface irregularity and calcification length within carotid plaque predict secondary events in patients with coronary artery disease. Atherosclerosis. 2017;256:29‐34. [DOI] [PubMed] [Google Scholar]
- 21. Goff DC, Lloyd‐Jones D‐M, Bennett G, et al. 2013 ACC/AHA guideline on the assessment of cardiovascular risk: a report of the American College of Cardiology/American Heart Association Task Force on Practice Guidelines. J Am Coll Cardiol. 2014;63(25 Pt B):2935‐2959. [DOI] [PMC free article] [PubMed] [Google Scholar]
- 22. Piepoli M‐F, Hoes A‐W, Agewall S, et al. 2016 European Guidelines on cardiovascular disease prevention in clinical practice: The Sixth Joint Task Force of the European Society of Cardiology and Other Societies on Cardiovascular Disease Prevention in Clinical Practice (constituted by representatives of 10 societies and by invited experts): developed with the special contribution of the European Association for Cardiovascular Prevention & Rehabilitation (EACPR). Eur J Prev Cardiol. 2016;37(29):2315‐2381. [DOI] [PMC free article] [PubMed] [Google Scholar]
- 23. Allison M‐A, Hsi S, Wassel C‐L, et al. Calcified atherosclerosis in different vascular beds and the risk of mortality. Arterioscler Thromb Vasc Biol. 2012;32(1):140‐146. [DOI] [PubMed] [Google Scholar]
- 24. Liu W, Shukuan L, Weijia S, et al. Circulating microRNAs correlated with the level of coronary artery calcification in symptomatic patients. Sci Rep. 2015;5(1):16099. doi: 10.1038/srep16099 [DOI] [PMC free article] [PubMed] [Google Scholar]
- 25. Joshi FR, Rajani NK, Abt M, et al. Does vascular calcification accelerate inflammation? J Am Coll Cardiol. 2016;67(1):69‐78. [DOI] [PubMed] [Google Scholar]
- 26. Zha R, Guo W, Zhang Z, et al. Genome‐wide screening identified that miR‐134 acts as a metastasis suppressor by targeting integrin β1 in hepatocellular carcinoma. PLoS One. 2014;9(2):e87665. [DOI] [PMC free article] [PubMed] [Google Scholar]
- 27. van der Toorn J‐E, Rueda‐Ochoa O‐L, van der Schaft N, et al. Arterial calcification at multiple sites: sex‐specific cardiovascular risk profiles and mortality risk‐the Rotterdam Study. BMC Med. 2020;18(1):263. [DOI] [PMC free article] [PubMed] [Google Scholar]
- 28. Greenland P, Blaha M‐J, Budoff M‐J, Erbel R, Watson KE. Coronary calcium score and cardiovascular risk. J Am Coll Cardiol. 2018;72(4):434‐447. [DOI] [PMC free article] [PubMed] [Google Scholar]
- 29. Cho I‐J, Chang H‐J, Park H‐B, et al. Aortic calcification is associated with arterial stiffening, left ventricular hypertrophy, and diastolic dysfunction in elderly male patients with hypertension. J Hypertens. 2015;33(8):1633‐1641. [DOI] [PubMed] [Google Scholar]
- 30. Jacobs P‐C, Prokop M, van der Graaf Y, et al. Comparing coronary artery calcium and thoracic aorta calcium for prediction of all‐cause mortality and cardiovascular events on low‐dose non‐gated computed tomography in a high‐risk population of heavy smokers. Atherosclerosis. 2010;209(2):455‐462. [DOI] [PubMed] [Google Scholar]
- 31. Budoff M‐J, Hokanson J‐E, Nasir K, et al. Progression of coronary artery calcium predicts all‐cause mortality. JACC Cardiovasc Imaging. 2010;3(12):1229‐1236. [DOI] [PubMed] [Google Scholar]
- 32. Abdelbaky A, Corsini E, Figueroa A‐L, et al. Focal arterial inflammation precedes subsequent calcification in the same location: a longitudinal FDG‐PET/CT study. Circ Cardiovasc Imaging. 2013;6(5):747‐754. [DOI] [PubMed] [Google Scholar]
Associated Data
This section collects any data citations, data availability statements, or supplementary materials included in this article.
Data Availability Statement
The data that support the findings of this study are available on request from the corresponding author. The data are not publicly available due to privacy or ethical restrictions.