Abstract
Purpose
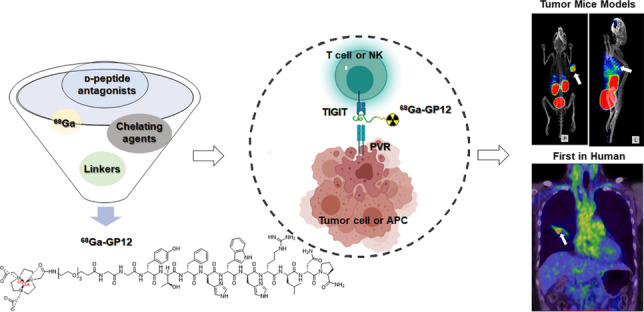
While TIGIT has been propelled as a next-generation target in cancer immunotherapy, anti-TIGIT therapy seems to be promising for a fraction of patients in clinical trials. Therefore, patient stratification is critical for this therapy, which could benefit from a whole-body, non-invasive, and quantitative evaluation of TIGIT expression in cancers. In this study, a 68Ga-labeled D-peptide antagonist, 68Ga-GP12, was developed and validated for PET imaging of TIGIT expression in vitro, in vivo, and in an exploratory human study.
Methods
The D-enantiomer peptide antagonists were modified and radiolabeled with 68Ga. In vitro binding assays were performed in human peripheral blood mononuclear cells (PBMCs) to assess their affinity and specificity. The imaging capacity, biodistribution, pharmacokinetics, and radiation dosimetry were investigated. Flow cytometry, autoradiography, and immunohistochemical staining were used to confirm the expression of TIGIT. The safety and potential of 68Ga-GP12 for PET/CT imaging of TIGIT expression were evaluated in NSCLC patients.
Results
68Ga-labeled D-peptides were conveniently produced with high radiochemical yields, radiochemical purities and molar activities. In vitro binding assays demonstrated 68Ga-GP12 has high affinity and specificity for TIGIT with a KD of 37.28 nM. In vivo and ex vivo studies demonstrated the capacity of 68Ga-GP12 for PET imaging of TIGIT expression with high tumor uptake of 4.22 ± 0.68 %ID/g and the tumor-to-muscle ratio of 12.94 ± 2.64 at 60 min post-injection. In NSCLC patients, primary and metastatic lesions found in 68Ga-GP12 PET images were comparable to that in 18F-FDG PET images. Moreover, tracer uptake in primary and metastatic lesions and intra-tumoral distribution in the large tumor were inhomogenous, indicating the heterogeneity of TIGIT expression.
Conclusion
68Ga-GP12 is a promising radiotracer for PET imaging of TIGIT expression in cancers, indicating its potential as a potential companion diagnostic for anti-TIGIT therapies.
Graphical abstract
Supplementary Information
The online version contains supplementary material available at 10.1007/s00259-021-05672-x.
Keywords: PET imaging, TIGIT, Immune checkpoints, D-Peptide antagonist
Introduction
Undoubtedly, cancer immunotherapy has been boosted by the discovery of inhibitory immune checkpoints such as CTLA-4 and PD-1/PD-L1 in the past decade [1]. While blockade of CTLA-4 or PD-1/PD-L1 has manifested compelling responses against certain cancer types in the clinic, only a subset of cancer patients could benefit from these inhibitors, and primary/adaptive resistance is often observed [2]. Therefore, alternative immune checkpoints are intensely pursued as therapeutic targets to modulate the immune responses [3, 4], which may bring additional clinical benefits for cancer patients.
One such immune checkpoint is the T cell immunoglobulin and immunoreceptor tyrosine-based inhibitory motif (ITIM) domain (TIGIT) receptor [5]. TIGIT is an inhibitory receptor expressed on CD4+ T cells, CD8+ T cells, natural killer (NK) cells and regulatory T cells (Treg), which could compete with costimulatory receptor CD226 for binding of the ligand Poliovirus Receptor (PVR) to deliver immunosuppressing signals [6]. Furthermore, TIGIT can inhibit NK cell-mediated tumor killing, induce immunosuppressive dendritic cells, impair T cell priming and differentiation and suppress cell killing by CD8+ T cells in the cancer immunity cycle, subsequently leading to tumor cell immune escape [7–9]. The upregulation of TIGIT has been observed in many malignant tumors and correlates with dismal clinical outcomes [10–12], which makes it a promising therapeutic target with the chance of clinical application.
A growing number of studies have reported the blockade of TIGIT with antagonistic monoclonal antibodies (mAbs), which produce favorable therapeutic efficacy in preclinical and clinical trials [13]. To date, there are approximate ten human anti-TIGIT mAbs of IgG isotypes that have entered clinical trials for evaluating their efficacy and safety either as a monotherapy or in combination with anti-PD-1/PD-L1 mAbs or chemotherapeutics [14]. In a phase I trial, anti-TIGIT MK-7684 used as monotherapy and in combination with pembrolizumab in patients with advanced solid tumors was evaluated (NCT02964013) [13]. The partial response rate was 3 % (n = 1/34) and 19 % (n = 8/43) in two groups, respectively. Recently, anti-TIGIT tiragolumab was granted Breakthrough Therapy Designation (BTD) and promoted to phase III trials based on the phase II CITYSCAPE trial (NCT03563716) [15]. This randomized study revealed an objective response rate (ORR) of 37 % in PD-L1-positive non-small cell lung cancer with tiragolumab plus atezolizumab treatment. In the subgroup with high PD-L1 expression, the combined treatment group had an ORR of 66 %. It was observed that a subset of patients could benefit from anti-TIGIT therapy owing to generally high but variable TIGIT expression between individuals [10–12, 15]. Currently, there are no companion diagnostics of TIGIT expression available for patient stratification in clinical trials.
While immunohistochemistry (IHC) is the clinical gold standard for pathological diagnosis, the heterogeneous and dynamic expression of immune checkpoints within the tumor microenvironment makes it inaccurate or imprecise presentation of clinical results [16, 17]. This is exemplified by the observation that PD-L1 negative tumors have responded to anti-PD-1/PD-L1 treatment [18]. Fortunately, the use of positron emission tomography (PET) as an in vivo imaging method to quantify PD-1/PD-L1 expression has demonstrated a better relevance with therapy response than IHC in clinical trials [19–22]. This instigated research in PET imaging of TIGIT expression for the stratification of patients. Most recently, Shaffer et al. validated 64Cu and 89Zr-labeled anti-TIGIT mAb as radiotracers for PET imaging of TIGIT status on tumor-infiltrating lymphocytes [23]. However, the long blood circulation and slow clearance from the body make it difficult to obtain the optimal target-to-background ratio in a short time. Small molecule candidates, such as peptides, have attracted considerable attention for their potentials in the design of PET imaging tracers with the advantages of comparable affinity and specificity, favorable pharmacokinetics, and easy synthesis and modification [24].
Following this tendency, the first D-enantiomer peptide antagonists were identified by mirror-image phage display biopanning and blocked the interaction of TIGIT/PVR with high affinity and specificity [25], which motivates our design of TIGIT-targeting small molecule PET tracers. In this study, we developed and validated a 68Ga-labeled D-peptide antagonist, 68Ga-GP12, for PET imaging of TIGIT expression in cancers. Furthermore, the safety and potential of 68Ga-GP12 for PET/CT imaging of TIGIT expression were evaluated in an exploratory human study with advanced NSCLC patients.
Materials and methods
Production of 68Ga-labeled D-peptides
NOTA-D-peptides with polyethylene glycol linkers were custom synthesized by GL Biochem Co., Ltd. (Shanghai, China) and fully characterized by mass spectrometry (Fig. S1). The preparation of 68Ga-labeled D-peptides was accomplished according to the reported methods [21, 24]. The radiosynthesis and characterization including radiochemical yield, radiochemical purity, molar activity, partition coefficient, in vitro and in vivo stability were described in Supplemental Information.
Peptide-protein docking
Docking studies between GP12 and TIGIT (PDB: 3UDW chain A) were carried out using the Autodock Vina program. All calculations for protein-fixed ligand-flexible docking were done using the Lamarckian Genetic algorithm (LGA) method. The peptide-protein conformations including hydrogen bonds and the bond lengths were analyzed using PyMol.
In vitro assays
Human peripheral blood mononuclear cells (PBMCs) were isolated from fresh peripheral blood of healthy donors by centrifugation over Ficoll-Paque (Tianjin Hao Yang Biological Manufacture Co., Ltd., Tianjin, China) using its protocol. Isolated PBMCs (2 × 10⁵ cells/well) were planted in a 24-well plate with RPMI 1640 medium containing 10 % FBS and activated by 5 μg/mL of phytohemagglutinin (PHA-M, Sigma) in a 5 % CO2 atmosphere at 37 °C for 48 h. As a control, non-activated PBMCs were cultured at the same condition.
For cell uptake study, activated PBMCs and non-activated PBMCs were incubated with 68Ga-labeled D-peptides (74 kBq/well), respectively. At different time points (5, 15, 30, 60, and 120 min), the cells were washed with cold PBS (500 μL × 3), lysed with 1 M NaOH and collected for γ-count and their cell uptake was calculated as the percentage of cell-associated radioactivity. In blocking experiments, the cells were co-incubated with 10 μg of unlabeled D-peptides.
For saturation binding assays, different concentrations of 68Ga-labeled D-peptides were added to activated PBMCs with or without pretreatment with unlabeled D-peptides (30 μg). After 1 h incubation at 4 °C, the cells were washed, dissolved and collected for counts using a γ-counter to determine non-specific binding (NSB) and total binding (TB). Specific binding (SB) was derived and plotted against the concentrations of 68Ga-labeled D-peptides to calculate the dissociation constant KD using GraphPad Prism 7.0 software (San Diego, USA).
Tumor cells and animal models
B16F10, MC38, and Panc02 cells were obtained from the China Center for Type Culture Collection (CCTCC) and cultured in DMEM medium supplemented with 10 % fetal bovine serum (Gibco), 100 U/mL penicillin, and 100 mg/mL streptomycin (Invitrogen) at 37 °C in a moist atmosphere of 5 % CO2 and 95 % air.
All the mice were obtained from the Laboratory Animal Center of Xiamen University. For subcutaneous xenograft models, tumor cells (5 × 10⁶) were resuspended in 200 μL of PBS and implanted into the right shoulder of C57BL/6 male mice (6-8 weeks old). The mice were used for in vivo and ex vivo studies after 6-10 days of growth. For melanoma pulmonary metastases models, B16F10 cells (1 × 10⁵) in 200 μL of PBS were intravenously injected into C57BL/6 male mice (7-8 weeks old). The mice were used for in vivo and ex vivo studies after 5 days of growth.
Small animal PET imaging
All animal studies were performed according to the guidelines of the Animal Care Committee of Xiamen University. For dynamic imaging, the tumor-bearing C57BL/6 mice were intravenously injected with 7.4-11.1 MBq of 68Ga-GP12 and the subsequent acquisition was performed for 120 min with an Inveon PET scanner under anesthesia. For static imaging, a 10 min PET scan was obtained after 60 min post-injection (p.i.) of 3.7-7.4 MBq 68Ga-labeled D-peptides. The images were reconstructed and regions of interest (ROIs) were drawn to obtain time-radioactivity curves and tumor-to-muscle ratios. The quantitative data were indicated as the percentage injected dose per gram of tissue (%ID/g). The blocking experiments were further conducted by either intravenous injection of GP12 (2 mg/kg) 1 h before the injection of radiotracers or intraperitoneal administration of anti-TIGIT mAb (5 mg/kg) 24 h in advance.
Flow cytometry
To explore the relationship between tumor uptake of 68Ga-GP12 on PET images (%ID/g) with TIGIT expression, flow cytometry was employed to determine the TIGIT expression on CD45+ cell, CD4+ T cell, CD8+ T cell, NK cell, and regulatory T cell (Treg), respectively. Single-cell suspensions of mononuclear cells were isolated from tumor samples after PET imaging by centrifugation with 40 % Percoll. 1 × 10⁶ mononuclear cells were resuspended in PBS buffer containing 0.2 % BSA and co-cultured with CD16/CD32 Fc block antibodies (Biolegend) for 20 min at 4 °C. Then, the cells were stained for surface phenotypic markers using specific fluorochrome-conjugated antibodies in PBS buffer for 30 min at 4 °C in the dark. The flow cytometry analysis was conducted using a BD influx cell sorter (BD Biosciences) according to the strategy shown in Fig. S11. The acquired data were analyzed with the FlowJo Analysis Software (Version 10).
Biodistribution, pharmacokinetics, and radiation dosimetry
The biodistribution was conducted in B16F10 xenograft models after intravenous injection of 1.85 MBq of 68Ga-GP12. At the indicated time points (30, 60, 120 min), each mouse was sacrificed and dissected, and organs/tissues of interest were collected and weighed. The radioactivity in each sample was measured by a γ-counter to calculate the percentage of injected dose per gram (%ID/g, mean ± SD).
A pharmacokinetic study was carried out using C57BL/6 male mice intravenously injected with 18.5 MBq of 68Ga-GP12. Blood samples at the corresponding time point were collected, weighed, and measured with a γ-counter. The %ID/g was derived to obtain the time-radioactivity curve. Non-compartment models were used to calculate pharmacokinetic parameters.
The radiation dosimetry of 68Ga-GP12 in adult females and males was estimated by analyzing the biodistribution results in C57BL/6 mice, respectively. The different tissue uptakes (%ID/g) were determined and plotted against the time to calculate the area under curves (AUCs) using GraphPad Prism 7.0 software. These results were further converted to standard human distribution. The absorbed dose of organs and effective dose were estimated using OLINDA/EXM 1.0 software (Hermes Medical Solutions AB).
Exploratory human study
This pilot study was approved by the Medical Ethics Committee of Xiangya Hospital, Central South University (Ethics Approval No. 202106115) and conducted according to the guidelines of the Declaration of Helsinki. Written informed consent was provided by all the participants. After a low-dose CT scan, the patients underwent whole-body dynamic imaging for approximately 60 min after injection of 68Ga-GP12 (3.7-5.2 MBq/kg) on a GE Discovery PET/CT 690 Elite scanner (Waukesha, USA). The 18F-FDG PET/CT imaging was acquired within 1 week. 68Ga-GP12 and 18F-FDG PET/CT scans were processed by two independent, experienced nuclear medicine physicians. The standardized uptake value (SUV) in the volume ROIs was obtained using a GE AW 4.6 workstation. The imaging findings of 68Ga-GP12 PET/CT were compared with that of 18F-FDG PET scans and further confirmed by histopathology.
Autoradiography, H&E, and IHC staining
At 60 min after injection of 68Ga-GP12, slices of tumor samples were acquired and exposed to a phosphor imaging plate for 1 h, which was subsequently visualized using a Sapphire biomolecular imager. The formaldehyde-prefixed tumor samples were processed and stained using an anti-TIGIT antibody (BOSTER, A01962-1) for mice and anti-TIGIT antibody [BLR047F] (Abcam, ab243903) for humans. Leica ST5020 multistainer (Heidelberg, Germany) was employed for H&E staining. Zeiss AX10 bright field microscope was used to capture histology images.
Statistical analysis
The quantitative data were indicated as mean ± SD and statistically analyzed by GraphPad Prism 7.0 software. The differences within groups and between groups were compared by using two-tailed paired, unpaired Student’s t-tests and one-way ANOVA, respectively. Differences of P < 0.05 indicate statistical significance.
Results
Production of 68Ga-labeled D-peptides
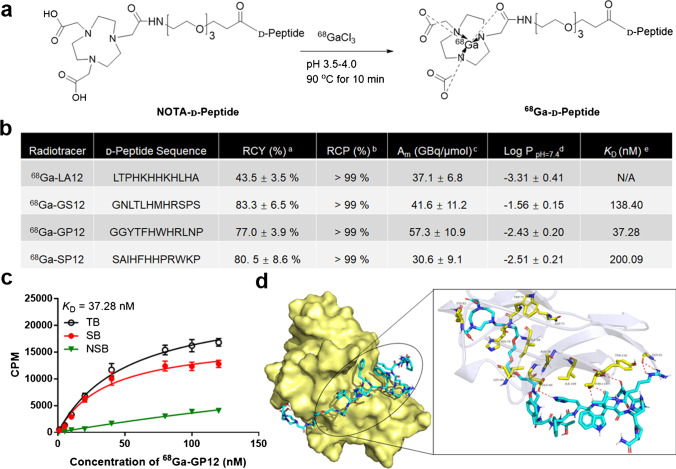
To perform 68Ga-radiolabeling and concurrently preserve their affinity and specificity, the modification of D-peptides (sequence: LA12, LTPHKHHKHLHA; GS12, GNLTLHMHRSPS; GP12, GGYTFHWHRLNP; SP12, SAIHFHHPRWKP) with polyethylene glycol linkers and NOTA were designed and explored. Several NOTA-D-peptides were synthesized, radiolabeled with 68Ga and screened for TIGIT imaging (Fig. 1a and Fig. S1). 68Ga-labeled D-peptides were obtained after Sep-Pak purification with a radiosynthesis time of 40-60 min (n = 8). As shown in Fig. 1b, the overall radiochemical yields were 43.5-83.3 % (n = 5) and their molar activities at end-of-synthesis were calculated to be 30.6-57.3 GBq/μmol, respectively (n = 3). The final products were verified by their non-radioactive standards (Fig. S2), and the radiochemical purities were > 99 % (n = 5). The partition coefficients (log P) at pH 7.4 were determined to be -3.31- -1.56 (n = 6), indicating their hydrophilicity. In vitro stabilities of 68Ga-labeled D-peptides were confirmed in saline and serum within 4 h (Fig. S3).
Fig. 1.
Design and development of 68Ga-labeled D-peptide antagonists. a Radiosynthesis of 68Ga-labeled D-peptide antagonists. b Radiochemical characterization and binding affinity of 68Ga-labeled D-peptide antagonists. aRCY, radiochemical yield, n = 5. bRCP, radiochemical purity, n = 5. cAm, molar activity, n = 3. dn = 6. c The saturation binding assay of 68Ga-GP12 (en = 3). d Peptide-protein docking. The binding mode and key interactions between 68Ga-GP12 (cyan) and TIGIT (pale yellow)
In vitro assays
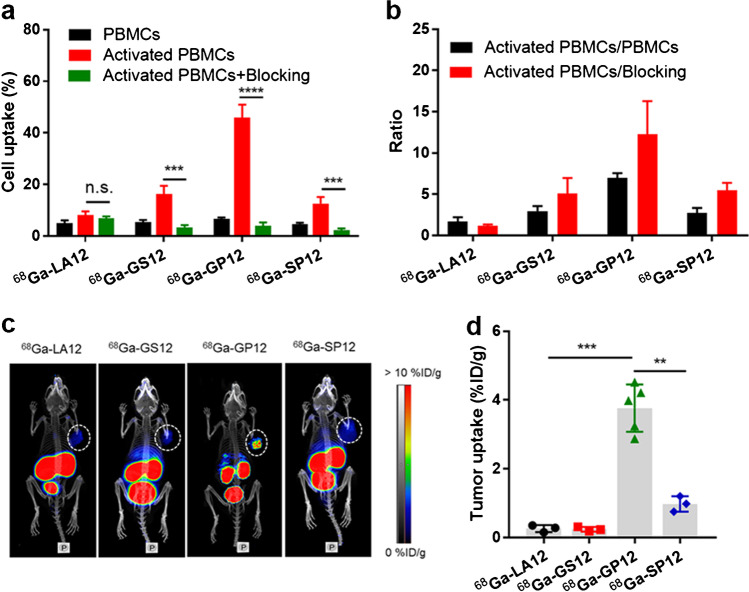
The significant upregulation of TIGIT on human PBMCs after stimulation was demonstrated by flow cytometry and western blot (Fig. S4). Saturation binding experiments were performed in activated PBMCs. Among them, 68Ga-GP12 displayed a much higher affinity for TIGIT protein with a dissociation constant KD of 37.28 nM (Fig. 1b, c and Fig. S5). Time-dependent cellular uptake of 68Ga-labeled D-peptides was studied in non-activated and activated PBMCs, respectively (Fig. S6). It was found that cellular uptakes of 68Ga-labeled D-peptides increased with time and were saturated after 60 min of incubation. With an exception of 68Ga-LA12, the uptakes were significantly decreased after blocking with an excess of unlabeled D-peptides (Fig. 2a), indicating their specific uptake in activated PBMCs. 68Ga-GP12 uptake (45.88 ± 4.98 %) in the activated PBMCs was substantially higher than that of 68Ga-LA12 (8.08 ± 1.48 %, P < 0.001), 68Ga-GS12 (16.29 ± 3.20 %, P < 0.001) and 68Ga-SP12 (12.66 ± 2.47 %, P < 0.001). Furthermore, the activated-to-nonactivated ratios and the activated-to-blocking ratios were determined and compared, which indicates the excellent specificity of 68Ga-GP12 in vitro (Fig. 2b). In addition, through docking analysis, the optimized steric complementarity of 68Ga-GP12 with binding sites of TIGIT was formed with a binding energy of -10.35 kcal/mol (Fig. 1d). 68Ga-GP12 could interact with TIGIT through Asn-58, Glu-60, Trp-75, Lys-82, and Thr-117, among which Asn-58 and Thr-117 were key residues of TIGIT/PVR interaction. It revealed that 68Ga-GP12 might interact with TIGIT through the binding interface of TIGIT/PVR.
Fig. 2.
Discovery and validation of 68Ga-GP12 for TIGIT imaging. a In vitro binding assay in human PBMCs. The cell uptake of 68Ga-labeled D-peptide antagonists after 60 min of incubation (n = 4) in activated and non-activated PBMCs. b The ratios of activated to non-activated cells and activated to blocking cells were derived from above data. c PET imaging of 68Ga-labeled D-peptide antagonists in B16F10 xenograft models (n = 5). d The tumor uptakes (%ID/g) were determined from PET images. The data are shown as mean ± SD, ****P < 0.0001 ***P < 0.001, **P < 0.01; n.s., not significant
Small animal PET imaging
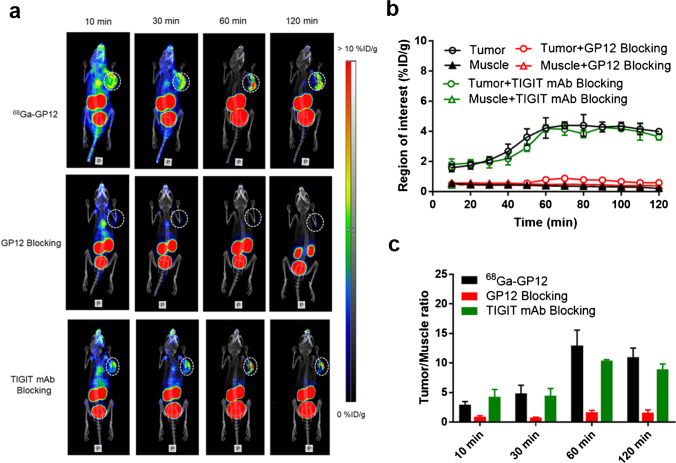
The TIGIT-targeting ability of 68Ga-labeled D-peptides was compared by PET imaging in B16F10 xenograft models. Tumor uptake of 68Ga-GP12 (3.76 ± 0.68 %ID/g) was observed after 60 min of injection, which is fully distinguished from other radiotracers (Fig. 2c and d). The potential of 68Ga-GP12 for imaging of TIGIT was further evaluated by whole-body dynamic imaging. As shown in Fig. 3a, tumors were visualized rapidly at 10 min p.i. (1.58 ± 0.26 %ID/g) and the optimized images were obtained at 60 min p.i. (4.22 ± 0.68 %ID/g) after injection, with the highest tumor/muscle ratio of 12.94 ± 2.64 (Fig. 3b and c). The blocking study pretreated with an excess of GP12 showed no tumor uptake during PET acquisition. At 60 min p.i., the accumulation of 68Ga-GP12 in tumor was decreased to 0.78 ± 0.16 %ID/g (P < 0.001) with a tumor/muscle ratio of 1.66 ± 0.35 (P < 0.01). This demonstrated the specificity of 68Ga-GP12 for imaging of TIGIT in vivo. However, tumor uptake of 68Ga-GP12 was not blocked by the pretreatment with anti-TIGIT mAbat any time points (4.18 ± 0.23 % ID/g, tumor/muscle ratio 10.40 ± 0.14 at 60 min p.i.). These results were also demonstrated by ex vivo autoradiography of tumors (Fig. S7a and 7b).The expression of TIGIT in tumors was determined by H&E and IHC (Fig. S7c and S7d).
Fig. 3.
In vivo PET imaging of 68Ga-GP12 (n = 3). a Dynamic PET scanning of B16F10 xenograft models with or without pretreatment with GP12 or anti-TIGIT mAb over 0-120 min after injection of 68Ga-GP12. The time-activity curves (b) and tumor/muscle ratios (c) were derived from the PET images
In addition, 68Ga-GP12 PET imaging of TIGIT was verified by other types of tumor-bearing mice. In the B16F10 melanoma pulmonary metastasis models, diffuse bilateral lung abnormal uptake of 68Ga-GP12 was detected, which was manifested as focal asymmetry uptake in 18F-FDG PET/CT imaging (Fig. S8). This result indicated the heterogeneity of TIGIT expression, further confirmed by H&E and IHC. As expected, the capacity of 68Ga-GP12 for PET imaging of TIGIT expression was also confirmed in Panc02 and MC38 tumor models (Fig. S9 and S10).
Flow cytometry and correlation with tumor uptake
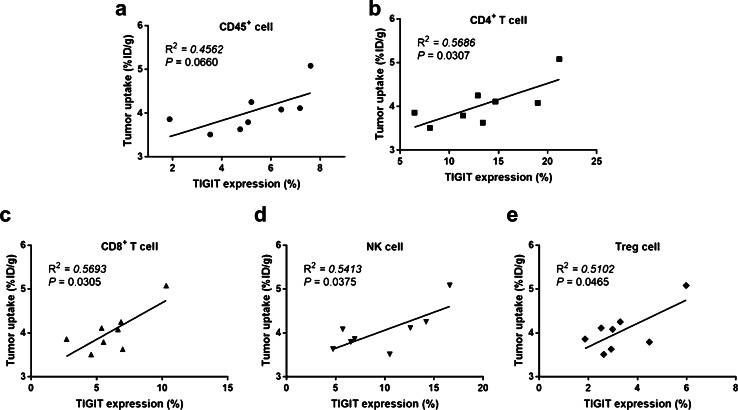
The relevance between tumor uptake of 68Ga-GP12 on PET images and TIGIT expression in tumor microenvironment was thoroughly investigated (Fig. S11). As measured in flow cytometry, the percentages of CD45+TIGIT+ cells, CD4+TIGIT+ T cells, CD8+TIGIT+ T cells, TIGIT+ NK cells and TIGIT+ Treg cells in total tumor-infiltrating lymphocytes were determined to be 5.21 ± 1.90 %, 13.39 ± 5.00 %, 6.12 ± 2.20 %, 9.73 ± 4.39 %, and 3.34 ± 1.30 %, respectively. It was found that a positive correlation occurs for CD4+ TIGIT+ T cells (R2 = 0.5686, P = 0.0307), CD8+ TIGIT+ T cells (R2 = 0. 593, P = 0.0305), TIGIT+ NK cells (R2 = 0.5413, P = 0.0375) and TIGIT+ Treg cells (R2 = 0. 5102, P = 0.0465), but not for TIGIT+CD45+ cells (R2 = 0.4562, P = 0.0660) (Fig. 4).
Fig. 4.
Correlation between the TIGIT expression analyzed by ex vivo flow cytometry and tumor uptake (%ID/g) of 68Ga-GP12 on PET images in B16F10 xenograft models (n = 8)
Biodistribution, pharmacokinetics, and radiation dosimetry
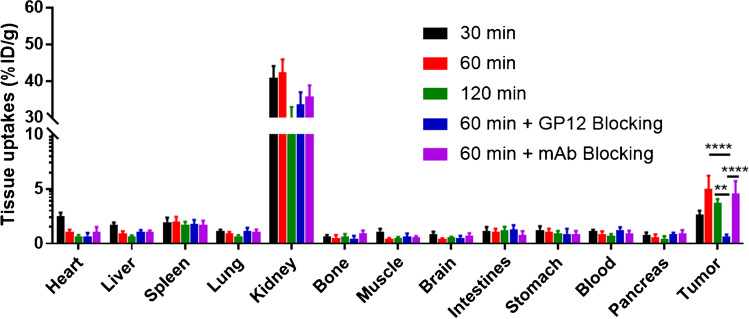
The biodistribution of 68Ga-GP12 in B16F10 melanoma-bearing mice was investigated (Fig. 5 and Table S1). The radiotracer displayed a rapid and broad distribution in tissues, predominantly in the kidney with subsequent elimination through the urinary system. At 60 min p.i., the kidney (42.33 ± 3.52 %ID/g) had relatively higher uptake of radioactivity compared with the spleen (1.99 ± 0.48 %ID/g) and other organs (< 1.00 % ID/g). The accumulation of 68Ga-GP12 in tumors reached a plateau (5.00 ± 1.24 %ID/g), resulting in the optimized tumor/muscle and tumor/blood ratios (11.14 ± 2.18 and 5.59 ± 0.83) (Fig. S12a). Tumor uptake of 68Ga-GP12 was decreased to 0.66 ± 0.17 %ID/g in GP12 blocking group with absent tumor/muscle and tumor/blood ratios (1.09 ± 0.30 and 0.53 ± 0.12) (Fig. S12b). Conversely, the anti-TIGIT mAb blocking group demonstrated a slight decline in tumor uptake (4.56 ± 1.15 %ID/g) and tumor/muscle and tumor/blood ratios (8.06 ± 1.90 and 4.89 ± 0.89). The pharmacokinetics study revealed that 68Ga-GP12 was quickly cleared from the blood with a half-life of 27.02 min (Fig. S13). In addition, in vivo metabolic stability of 68Ga-GP12 was verified by radio-HPLC analysis, which reveals more than 90 % of intact radiotracer in blood, the liver and urine within 1 h after injection (Fig. S14).
Fig. 5.
Biodistribution of 68Ga-GP12 in B16F10 xenograft models (n = 5). The accumulation of 68Ga-GP12 (%ID/g) in tumors and normal organs at different time points was demonstrated. The data are shown as mean ± SD, ****P < 0.0001, **P < 0.01
To assess the safety of human use with 68Ga-GP12, a rodent dosimetry study was conducted to estimate human-equivalent absorbed doses of organs and effective doses (Table S2). Owing to urinary excretion of 68Ga-GP12, the organs that received the highest absorbed dose were the kidneys and urinary bladder wall. The effective dose was calculated to be 1.28E-02 mSv/MBq for adult females and 1.02E-02 mSv/MBq for adult males, which is comparable to that of 18F-FDG as previously reported [26].
Exploratory human PET/CT imaging
Two patients with pathologically confirmed lung adenocarcinoma received the intravenous injection of 68Ga-GP12 (203.5 and 233.1 MBq, respectively) for PET/CT imaging. The patient characteristics were shown in Table S3. No adverse or clinically detectable pharmacologic effects were observed. There were no significant changes in vital signs or the results of laboratory studies or electrocardiograms.
The biodistribution of 68Ga-GP12 in patients was mainly observed in the kidney, ureter and bladder, followed by moderate accumulation in tumor, blood pool, liver and spleen (Fig. S15). Other tissues or organs such as the brain, muscle, intestine, and thyroid showed weak uptake of radioactivity. The tracer was rapidly eliminated from the blood pool, resulting in high tumor/muscle and tumor/blood ratios (4.06 and 1.39 at 41 min, 3.89 and 1.28 at 50.5 min). The optimized time-point for image acquisition was 40 min after injection of 68Ga-GP12.
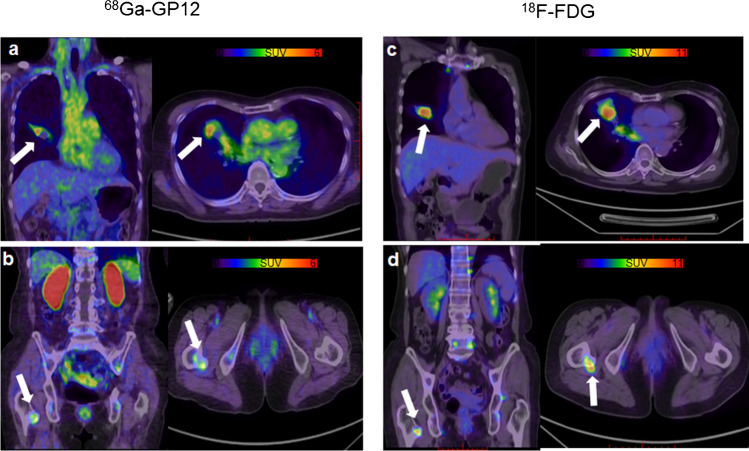
Patient 1 (a 72-year-old man) was diagnosed with primary bronchogenic adenocarcinoma. The primary tumor in the right lung (white arrow) showed focal uptake of 68Ga-GP12 (SUVmax = 4.82, Fig. 6a), and 18F-FDG (SUVmax = 9.45, Fig. 6c). Furthermore, a metastatic lesion on the right femur was detected in both 68Ga-GP12 PET/CT (SUVmax = 2.80, Fig. 6b) and 18F-FDG PET/CT imaging (SUVmax = 7.75, Fig. 6d). The expression of TIGIT in the primary tumor was confirmed by immunohistochemistry (Fig. S16).
Fig. 6.
First-in-human study of 68Ga-GP12. A 72-year-old male with lung adenocarcinoma showed focal uptake of (a) 68Ga-GP12 (SUVmax = 4.82) and (c) 18F-FDG (SUVmax = 9.45) in the primary tumor of the right lung (white arrow). A metastatic lesion on the right femur was detected in both (b) 68Ga-GP12 PET/CT (SUVmax = 2.80) and (d) 18F-FDG PET/CT imaging (SUVmax = 7.75)
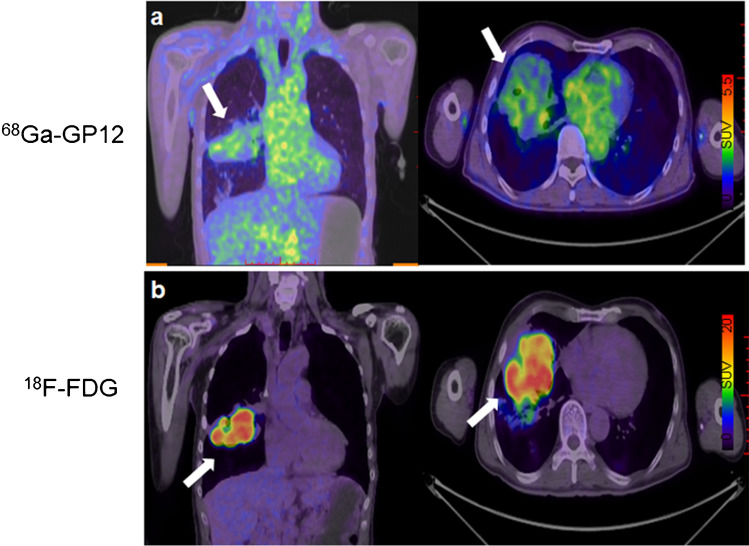
Patient 2 (a 57-year-old man) was diagnosed with primary bronchogenic adenocarcinoma. A large tumor on the right lung (white arrow) showed the diffuse uptake in 68Ga-GP12 PET/CT imaging (SUVmax = 2.95, Fig. 7a) and intensive uptake in 18F-FDG PET/CT imaging (SUVmax = 18.56, Fig. 7b), indicating the heterogeneity of TIGIT expression in the large tumor.
Fig. 7.
A 57-year-old male was diagnosed with lung adenocarcinoma. The large tumor on the right lung (white arrow) showed the diffuse uptake in (a) 68Ga-GP12 PET/CT imaging (SUVmax = 2.95) and intensive uptake in (b) 18F-FDG PET/CT imaging (SUVmax = 18.56), demonstrating the heterogeneity of TIGIT expression in the large tumor
Discussion
While TIGIT has been propelled under the spotlight as a next-generation target in cancer immunotherapy, anti-TIGIT therapy seems to be promising for a fraction of patients in clinical trials [14, 15, 23]. Therefore, patient stratification is critical for this therapy, which could benefit from a whole-body, non-invasive and quantitative evaluation of TIGIT expression in cancer. In this study, we developed and validated a novel 68Ga-labeled D-peptide antagonist, 68Ga-GP12, for PET imaging of TIGIT expression in cancers. Furthermore, the safety and potential of 68Ga-GP12 for PET/CT imaging of TIGIT expression were evaluated in a pilot study with advanced NSCLC patients.
Owing to the considerable potential in the design of PET imaging tracers, the first D-enantiomer peptide antagonists were modified, radiolabeled with 68Ga and screened for TIGIT imaging. 68Ga-labeled D-peptides were conveniently produced with high radiochemical yields and molar activities. In vitro binding assays demonstrated 68Ga-GP12 has high affinity and specificity for TIGIT, which were further confirmed by preliminary PET/CT imaging in B16F10 xenograft models. The peptide-protein docking revealed that 68Ga-GP12 might interact with TIGIT through the binding interface of TIGIT/PVR. These results encouraged us to further investigate the potential of 68Ga-GP12 for in vivo imaging of TIGIT. In four tumor models, the tumor could be visualized rapidly with the optimized tumor-to-muscle ratio at 60 min p.i., which is superior to that of 64Cu and 89Zr-labeled anti-TIGIT mAb [23]. The in vivo specificity of 68Ga-GP12 for TIGIT was identified in a blocking study pretreated with an excess of GP12. Interestingly, tumor uptakes of 68Ga-GP12 were not blocked by pretreatment of anti-TIGIT mAb. This finding indicated the different binding epitopes of 68Ga-GP12 and anti-TIGIT mAb to TIGIT protein, which endows it with the capacity of detecting TIGIT expression and evaluating prognosis in course of anti-TIGIT therapy. As expected, tumor uptake of 68Ga-GP12 was positively associated with TIGIT expression on CD4+ T cell, CD8+ T cell, NK cell, and Treg cell, respectively. The considerable tumor accumulation and rapid blood clearance of 68Ga-GP12 contributed to the optimized PET imaging with high tumor/muscle and tumor/blood ratios in a short time. The uptake of radioactivity was also detected in the spleen because of abundant lymphocytes [8]. The radiotracer showed a broad distribution in tissues, predominantly in the kidney with subsequent elimination through the urinary system, owing to its hydrophilicity. The kidneys and urinary bladder wall received the highest absorbed dose. The effective dose was comparable to that of 18F-FDG [26], highlighting the safety of 68Ga-GP12 as a PET tracer. All these results indicate 68Ga-GP12 as a promising radiotracer for PET imaging of TIGIT expression in vivo.
To the best of our knowledge, 68Ga-GP12 is the first TIGIT-targeting PET tracer that was tested in patients with advanced NSCLC. The optimized time-point for image acquisition is 40 min after injection of 68Ga-GP12. Impressively, the primary and metastatic lesions found in 68Ga-GP12 PET/CT imaging were comparable to that in 18F-FDG PET/CT imaging. Moreover, the different uptakes in primary and metastatic lesions and inhomogenous intra-tumoral distribution in the large tumor were observed in 68Ga-GP12 PET/CT images, indicating the heterogeneity of TIGIT expression levels. However, the tumor uptake of 18F-FDG was intensive in the lesions regardless of TIGIT expression. In addition, the biodistribution of 68Ga-GP12 in patients was similar to that observed in preclinical studies. No adverse effect was found in patients receiving the injection of 68Ga-GP12.
Although promising preliminary results of this exploratory human study, the potential of 68Ga-GP12 for PET imaging of TIGIT expression in cancer was not well characterized in the clinical setting because of the unavailability of enough patient samples (affected by COVID-19) The lack of enough tumor tissues for TIGIT immunohistochemical analysis is another limitation of our study. More patients are being recruited in clinical trials for evaluating 68Ga-GP12 PET/CT as a potential companion diagnostic for anti-TIGIT therapies.
Conclusion
A novel 68Ga-labeled D-peptide antagonist, 68Ga-GP12, was developed and validated for PET imaging of TIGIT expression in vitro and in vivo. The high affinity and specificity, favorable pharmacokinetics and excellent imaging capacity indicated that 68Ga-GP12 is a promising radiotracer for PET imaging of TIGIT expression in cancers. Furthermore, the preliminary results of this exploratory human study support the continued clinical development of 68Ga-GP12 PET/CT as a potential companion diagnostic for anti-TIGIT therapies.
Supplementary Information
Below is the link to the electronic supplementary material.
Acknowledgements
The authors acknowledge the staff of the Department of PET Center, Xiangya Hospital for the help in the first-in-human study. The authors thank Dr. Chao Chen (Xiangya Hospital) for FACS analysis, Prof. Jie Dong (Central South University) and Dr. Xin Yan (Sun Yat-sen University) for the assistance in peptide-protein docking.
Author contribution
Conceptualization: XZ and SH; Methodology: XW, MZ, XZ and SH; Data collection and analysis: XW, MZ, BC, HL, JF and SX; Patient recruitment, PET imaging and image analysis: MZ, BC, SX, XW and SH; Manuscript writing, review and editing: XW, XZ and SH.
Funding
This study was financially supported by the Joint Fund of National Natural Science Foundation of China-China National Nuclear Corporation for Nuclear Technology Innovation (U1967222), National Natural Science Foundation of China (81801762, 91859207, 91959122) and Natural Science Foundation of Hunan Province of China (2020JJ5956).
Declarations
Ethics approval
All procedures involving human participants were approved by the Medical Ethics Committee of Xiangya Hospital, Central South University (Ethics Approval No. 202106115). All animal studies were performed according to the guidelines of the Animal Care Committee of Xiamen University.
Conflict of interest
The authors declare no competing interests.
Footnotes
This article is part of the Topical Collection on Preclinical Imaging
Publisher's note
Springer Nature remains neutral with regard to jurisdictional claims in published maps and institutional affiliations.
Xiaobo Wang and Ming Zhou contributed equally to this work
Contributor Information
Shuo Hu, Email: hushuo2018@163.com.
Xianzhong Zhang, Email: zhangxzh@xmu.edu.cn.
References
- 1.Pardoll DM. The blockade of immune checkpoints in cancer immunotherapy. Nat Rev Cancer. 2012;12:252–64. doi: 10.1038/nrc3239. [DOI] [PMC free article] [PubMed] [Google Scholar]
- 2.Sharma P, Hu-Lieskovan S, Wargo JA, et al. Primary, adaptive, and acquired resistance to cancer immunotherapy. Cell. 2017;168:707–23. doi: 10.1016/j.cell.2017.01.017. [DOI] [PMC free article] [PubMed] [Google Scholar]
- 3.Andrews LP, Yano H, Vignali DAA. Inhibitory receptors and ligands beyond PD-1, PD-L1 and CTLA-4: breakthroughs or backups. Nat Immunol. 2019;20:1425–34. doi: 10.1038/s41590-019-0512-0. [DOI] [PubMed] [Google Scholar]
- 4.Meric-Bernstam F, Larkin J, Tabernero J, et al. Enhancing anti-tumour efficacy with immunotherapy combinations. Lancet. 2021;397:1010–22. doi: 10.1016/S0140-6736(20)32598-8. [DOI] [PubMed] [Google Scholar]
- 5.Chauvin JM, Zarour HM. TIGIT in cancer immunotherapy. J Immunother Cancer. 2020;8:e000957. doi: 10.1136/jitc-2020-000957. [DOI] [PMC free article] [PubMed] [Google Scholar]
- 6.Stengel KF, Harden-Bowles K, Yu X, et al. Structure of TIGIT immunoreceptor bound to poliovirus receptor reveals a cell-cell adhesion and signaling mechanism that requires cis-trans receptor clustering. Proc Natl Acad Sci U S A. 2012;109:5399–404. doi: 10.1073/pnas.1120606109. [DOI] [PMC free article] [PubMed] [Google Scholar]
- 7.Manieri NA, Chiang EY, Grogan JL. TIGIT: A key inhibitor of the cancer immunity cycle. Trends Immunol. 2017;38:20–8. doi: 10.1016/j.it.2016.10.002. [DOI] [PubMed] [Google Scholar]
- 8.Zhang Q, Bi J, Zheng X, et al. Blockade of the checkpoint receptor TIGIT prevents NK cell exhaustion and elicits potent anti-tumor immunity. Nat Immunol. 2018;19:723–32. doi: 10.1038/s41590-018-0132-0. [DOI] [PubMed] [Google Scholar]
- 9.Yu X, Harden K, Gonzalez LC, et al. The surface protein TIGIT suppresses T cell activation by promoting the generation of mature immunoregulatory dendritic cells. Nat Immunol. 2009;10:48–57. doi: 10.1038/ni.1674. [DOI] [PubMed] [Google Scholar]
- 10.Yang ZZ, Kim HJ, Wu H, et al. TIGIT expression is associated with T-cell suppression and exhaustion and predicts clinical outcome and anti-PD-1 response in follicular lymphoma. Clin Cancer Res. 2020;26:5217–31. doi: 10.1158/1078-0432.CCR-20-0558. [DOI] [PubMed] [Google Scholar]
- 11.Liu Z, Zhou Q, Wang Z, et al. Intratumoral TIGIT+CD8+ T-cell infiltration determines poor prognosis and immune evasion in patients with muscle-invasive bladder cancer. J Immunother Cancer. 2020;8:e000978. doi: 10.1136/jitc-2020-000978. [DOI] [PMC free article] [PubMed] [Google Scholar]
- 12.Chiu DK, Yuen VW, Cheu JW, et al. Hepatocellular carcinoma cells up-regulate PVRL1, stabilizing PVR and inhibiting the cytotoxic T-cell response via TIGIT to mediate tumor resistance to PD1 inhibitors in mice. Gastroenterology. 2020;159:609–23. doi: 10.1053/j.gastro.2020.03.074. [DOI] [PubMed] [Google Scholar]
- 13.Harjunpää H, Guillerey C. TIGIT as an emerging immune checkpoint. Clin Exp Immunol. 2020;200:108–19. doi: 10.1111/cei.13407. [DOI] [PMC free article] [PubMed] [Google Scholar]
- 14.Yeo J, Ko M, Lee DH, et al. TIGIT/CD226 axis regulates anti-tumor immunity. Pharmaceuticals (Basel) 2021;14:200. doi: 10.3390/ph14030200. [DOI] [PMC free article] [PubMed] [Google Scholar]
- 15.Anonymous. Tiragolumab Impresses in multiple trials. Cancer Discov. 2020;10:1086-1087. [DOI] [PubMed]
- 16.Topalian SL, Taube JM, Anders RA, et al. Mechanism-driven biomarkers to guide immune checkpoint blockade in cancer therapy. Nat Rev Cancer. 2016;16:275–87. doi: 10.1038/nrc.2016.36. [DOI] [PMC free article] [PubMed] [Google Scholar]
- 17.van der Leun AM, Thommen DS, Schumacher TN. CD8(+) T cell states in human cancer: insights from single-cell analysis. Nat Rev Cancer. 2020;20:218–32. doi: 10.1038/s41568-019-0235-4. [DOI] [PMC free article] [PubMed] [Google Scholar]
- 18.Teng MWL, Ngiow SF, Ribas A, et al. Classifying cancers based on T-cell infiltration and PD-L1. Cancer Res. 2015;75:2139–45. doi: 10.1158/0008-5472.CAN-15-0255. [DOI] [PMC free article] [PubMed] [Google Scholar]
- 19.Bensch F, van der Veen EL, Lub-de Hooge MN, et al. 89Zr-atezolizumab imaging as a non-invasive approach to assess clinical response to PD-L1 blockade in cancer. Nat Med. 2018;24:1852–8. [DOI] [PubMed]
- 20.Niemeijer AN, Leung D, Huisman MC, et al. Whole-body PD-1 and PD-L1 positron emission tomography in patients with non-small-cell lung cancer. Nat Commun. 2018;9:4664. [DOI] [PMC free article] [PubMed]
- 21.Zhou X, Jiang J, Yang X, et al. First-in-human evaluation of a PD-L1-binding peptide radiotracer in non-small cell lung cancer patients with PET. J Nucl Med. 2021 doi: 10.2967/jnumed.121.262045. [DOI] [PMC free article] [PubMed] [Google Scholar]
- 22.Xing Y, Chand G, Liu C, et al. Early phase I study of a 99mTc-labeled anti-programmed death ligand-1 (PD-L1) single-domain antibody in SPECT/CT assessment of PD-L1 expression in non-small cell lung cancer. J Nucl Med. 2019;60:1213–20. [DOI] [PMC free article] [PubMed]
- 23.Shaffer T, Natarajan A, Gambhir SS. PET Imaging of TIGIT expression on tumor-infiltrating lymphocytes. Clin Cancer Res. 2021;27:1932–40. [DOI] [PubMed]
- 24.Kumar D, Lisok A, Dahmane E, et al. Peptide-based PET quantifies target engagement of PD-L1 therapeutics. J Clin Invest. 2019;129:616–30. doi: 10.1172/JCI122216. [DOI] [PMC free article] [PubMed] [Google Scholar]
- 25.Zhou X, Zuo C, Li W, et al. A novel d-peptide identified by mirror-image phage display blocks TIGIT/PVR for cancer immunotherapy. Angew Chem Int Ed Engl. 2020;59:15114–8. doi: 10.1002/anie.202002783. [DOI] [PubMed] [Google Scholar]
- 26.Boellaard R, O’Doherty MJ, Weber WA, et al. FDG PET and PET/CT: EANM procedure guidelines for tumour PET imaging: version 1.0. Eur J Nucl Med Mol Imaging. 2010;37:181–200. [DOI] [PMC free article] [PubMed]
Associated Data
This section collects any data citations, data availability statements, or supplementary materials included in this article.


