

Abstract
Stimulatory immune receptor NKG2D binds diverse ligands to elicit differential anti‐tumor and anti‐virus immune responses. Two conflicting degeneracy recognition models based on static crystal structures and in‐solution binding affinities have been considered for almost two decades. Whether and how NKG2D recognizes and discriminates diverse ligands still remain unclear. Using live‐cell‐based single‐molecule biomechanical assay, we characterized the in situ binding kinetics of NKG2D interacting with different ligands in the absence or presence of mechanical force. We found that mechanical force application selectively prolonged NKG2D interaction lifetimes with the ligands MICA and MICB, but not with ULBPs, and that force‐strengthened binding is much more pronounced for MICA than for other ligands. We also integrated steered molecular dynamics simulations and mutagenesis to reveal force‐induced rotational conformational changes of MICA, involving formation of additional hydrogen bonds on its binding interface with NKG2D, impeding MICA dissociation under force. We further provided a kinetic triggering model to reveal that force‐dependent affinity determines NKG2D ligand discrimination and its downstream NK cell activation. Together, our results demonstrate that NKG2D has a discrimination power to recognize different ligands, which depends on selective mechanical force‐induced ligand conformational changes.
Keywords: conformational changes, ligand discrimination, mechanical regulation, NKG2D
Subject Categories: Cell Adhesion, Polarity & Cytoskeleton; Immunology; Signal Transduction
Force‐induced alterations of ligand affinity and conformation allow immune receptor NKG2D to recognize different ligands and trigger distinct signaling responses for downstream natural killer cell activation.

Introduction
NKG2D (natural killer group 2, member D) is a potent stimulatory receptor that binds multiple stress‐induced ligands to elicit anti‐tumor and anti‐virus immune responses of both innate and adaptive immune cells (Xu et al, 2011; Raulet et al, 2013; Lanier, 2015). Commonly expressed on natural killer (NK) cells, CD8+ αβT cells, and γδT cells, human NKG2D associates with DAP10 adaptor at the cellular plasma membrane to eliminate tumorigenic or virally infected cells upon ligand engagement (Bauer et al, 1999; Wu et al, 1999; Billadeau et al, 2003). On NK cells, NKG2D is capable of activating perforin‐dependent cytotoxicity and cytokine release, such as IFN‐γ, by overcoming the MHC class I (MHC‐I) molecule‐dependent inhibitory signals and by disrupting the balance of stimulatory and inhibitory signals (Bauer et al, 1999; Brown et al, 2012).
Human NKG2D ligands, including MIC (the MHC class I chain‐related) family (MICA and MICB) and ULBP (UL16 binding proteins) family (ULBP1‐6), are homologous proteins of MHC‐I molecules (Groh et al, 1996; Cosman et al, 2001). Structurally, other than α1 and α2 domains, MICA/MICB contains an α3 domain that ULBPs lack (Li et al, 2001; Radaev et al, 2001, 2002). In sequence, MICA and MICB share 83% identical residues in their α1 and α2 domains (Cosman et al, 2001), and ULBP family share only 21–29% identical residues in α1 and α2 domains with the MICs and 38–59% amino acid sequence identity among each other (Radaev et al, 2001; Robinson et al, 2009; Muller et al, 2010). Although all of the diverse ligands are capable of activating NKG2D‐mediated signaling, their binding with NKG2D can activate differential immune functions (Cosman et al, 2001; Sutherland et al, 2002; Dunn et al, 2003; Roy et al, 2008; Balint et al, 2018; Wang et al, 2020). For instance, they can induce different levels of ERK/Akt phosphorylation, thus activating different cytotoxic abilities of NK cells (Cosman et al, 2001; Sutherland et al, 2002; Dunn et al, 2003). Moreover, MICA can induce a higher level of IFN‐γ mRNA expression than ULBP1 (Wang et al, 2020). Balint et al (2018) have also reported that distinct NKG2D ligands are not equivalent in their abilities to reorganize IL‐15 receptors at the nanoscale and to elicit distinct cortical actin remodeling and degranulation. ULBP1, but not other NKG2D ligands, on the target cell is able to trigger the lysis of regulatory T cells in the immune response to an intracellular pathogen (Roy et al, 2008). Moreover, MIC family molecules are more frequently and abundantly expressed on the surface of tumor cells (Dhar & Wu, 2018). Their expressions are better than ULBPs’ to correlate with overall survival of tumor patients. For instance, inhibition of MICA/B or high expression of ULBP2/4 has been reported as indicators for poor prognosis in hepatocellular carcinoma or ovarian cancer (Li et al, 2009; McGilvray et al, 2010; Fang et al, 2014). Altogether, these distinct biological functions of these NKG2D ligands suggest that NKG2D is capable of recognizing and discriminating different ligands to elicit differential immune functions.
Crystal structures and in‐solution biochemical binding analysis of NKG2D interacting with different ligands suggest an extreme degeneracy for NKG2D ligand recognition (Radaev et al, 2001, 2002; McFarland & Strong, 2003; McFarland et al, 2003). That is, a single binding surface on the NKG2D can bind distinct surfaces of divergent ligands (Radaev et al, 2001, 2002; Strong, 2002; McFarland & Strong, 2003; McFarland et al, 2003). Two recognition models have been proposed for NKG2D to explain the degeneracy almost two decades ago. One is the “induced‐fit” model, supported by the complementary interface formed by asymmetric orientation between NKG2D and ligands and by the conformational plasticity of NKG2D upon ligand binding (Radaev et al, 2001, 2002). The other one is the “rigid adaptation” model, supported by thermodynamic analysis that reveals rapid association rate of NKG2D ligand binding governed by entropy rather than enthalpy (McFarland & Strong, 2003; McFarland et al, 2003). But both recognition models are being challenged. For example, since the unliganded human NKG2D structure was released, the structural flexibility revealed by the comparison between ligand‐bound NKG2D (human) and free NKG2D (murine) structures to support the “induced‐fit” model (Margulies, 2003; McFarland et al, 2003) seems to play a minor role in NKG2D ligand recognition. On the other hand, the “rigid adaption model” cannot well explain the conformational changes of the peripheral amino acid residues of MICA and MICB in the structure complexes with NKG2D (Margulies, 2003; McFarland & Strong, 2003).
Moreover, both degeneration models cannot correctly reflect different functions of NKG2D in recognizing different ligands, leading us to hypothesize that NKG2D may be able to discriminate these different ligands to elicit different immune cell functions. If so, structurally how does NKG2D achieve this recognition capability, as it is structurally very different from T‐cell receptors and its ligands are also unlike pMHCs that can load different peptides (Gee et al, 2018; Wu et al, 2019). In physiological and pathological conditions, NK cells, the same as other immune cells, are under highly dynamic physical contact with target cells, and thereby, mechanical loading is inevitably exerted on their receptors (e.g., NKG2D)/ligand bonds. For example, to search for ligands on target cells, NK cells highly dynamically patrol in tissues and interact with target cells, exerting traction forces on the molecular complex of immune receptors (e.g., NKG2D) binding with their ligands (Deguine et al, 2010; Brown et al, 2011, 2012; Le Saux et al, 2019). Other than the cell migration, membrane bending upon cell‐cell contact could also generate mechanical force on receptor/ligand bonds (Zhu et al, 2019; Zhang et al, 2021). It has also been reported that the stiffnesses of normal and tumor tissues are quite different, which significantly impacts immune cells activation (Eagle et al, 2009; Tian et al, 2015; Basu et al, 2016). For example, the softness of tumor cells can prevent cytotoxic immune cell killing (Liu et al, 2021), and the stiffening of tumor cells can enhance the immune cell’s killing sensitivity (Tello‐Lafoz et al, 2021). Actually, NK cells have been shown to apply at least 10 pN force to MICA functionalized nanowires through NKG2D receptor and convert mechanical stimulation into biochemical signals (Billadeau et al, 2003; Le Saux et al, 2019). Altogether, considering that NKG2D ligand discrimination proceeds in a very dynamic and mechanical microenvironment, which is absent in biochemical in‐solution analysis of recombinant soluble ligand binding with soluble NKG2D ectodomains (Eleme et al, 2004; Brown et al, 2011, 2012), we thus propose that NGK2D might use mechanical force to fulfill its ligand discrimination function through mechanical regulation of binding kinetics of NKG2D interacting with different ligands.
In this work, we thereby applied single‐molecule biomechanical assay to characterize in situ mechanical force‐dependent binding kinetics of NKG2D interacting with its ligands to reveal the ligand discrimination capability of NKG2D. Integrated with molecular dynamic simulation and mutagenesis‐based binding and functional assay, we revealed that mechanical force allosterically induced MICA conformational changes to selectively prolong NKG2D bond lifetimes with its different ligand under force, which perfectly correlated with the potency of these ligands in stimulating NKG2D‐mediated NK cells. Our results demonstrate that NKG2D, fostered by mechanical force, is capable of discriminating different ligands to elicit differed NK cell activation.
Results
Characterization of in situ force‐free kinetics of NKG2D interacting with different ligands
We firstly measured the in situ force‐free kinetics of NKG2D binding with various ligands by using micropipette‐based single‐cell adhesion frequency assay (Chen et al, 2008; Huang et al, 2010; Hu et al, 2019) (Figs 1A and B and EV1A–H). We found that the effective in situ affinities (A c K a) (Fig 1C) of NKG2D binding with different ligands (MICA, MICB, and ULBP1) spanned an order of magnitude from 10−3 to 10−2 µm4. Comparing NKG2D’s in situ binding affinities with different ligands, we found that NKG2D/MICA binding affinity (1.72 × 10⁻³ μm4) was about 10 times higher than those of NKG2D’s binding with either ULBP1 (1.39 × 10⁻⁴ μm4) or ULBP3 (1.98 × 10⁻⁴ μm4) but similar with NKG2D/MICBs (3.00 × 10⁻³ μm4) (Fig 1C). Compared with the effective in situ on‐rates, both MICA and MICB exhibited about twenty times faster on‐rates (8.53 × 10⁻³ μm4s−1, 7.86 × 10⁻³ μm4s−1) in associating with NKG2D in situ than both ULBP1 (4.35 × 10⁻⁴ μm4s−1) and ULBP3 (6.07 × 10⁻⁴ μm4s−1) (Fig 1D). In contrast, we did not observe significant differences among in situ force‐free off‐rates of these four ligands dissociating from NKG2D (Fig 1E). But the off‐rate for MICA (4.36 s−1) is almost 200 times faster than reported in‐solution off‐rate (0.023 s−1) (McFarland & Strong, 2003). Moreover, the difference of in‐solution affinities of NKG2D binding with these three ligands, either measured by SPR using E. coli‐derived proteins (McFarland & Strong, 2003) or measured by Bio‐Layer Interferometry (BLI) experiments using mammalian‐derived proteins (Fig EV1I–O), is less than two folds, while in situ binding affinities are much broader (over 20 folds), suggesting that they are more powerful to differentiate NKG2D ligand’s binding strength (Fig 1F). Taken together, these data provide a characterization of in situ force‐free kinetics for NKG2D interacting with different ligands, demonstrating much stronger binding kinetics of MICA and MICB interacting with NKG2D than ULBP family members, which are sensitive kinetic indicators for NKG2D ligand discrimination.
Figure 1. Characterization of in situ force‐free kinetics of NKG2D interacting with different ligands and comparison with in‐solution affinities.

-
ADiagrammatic sketch of in situ binding kinetic assay and functionalization of RBC.
-
BRepresentative adhesion frequency (P a) versus contact duration (t c) curves for NKG2D expressing NK cells (n ≥ 3) in contact with RBCs (n ≥ 3) coated with a ligand (MICA in red, MICB in orange, ULBP1 in green, or ULBP3 in blue) at different contact durations, fitted by a non‐linear in situ binding‐kinetic model (Huang et al, 2010). Site densities of NKG2D (m r) and its ligands (m l) are indicated.
-
C–EIn situ force‐free affinities (C), on‐rates (D), and off‐rates (E) of NKG2D binding with indicated ligands from mammalian cells. The in situ force‐free kinetics were obtained from fittings with an in situ binding‐kinetic model in (B).
-
FDetection range comparison in affinity measurement of NKG2D and indicated ligands between in situ and in‐solution assay. Bars in different colors are the ratios of the affinities of indicated ligands divided by that of ULBP1.
Data information: In‐solution affinities of proteins purified from E. coli were from previous study (McFarland & Strong, 2003). In‐solution affinities of proteins purified from mammalian cells were measured by BLI (Fig EV2A–G). Every dot in (C–E) represents one independent binding experiment. Error bars in (B‐E) are mean ± SEM for at least three independent biological experiments where *P < 0.05, **P < 0.01 (two‐tailed unpaired t‐test).
Source data are available online for this figure.
Figure EV1. Micrographs and NKG2D/ligands cite density determination of in situ binding affinity assay and in‐solution binding kinetics measurement by Biolayer interferometry (BLI).

-
APhotomicrographs of micropipette adhesion frequency assay in which NK cell controlled by a micropipette approach, contact, detach with RBC with/without adhesion as marked. Scale bars in (A) represent 5 μm.
-
B–GFlow cytometry analysis of NKG2D and ligands by specific antibodies along with four standard calibration beads (Gray histogram means isotype control, histogram of other colors means sample). NKG2D ligands purified from 293F cells were biotinylated linked to the membrane of SA‐coated human RBC cells. MICA‐linked (B), MICB‐linked (C), ULBP1‐linked (D), and ULBP3‐linked (E) RBC cells were incubated with PE‐labeled primary monoclonal antibodies and analyzed by flow cytometry. NK cells were incubated with PE‐labeled primary mAb of NKG2D and analyzed by flow cytometry (F). PE standard calibration beads were analyzed along with the isotype control for nonspecific binding (G).
-
HA calibration curve of log of PE molecules/bead (provided by the manufacturer) versus log of measured fluorescence intensity PE‐A was plotted based on data of four standard beads (filled circles). The site density of MICA on RBC was calculated by comparing the log of fluorescence intensity of the sample (open square) with the calibration curve after subtracting negative control fluorescence intensity.
-
I–OBLI binding curves of NKG2D receptor at serious concentrations with immobilized MICA (I), MICB (J), ULBP1 (K), and ULBP3 (L) and the corresponding binding affinities (M), on‐rates (N), and off‐rates (O) derived from BLI experiments. Concentrations of NKG2D were 200, 100, 50, 25 and 12.5 nM labeled from dark color to light color. Error bars in (M–O) represent mean ± SEM for biological triplicate experiments.
Correlation analysis of NK cell functions with in situ kinetics of NKG2D/ligand binding
Having characterized the in situ kinetics of NKG2D interacting with four different ligands, we next examined how these in situ binding kinetics correlated with their activation potencies in stimulating NKG2D‐dependent cytokine secretion from NK cells. We plated human NK cells on the substrate coated with one of three ligands (MICA, MICB, and ULBP3), collected the supernatants and quantified secreted IFN‐γ with CBA assays (See methods). We found that all three immobilized NKG2D ligands were able to stimulate NK cells to secrete IFN‐γ (Fig 2A and B), or to increase degranulation (Fig EV2A, C and E) and ERK phosphorylation (Fig EV2B, D and F), but soluble forms of these ligands failed to do so (Fig EV2G), indicating that immobilized ligands with physical anchoring to the substrate were more potent in activating NKG2D‐mediated NK functions. As physical anchoring results in loading mechanical force to the receptor‐ligand bond, these data further suggest that mechanical force may enhance receptor‐ligand binding and its resulted activation of immune cells (Le Saux et al, 2019).
Figure 2. Correlation analysis of NK cell functions with in situ force‐free kinetics of NKG2D binding with ligands.

-
A–CSchematic diagram (A) of IFN‐γ release assay and IFN‐γ production (B) by human peripheral NK cells stimulated with plate‐coated NKG2D ligands (MICA in red, MICB in green and ULBP3 in blue) assessed by Cytometric Bead Array, of which are their half‐maximal effective concentration (EC50) (C).
-
D–FPlots of reciprocals of EC50 versus the effective in situ affinities (A c K a) (D), the effective in situ on‐rate (A c K on) (E) and in situ off‐rate (k off) (F).
Data information: The IFN‐γ release assay in (B) was one representative experiment of three total independent experiments. Data points in (B) and bars in (C) represent mean values. Error bars in (B) and (C) represent mean ± SEM. ***P < 0.001, ****P < 0.0001 (two‐tailed unpaired t‐test).
Source data are available online for this figure.
Figure EV2. Surface CD107a and phosphorylation of ERK of NK cells stimulated by immobilized NKG2D ligands.

-
A, BFlow cytometry analysis of the percentages of CD107a+ (A) cells pERK+ cells (B) under stimulation of different NKG2D ligands (MICA in red, MICB in orange, ULBLP3 in blue) compared with SA negative control (gray).
-
C, DCorresponding quantification of percentages of CD107a+ cells and pERK+ NK cells in (A) and (B).
-
E, FPlots and Pearson correlation analysis of NKG2D ligands stimulated percentages of CD107a+ (E) and pERK+ (F) NK cells with their reciprocals of EC50 to release IFN‐γ.
-
GIFN‐γ release (one representative experiment of total three independent biological experiments) of periphery human NK cells under the stimulation of soluble NKG2D ligands at 100 nM.
Data information: Every dot in (C) and (D) represents one independent biological experiment. Data are mean ± SEM for biological triplicate experiments. *P < 0.05, **P < 0.01, ***P < 0.001, ****P < 0.0001 (two‐tailed unpaired t‐test).
We next characterized the activation potencies of these ligands by quantifying half‐maximal secretion of IFN‐γ (EC50) from NK cells stimulated by different ligands (See methods) (Fig 2C). Our results demonstrated that MICA (EC50 = 22.68 ± 0.74 nM) had a stronger ability to stimulate NK cell functions than MICB (EC50 = 44.4 ± 1.84 nM) and ULBP3 (EC50 = 92.49 ± 3.02 nM), consistent with previous reports that MICA induced stronger NKG2D’s downstream signaling than MICB and ULBP3 (Sutherland et al, 2002). Moreover, we found a moderate positive correlation of 1/EC50 with both in situ effective binding affinity (A c K a, r = 0.374) and in situ effective association rate (A c K on, r = 0.816) (Fig 2D and E) and a strong positive correlation of 1/EC50 with the force‐free in situ off‐rate (Fig 2F), which should be negative. We further found that in‐solution binding affinities were also not well correlated with these ligands’ potency. Together, these correlation analyses indicate that in situ affinities or association rates but not in situ or in‐solution force‐free off‐rates are better indicators to reflect ligand potency in stimulating NK cells.
Mechanical force differentially regulates NKG2D’s ligand dissociation and discrimination
We next examined whether and how mechanical force regulates the dissociation kinetics of NKG2D interacting with those ligands and whether they correlated better with their functional potencies. We applied single‐molecule biomechanical apparatus (biomembrane force probe, BFP) (Chen et al, 2008; Liu et al, 2014; An et al, 2020) (Fig EV3) to measure the force‐dependent bond lifetimes of NKG2D and ligands interactions without changing the force loading rate (Figs 3A–D, and EV3I–N, and Movies EV1 and EV2). We assessed the bond lifetimes of NKG2D respectively interacting with MICA, MICB, ULBP1, and ULBP3 at 5 pN, 10 pN, and 15 pN (Figs 3E and EV3H), and found that force differentially prolonged bond lifetimes of NKG2D interacting with different ligands. NKG2D binding with MICA at 10 pN has the longest bond lifetime, much longer than those of MICB, ULBP1, and ULBP3 (Fig 3E and F). We further investigated the bond lifetimes of NKG2D interacting with different ligands under the full force spectrum (Fig 3F). We revealed that MICA was the most responsive ligand to mechanical force and had the longest peak bond lifetime (0.975 ± 0.081s) with NKG2D at optimal force (10 pN) compared with MICB (0.317 ± 0.029s at 10 pN), ULBP1 (0.144 ± 0.023s at 6 pN), and ULBP3 (0.115 ± 0.016s at 8 pN) (Fig 3F). That is, compared with other ligands, MICA exhibits the most pronounced “catch‐slip” translational bond interacting with NKG2D (Fig 3F), indicating that mechanical force differentially regulates the NKG2D/ligand dissociation, which potentially enhances the discrimination power of NKG2D to precisely recognize different ligands.
Figure EV3. Experimental setup of BFP for detecting the interactions between NKG2D and different ligands.
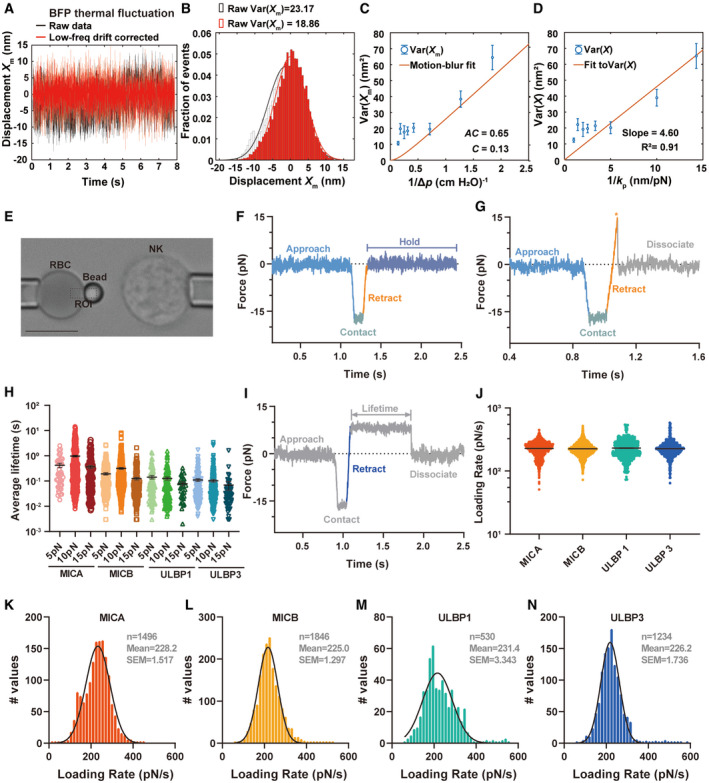
-
A, BRepresentative raw (black) and low‐frequency drift corrected (red) tracked displacements (X m) (A) and corresponding histograms and Gaussian fits (B) of BFP. The corrected variance Var(X m) was obtained from (A).
- C
- D
-
EPhotomicrograph of BFP. An NK cell and an RBC with a probe bead attached to its apex were aspirated by two opposing micropipettes respectively. The Region of Interest (ROI) for tracking the edge of the probe bead as shown in dashed lines.
-
F, GRepresentative force versus time curve for no adhesion (F) and force ramp (G).
-
HForce‐dependent bond lifetimes of NKG2D and various ligands at 5 pN, 10 pN, and 15 pN.
-
IIllustration of the retract phase (blue line, the slope of which is the loading rate) in an example event of BFP bond lifetime.
-
J–NScatter plot of loading rates (J) of NKG2D interacting with MICA (red, n = 1,499 bond lifetimes), MICB (orange, n = 1,847 bond lifetimes), ULBPL1 (green, n = 530 bond lifetimes), and ULBP3 (blue, n = 1,234 bond lifetimes) and their respective distributions and descriptive statistics for MICA (K), MICB (L) ULBP1 (M), and ULBP3 (N) interacting with NKG2D. The bond lifetimes are from at least 19 NK cell‐bead pairs of at least four independent biological experiments.
Data information: Every dot in (H) represents one bond lifetime of NKG2D binding with corresponding ligand from at least 19 NK cell‐bead pairs in at least 4 independent biological experiments. The scale bar in the picture represents 5 μm. Error bars in (C, D, H, and J) represent mean ± SEM for at least three independent biological experiments. P = 0.1410 between groups (one‐way ANOVA) in (J).
Figure 3. Mechanical force differentially regulates NKG2D’s ligand dissociation and discrimination.

-
A, BSchematic diagram (A) and experimental setup (B) of BFP assay to characterize force‐dependent dissociation kinetics of NKG2D binding with different ligands.
-
CVerification of the binding specificity of NKG2D with different ligands.
-
DRepresentative force versus time curve for measuring single NKG2D‐ligand bond lifetime.
-
E, FForce‐dependent bond lifetimes of NKG2D and various ligands at 5 pN, 10 pN and 15 pN (E) and full force spectrum (F).
-
GRatios of average bond lifetimes for NKG2D/MICA to that of NKG2D and other ligands.
Data information: Every dot in (C) represents the adhesion frequency of one cell‐bead pair and the experimental data came from at least two to three repeated trials. Bond lifetimes in (E) and (F) (in which n = 1,505 for MICA, n = 1,852 for MICB, n = 531 for ULBP1, n = 1,241 for ULBP3) of all ligands with NKG2D came from at least 19 NK cell‐bead pairs of at least four independent biological experiments. Horizontal lines in (C), bars in (E), and data points in (F) represent mean values. Error bars in (C), (E), and (F) represent mean ± SEM.
Source data are available online for this figure.
To investigate this speculation, we then further analyzed the differences in bond lifetimes of NKG2D interacting with four different ligands. The ratios of NKG2D‐MICA bond lifetimes to those of other ligands are all biphasically dependent on mechanical force application with maxima at 10 pN (Fig 3G), indicating that mechanical force can amplify their differences in ligand dissociation kinetics, especially at 10 pN force, the ratio for the strongest (MICA) to the weakest (ULBP3) becomes 8.8‐fold, much larger than that (1.45‐fold) at the zero‐force (Fig 1E). Thus, mechanical force not only substantially prolongs the bond lifetimes of NKG2D binding with ligands in a ligand‐dependent manner, but also increases the power of NKG2D receptor to discriminate these ligands.
Force‐induced allosteric regulation of NKG2D’s ligand dissociation and discrimination
Then, we examined the dynamic structural mechanism of mechanical enhanced binding of NKG2D with its ligands. We performed SMD (Steered Molecular Dynamics) simulations to detect the conformational changes of MICA or ULBP3 dissociating from NKG2D under force at the atomistic level. We revealed a dramatic conformational change in MICA but not ULBP3 when mechanical force was applied to the complex of NKG2D with MICA or ULBP3 at the force loading rate of both 7 pN/ns and 14 pN/ns (Figs 4A and B, and EV4A–D, and Movies EV3 and EV4). The force versus extension curves of NKG2D with MICA or ULBP3 (Fig 4C) showed two intermediate states for MICA but not ULBP3. Both intermediate states were mainly stabilized by force‐induced hydrogen bond (H‐bond) formation at the NKG2D‐MICA binding interface. This mechanical induction is activated by the force‐induced rotation of MICA α1α2 domain when NKG2D slides along the binding surface toward the α3 domain. Two loops (loop1: D15‐S17, loop2: I80‐G86) at α1 domain of MICA that are away from NKG2D in crystal structures became closer to NKG2D along with the conformational change of MICA. Comparing the binding interfaces between the loops of MICA or ULBP3 and NKG2D in the presence or absence of force, we found that force‐induced H‐bond formation between the side chains of D15, S17, and Q83 of MICA loop and K186, E183, N177, and T80 of NKG2D respectively (Fig 4A and D). In comparison, neither loop1 (P23‐Q27) nor loop2 (E91‐S96) of ULBP3 can be induced by force to form H‐bonds with NKG2D (Fig 4B and E). To investigate the dynamics of these force‐induced H‐bonds, we analyzed the changes of distances between residues D15, S17, Q83, and their respective interacting residues in NKG2D over time under force (Fig 4F). The results clearly show that the distances between residues D15, S17, Q83, and their respective interacting residues in NKG2D fluctuate during the force loading phase, but become closer enough to form H‐bonds in the late stage of simulations (Fig 4F). Collectively, these data suggest that the force‐induced H‐bonds likely affect the NKG2D‐MICA bond lifetimes under force.
Figure 4. Mechanical force‐induced allosteric regulation of NKG2D’s ligand dissociation and discrimination.

-
A, BSMD snapshots of NKG2D dissociation with MICA (A) and ULBP3 (B) in the presence of force (directions are indicated by black arrows).
-
CThe force versus extension curves from the simulations shown in (A) and (B). Occurrence of the sudden extension changes are indicated in the shaded area and time points correspond with the snapshots in (A) and (B) are marked.
-
D, EZoomed‐in binding interfaces of NKG2D with MICA (D) or ULBP3 (E), corresponding with the configuration (shown as gray dashed box in (A) and (B), respectively).
-
FDistance versus time curves for force‐induced H‐bond formation between indicated residues within NKG2D‐MICA binding interfaces. The dashed red lines represent H‐bonds whose distances are < 3.5 Å.
Source data are available online for this figure.
Figure EV4. Dissociation of ULBP3 and MICA mutants with NKG2D under mechanical force revealed by MD simulation.

-
A–DDistance versus time curves for force‐induced binding residues within NKG2D and loop1 (A) and loop2 (B) in α1 domain of MICA and loop1 (C) and loop2 (D) in α1 domain of ULBP3. A‐D showed the minimum distances between NKG2D and two loops in α1 domain of MICA or ULBP3 during dissociation under mechanical force.
-
E–ISMD snapshots of NKG2D dissociation with MICA 3A (E) and TAT mutants (F) in the absence or presence of force (directions are indicated by black arrows), their force versus extension curves (G), and their respective zoomed‐in (from gray dashed box and purple dashed box in (E) and (F), respectively) binding interfaces of NKG2D with MICA 3A (H) or TAT mutant (I). Extension transition points are indicated by circles in (G).
-
J, KDistance versus time curves for force‐induced binding residues within NKG2D‐MICA residue 15 of MICA 3A (J) or TAT mutant (K) binding interfaces. E‐K showed that MICA mutants weaken stability of the intermediate states during NKG2D dissociation with MICA 3A mutant and MICA TAT mutant. The similar intermediate states are found for NKG2D dissociation with MICA 3A and MICA TAT mutants compared to MICA WT; however, there is only one new H‐bond formation between NKG2D K186 and backbone oxygen atom of MICA mutants, compared to 2–3 H‐bonds for MICA WT.
To test this hypothesis, we next performed site‐mutagenesis and single‐molecule BFP experiments to verify the influence of force‐induced H‐bonds on force‐dependent NKG2D/MICA binding. We substituted D15, S17 and Q83 of MICA with alanine or threonine (MICA 3A and MICA TAT mutants) and quantified their force‐induced H‐bonds formation by MD simulations and force‐dependent bond lifetimes using BFP. We found that both 3A and TAT mutants formed fewer H‐bonds with NKG2D under mechanical force application (Fig EV4E–K) and that impaired NKG2D/MICA bond lifetimes (Fig 5A) and significantly suppressed NKG2D‐mediated NK cell activation (Fig 5B–E), demonstrating that mechanical force‐strengthened NKG2D/MICA binding is essential for NKG2D‐dependent NK cell activation.
Figure 5. Abolishments of force‐induced binding residues impair bond lifetime and function of MICA and NKG2D interaction.

-
A, BAbolishments of force‐induced binding residues by 3A mutations (MICA 3A, n = 526) and TAT mutations (MICA TAT, n = 580) impairs NKG2D’s catch bond with MICA WT (n = 1,505) (A) and IFN‐γ release (B).
-
C–EEC50 (C) and IFN‐γ release of NK cells stimulated by indicated MICA mutants at a concentration of 11 nM (D) and 22 nM (E).
Data information: Bond lifetimes in (A) of MICA WT and mutants with NKG2D came from at least 21 pairs of cells and beads of at least three repeated experiments. IFN‐γ release of NK cells in (B) was one representative experiment of three total independent experiments. Data points in (A) and (B), horizontal lines in (C), bars in (E), and data point in (F) represent mean values. Error bars in (A–E) represent mean ± SEM for biological triplicate experiments. **P < 0.01, ***P < 0.001, ****P < 0.0001 (two‐tailed unpaired t‐test).
Source data are available online for this figure.
Correlation analysis of in situ force‐dependent kinetics of NKG2D ligand bindings with ligand activation potencies in vitro
We next tried to elucidate the relationships of force‐dependent kinetics with ligand activation potencies. Although only moderate correlation of force‐free in situ binding affinity (Fig 2D and E), after taking mechanical forces into account, we found that the inverse of EC50 was much better than those of force‐free in situ and in‐solution k off in correlating with in situ force‐dependent k off under 5 pN, 10 pN, and 15 pN forces, as the Pearson coefficients of these correlations were −0.968, −0.898, and −0.945, respectively (Fig 6A–C).
Figure 6. Correlation analysis of NK cell functions with in situ force‐dependent kinetics of NKG2D binding with ligands.

-
A–CPlots and Pearson correlation analysis of reciprocals of EC50 versus the force‐dependent in situ k off at 5 pN (A), 10 pN (B) 15pN (C).
-
DHeatmap of force‐dependent in situ affinities A c K a of NKG2D binding with different ligands.
-
E–GPlots and Pearson correlation analysis of reciprocals of EC50 versus the force‐dependent effective in situ affinities A c K a at 5 pN (E), 10 pN (F), and 15 pN (G).
-
HComparison of corresponding Pearson coefficients between all NKG2D ligands in situ binding kinetics and ligand‐induced NK functions.
-
IDetection range comparison in force‐dependent affinity of NKG2D and indicated ligands under difference force. Bars in different colors are the ratios of the affinities of indicated ligands divided by that of ULBP1.
Source data are available online for this figure.
Considering the recognition of NKG2D ligands is initialized with receptor‐ligand association (on‐rate limited step) and further regulated by the engagement duration (i.e., off‐rate limited step), we combined in situ on‐rate and force‐dependent off‐rate to define as force‐dependent affinity (A c K a (F) = A c k on/k off (F)) (Fig 6D). We found that force‐dependent binding affinities perfectly correlated with ligand potencies (Fig 6E–G), as their Pearson correlation coefficients almost reach one (Fig 6H) (0.998, 0.998 and 0.999 at 5 pN, 10 pN, and 15 pN, respectively) and have the largest discrimination ability (the ratio of force‐dependent MICA affinity divided by that of ULBP1 reaches more than 150 times) (Fig 6I) compared with those at 0 pN force (the ratio of force‐free MICB affinity divided by that of ULBP1 reaches 22 times) (Fig 1F), suggesting that they are better indices of ligand potency than force‐free kinetic parameters, especially force‐free off‐rate (Fig 6H). Collectively, these data reveal that force‐free on‐rates and force‐dependent off‐rates are two major determinants for NKG2D‐mediated NK cell activation.
Mathematical modeling for force‐dependent kinetics in NKG2D Activation
To further investigate force‐dependent ligand discrimination and activation of NKG2D, we constructed a kinetic proofreading (KPR) model (Dushek et al, 2009) to simulate the activation of NKG2D by different ligands (i.e., MICA, MICB and ULBP3) (Fig 7A). In this model, we hypothesized that once NKG2D engaged with its ligands, its triggering was mainly dependent on their in situ on‐rate (k on‐initial), and the receptor‐ligand complex could undergo a series of forward and/or backward intermediate steps (e.g., phosphorylation and dephosphorylation by signaling molecules, fast rebinding or disassociating from the ligand) to finally produce productive signals, or immediately dissociate depending on in situ off‐rate kinetics k off (Fig 7A). We assumed quick rebinding of dissociated NKG2D and its ligands when in proximity and signal persistence even when they briefly dissociate (Anton van der Merwe et al, 2000; Dustin, 2004), as proposed in the kinetic proofreading model for T‐cell responses to antigen stimulation (Dushek et al, 2009). As these intermediate steps were complicated and had not been clearly understood, we also assumed a simplified version with the identical intermediate steps (the same forward rate constant k p and the same fully disassociation rate constant µ for all intermediate states). We rationalized that the mechanical force‐regulated NKG2D activation dominantly by force‐regulated k off. Considering the time scale of NK cell activation (Einspahr et al, 1991), we set 300 s as the ending time point for evaluating a steady output signal and used the probability of output signal to represent the levels of NK cell activation in simulation. We built ordinary differential equations (ODE) to simulate the dynamic responses of the target model (Methods), and investigated the potentially appropriate magnitudes of the non‐experimental parameters (such as μ, k on‐rebinding, and k p) affecting the production of active signals induced by different ligands. We finally selected steps as 10, μ as 10 s−1, k on‐rebinding as 10 s−1, and k p as 2 s−1 in the following simulations to achieve consistent simulated results with experimental observations for three ligands.
Figure 7. Kinetic proofreading model analysis of Force‐dependent ligand discrimination and amplification of NKG2D in mediating NK cell’s activation.
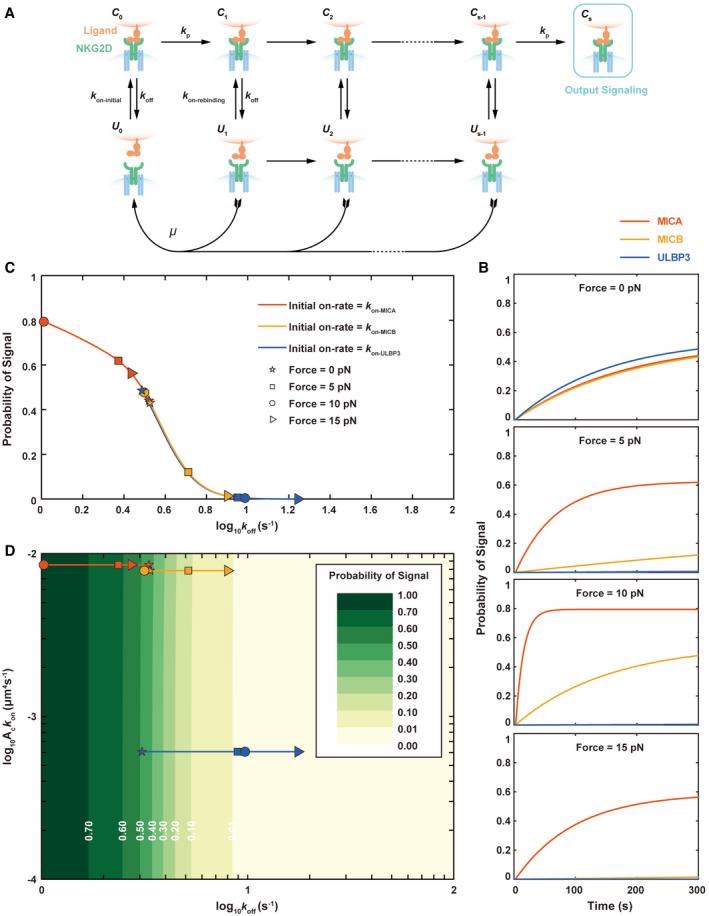
- Schematic diagram of NKG2D‐ligand combination and dissociation model. NKG2D binds and dissociates with multiple ligands at different initial on‐rates (k on‐initial) and off‐rates (k off). Ubiquitous mechanical forces in vivo regulate the disassociation of NKG2D and ligands.
- Probabilities of productive signals of different ligands binding with NKG2D when at forces of 0 pN, 5 pN, 10 pN, and 15 pN, respectively.
- Probabilities of output signals at 300s varied with force‐dependent off‐rates of the three ligands, MICA, MICB, and ULBP3. Off‐rates at different mechanical forces measured by experiments had been marked by specific symbols: pentagram, square, circle, and right‐pointing triangle represented off‐rates at 0 pN, 5 pN, 10 pN, and 15 pN, respectively.
- Contour plots showed probabilities of output signals at 300s produced by continuously variable initial on‐rates and force‐dependent off‐rates.
We then simulated the dynamic responses of output signal when NKG2D engaged with each ligand under different mechanical force loading. We found that the simulated responses triggered by three ligands under 0 pN force were indistinguishable as the probabilities of output signals all gradually increased to less than 0.5 (Fig 7B), indicating weak activation under 0 pN force for all these ligands. However, the ligand discrimination capability of NKG2D was greatly enhanced when force increases and reaches the highest level under 10 pN as three ligands (MICA, MICB and ULBP3) respectively induced strong, modest, and nearly no activation of NKG2D (Fig 7B). When force further increases to 15 pN, the discrimination capability of NKG2D, in contrast, drops back to the similar level as that under 5 pN (Fig 7B). Furthermore, we also observed force‐dependent amplification of NKG2D activation, particularly for the ligand MICA. Under 10 pN, the output signal triggered by MICA immediately reaches a plateau level, further confirming 10 pN is the optimal mechanical force for activating the NKG2D signaling.
We next applied comprehensive simulations of NKG2D activation with various real or pseudo ligands by dynamically changing the values of k on‐initial and k off (Fig 7C and D), onto which we mapped the activation potencies of MICA, MICB, and ULBP3 under different forces (Fig 7C). We found negligible differences of k on‐initial in shaping the dynamic responses triggered by three ligands. In contrast, three ligands occupied three distinct segments along the response curve as force regulates their k off differently (Fig 7D). At 0 pN, the responses of three ligands initiate to stay closely on the middle of the curve; as force increased, the responses of MICA moved along the curve toward the left part of the curve with strong NKG2D activation, while the responses of the other two ligands (MICB and ULBP3) moved mainly to the right part of the curve with weak or no activation, indicating two distinct force‐regulated NKG2D activation patterns. Different from ULBP3 whose responses monotonically moved toward the right, the responses of MICB mainly oscillated within the middle segment of the curve, indicating MICB is a relatively stronger ligand than ULBP3 in terms of NKG2D activation as observed in experiments.
Discussion
We establish a kinetic and dynamic structural model with mechano‐chemical coupled regulation in the ligand recognition and discrimination of NKG2D, and reveal that both spatial restriction by 2D plasma membrane and mechanical force together regulate NKG2D/ligand interactions, respectively promoting their association rate and prolonging their bond lifetimes. Specifically, mechanical force selectively induces conformational changes of MIC family to resist forced dissociation from NKG2D, amplifying NKG2D’s ligand discrimination. Integrating differential mechano‐enhancement of dissociation rates with in situ association rates of NKG2D/ligand binding establishes in situ force‐dependent binding affinities, which has a wider range than well‐accepted in‐solution binding kinetics and better predicts ligand potencies.
A dynamic structural model for NKG2D ligand recognition and discrimination
We provide a dynamic structural model of mechano‐chemical coupled regulation for NKG2D ligand recognition and discrimination. In our model, NKG2D recognizes and discriminates ligands mainly through two‐step regulation. The first‐step regulation is through 2D‐membrane restricted force‐free association of unbound receptor and ligand, which can be characterized by in situ force‐free binding kinetics (Huang et al, 2010). The second‐step regulation depends on the force‐regulated disassociation of NKG2D‐ligand complex. Once NKG2D and ligand bind, due to very tight local space between two approaching surfaces (Lever et al, 2014), they are very likely to rapidly rebind such that the second step becomes dominant in NKG2D’s ligand discrimination. In this process, through force‐induced ligand conformations, mechanical force selectively prolongs the duration of NKG2D binding with MIC family but not with ULBP family, potentiating ligand recognition and discrimination of NKG2D. The initial phase of force‐dependent two‐step ligand recognition of NKG2D is very similar to the "rigid adaptation" mechanism, while the dissociation phase is more like the "induced‐fit" mechanism but under mechanical force.
The dynamic structural model uncovers striking discrimination ability of human NKG2D receptor
The discrimination ability of human NKG2D receptors has been ignored for decades as all human NKG2D ligands are able to stimulate NK cells (Cosman et al, 2001; Sutherland et al, 2002). Moreover, “degenerate recognition” was observed and similar in‐solution binding affinities with human NKG2D were detected (McFarland & Strong, 2003). Our dynamic structural model reveals unexpected discrimination ability (as high as 150 times, Fig 6I) of human NKG2D receptor, which reminds us of TCR antigen recognition (Liu et al, 2014; Wu et al, 2019). In TCR antigen recognition, TCR obtains incredible discrimination ability through its complementarity determining regions (CDRs), and simultaneously uses the conformational changes of MHC induced by mechanical force to enhance its recognition ability (Liu et al, 2014; Wu et al, 2019). Although NKG2D does not contain the CDR loops of TCR, it also exploits mechanical force to selectively induce the conformational changes of the ligand to enhance its recognition ability. The ligands of NKG2D are homologous proteins of MHC, especially MICA and MICB, which have strong similarities with MHC in sequence and structure (Li et al, 2001). Mechanical force induces conformational changes in MHC and MHC‐like proteins to enhance the recognition ability of immune receptors (including stimulatory receptors and inhibitory receptors) may be a general mechanism for immune cells to regulate their own functions. This kind of regulatory mechanism allows them to maintain degenerate recognition while maintaining high ligand specificity at the same time.
However, it is worth noting that the ratio of NKG2D ligand binding kinetics (as high as 150 times, Fig 6I) and the ratio of NKG2D ligands‐induced functions (less than 10 times, Fig 2B and C) are not equal. This is because the ratios of binding kinetics are mainly based on force‐dependent affinity (A c K a (F) = A c k on/k off (F)) (Fig 6D) at the single‐molecule level, while the ratios of NKG2D ligands‐induced functions are based on integrative cell‐level response that involves both NKG2D and many other molecules. In addition, the output signal in the KPR model is scaled to represent the relative strength of ligands‐induced functions, not strictly equal to the absolute values measured by biological experiments. To be noted, the model does not take account of ligand concentration. That is, immune cells can also be activated when the concentration of stimulating ligands is very high, even though the output signal is close to zero in our mathematical model. Thus, both single‐molecule dynamics and mathematical models provide additional supporting evidence to better reveal the interactions between NKG2D and ligands and their relationships with ligand‐induced functions.
In situ force‐dependent affinity determines ligand potencies in activating NKG2D functions
We integrate force‐free association rate and force‐dependent dissociation rate to define as “force‐dependent affinity”. Compared with commonly accepted in‐solution kinetics (McFarland & Strong, 2003), in situ affinities measured both with and without force show stronger discrimination abilities (Fig 1). The force‐dependent affinities of NKG2D binding with its ligands serve as the best indicator in our study for ligands potencies to activate NKG2D functions (Fig 6). The huge differences in affinities of soluble and membrane‐anchored receptor‐ligand binding may be originated from the physical regulation of 2D plasma membrane restriction and inherent mechanical force originated from membrane tension, cytoskeleton contraction, or cell migration (Vogel & Sheetz, 2006; Zhu et al, 2019; Zhang et al, 2021). For cell membrane, lipids and rafts can restrict the free movement of NKG2D receptors in the orthogonal direction of cell membrane (Huang et al, 2010; Zhang et al, 2021). Besides, the adaptor molecule DAP10 forms a complex with NKG2D, which could affect the structural orientation and flexibility of the receptor ectodomain thereby affecting association and force‐dependent dissociation kinetics (Eleme et al, 2004; Endt et al, 2007; Call et al, 2010; Serrano‐Pertierra et al, 2014). As for mechanical force, it induces the conformational changes of ligands and thereby the formation of new interactions with NKG2D. Therefore, mechanical force has at least two roles simultaneously. One is to amplify the activation signal of ligands (especially MICA) by prolonging its bond lifetime with NKG2D, and the other is to provide an additional layer of regulation to discriminate different ligands. Thus, in situ force‐dependent kinetics provide stronger discrimination power than in‐solution kinetics for NKG2D to selectively recognize various ligands and activate NK functions.
The force‐enhanced ligand discrimination not only resolves the inconsistency between solution‐based binding kinetics and ligand activation potencies but also provides a reasonable explanation for avoiding unnecessary NKG2D activation as NKG2D inevitably encounters MIC family and ULBP family on normal cells and tissues (Eagle et al, 2009). For MICA, it is usually expressed on epithelial tissues with high risks of exposure to pathogens (such as gut epithelium and airway epithelial cells), MICA may provide stronger signals to alert the immune system to ensure that abnormal cells can be quickly eliminated at any time (Groh et al, 1996; Kraetzel et al, 2008). Although the expression of MICA can also be induced on T cells or bone marrow stromal cells, the lysis of these cells by NK cells has only been observed in vitro (Molinero et al, 2002, 2004; Ogasawara et al, 2005; Poggi et al, 2005) but not in vivo. It may be due to the much softer mechanical environment of blood and bone marrow compared to epithelial tissue. Even if T cells and bone marrow stromal cells express MICA in vivo, they could also be protected from the attack from NK cells due to the lack of proper mechanical force to help MICA fully activate NK cells. As for the ULBP family, regardless of their mechanical environment, they may provide a relatively weak signal which may desensitize NK cells and thereby tolerate normal tissues and cells. Together, in addition to biochemical regulation of NKG2D ligand expression, mechanical force provides faster and more precise regulation to trigger NKG2D‐mediated lymphocyte activation.
A potential mechanical‐regulated feedback loop of NKG2D‐mediated signaling and pathological significance
We speculate that a mechanical‐regulated feedback loop may exist to regulate NKG2D ligand binding and signaling. Indirect evidences have suggested that mechanical‐regulated feedback may play an important role in NK cell receptor‐ligand recognition and immune cell activation. For example, previous studies have shown that mechanical forces can potentiate the activation and killing of immune cells (Liu et al, 2014; Basu et al, 2016). The activation of NK cells through NKG2D‐ligand interaction has also been reported to be accompanied by cytoskeleton remodeling, mediated mainly by F‐actin (Brown et al, 2011, 2012). Dynamic cytoskeletal elements are the main force generators, which can load force onto cell surface receptors (Zhu et al, 2019) when they bind to their ligands expressed on the target cell. Therefore, a mechanical‐regulated feedback loop may exist to strengthen NKG2D‐ligand binding and signaling. This mechanical feedback loop may enhance the discrimination ability of NKG2D to precisely sense the mechanical properties of their environment.
As the mechanical force sensed by NKG2D can be affected by the mechanical properties of tissues and cells, pathological diseases that drastically change tissue stiffness, such as liver fibrosis/cirrhosis or HCC (Gao et al, 2008), may significantly impact the NKG2D ligand recognition and activation. Previous studies have revealed that tumor tissue becomes softer, while fibrotic/cirrhotic tissue becomes much stiffer (Tian et al, 2015). As NK cells are abundantly enriched in human liver tissues, NKG2D on NK cells has a protective role to prevent liver fibrosis and HCC (Armeanu et al, 2005; Radaeva et al, 2006; Kamimura et al, 2012; Mitra et al, 2014). It is probable that NKG2D on NK cells may lose or attenuate its function in stiffened fibrosis tissue or ultra‐soft tumor tissue (Armeanu et al, 2005; Radaeva et al, 2006; Gao et al, 2008). Indeed, through single‐cell analysis of NK cells in liver cirrhosis and HCC, we found that NK cells from stiff cirrhotic liver tissues and soft tumor tissues both exhibited functional impairment (Oppenheim et al, 2005; Ramachandran et al, 2019; Zhang et al, 2019) (Fig EV5). Moreover, it has been reported that the softness of tumor cells prevents cytotoxic immune cell killing (Liu et al, 2021) and the stiffening of tumor cells could enhance the immune cell killing sensitivity (Tello‐Lafoz et al, 2021). Accordingly, we speculate that the changes in mechanical properties of diseased tissues might inhibit NKG2D‐mediated NK or T‐cell activation. Thus, modulating the mechanical properties may provide additional benefits to boost the effects of immunotherapy.
Figure EV5. Stiffness alteration in liver disease and mechanical regulation of NK cell function.

-
AVolcano plot showing highly expressed genes in tumor infiltrated NK cells and NK cells from normal tissue. Each blue or red dot denotes an individual gene expressed in tumor or normal tissue and passed our P‐value and fold difference.
-
B, CPathway enrichment analysis of highly expressed genes in tumor tissue (B) and normal liver tissue (C). The top 8 statistics of pathways were displayed.
-
DVolcano plot showing highly expressed genes of NK cells in cirrhotic tissue and NK cells from healthy tissue. Each blue or red dot denotes an individual gene expressed in cirrhotic or healthy tissue and passed our P‐value and fold difference.
-
E, FPathway enrichment analysis of highly expressed genes in cirrhotic liver tissue (E) and normal liver tissue (F). The top 8 statistics of pathways were displayed.
-
G, HIFNG gene expression in tumor and normal liver tissue (G) or cirrhotic and healthy liver tissue (H). The scRNA‐seq data of NK cells in tumor and healthy liver tissues were downloaded with GSE140228 (http://www.ncbi.nlm.nih.gov/geo/query/acc.cgi?acc=GSE140228), and the scRNA‐seq data of NK cells in cirrhotic and healthy liver tissues were downloaded with GSE136103 (http://www.ncbi.nlm.nih.gov/geo/query/acc.cgi?acc=GSE136103). Error bars in (G and H) mean ± SEM for mRNA expression levels of over 100,000 human single cells from 5 healthy livers and 5 cirrhotic livers where ***P < 0.001 (two‐tailed unpaired t‐test).
Conclusions
The coupling of 2D physical restriction of plasma membrane and the mechanical force‐induced ligand conformational changes dynamically amplifies NKG2D ligand recognition and discrimination, providing a mechano‐chemical coupling mechanism for NKG2D to precisely discriminate its ligands to differentially activate NK or T‐cell functions and fulfill proper immune responses. The results suggest that modulating mechanical microenvironment may potentially be an approach to inspire the rationale design of NKG2D/ligand‐based immunotherapies and boost their effect.
Materials and Methods
Preparation of human NK cells
Human NK cells were expanded from peripheral blood mononuclear cells (PBMCs) of healthy donors ex vivo by using an artificial Antigen Presenting Cell (aAPC) engineered from K562 cell line (Fujisaki et al, 2009; Somanchi et al, 2011; Jong et al, 2017; Wang et al, 2019). Briefly, PBMCs are obtained by Ficoll gradient centrifugation according to the manufacturer’s protocol. Freshly isolated PBMCs were then co‐cultured with irradiated aAPCs (add irradiated aAPCs at Day 1 and Day 7) at 37°C and 5% CO2 in RPMI 1640 medium containing 100 U/ml recombinant human IL‐2 (200‐02, PeproTech Inc., USA), 100 U/ml penicillin, 100 µg/ml streptomycin (S110JV, BasalMedia, China), and 10% fetal bovine serum (10270‐106, Gibco, USA). The cells were centrifugated at 400×g for 5 min and half of the culture medium was replaced by fresh culture medium every 2 or 3 days. After 13–15 days’ expansion, NK cells were harvested stained with mouse anti‐human CD3 (555332.0, BD Biosciences, USA USA), mouse anti‐human CD56 (555516.0, BD Biosciences, USA), and mouse anti‐human NKG2D monoclonal antibody 5C6 (12‐5879‐42, eBioscience, USA) and 1D11 from eBioscience to determine the purity of NK cells by flow cytometry (CytoFLEX S, Beckman Coulter, USA). The expanded cells were kept for 2–3 weeks before use.
Expression and purification of NKG2D ligands
Soluble forms of the extracellular domains of MICA (Amino acids Glu1 through Lys276), MICB (Amino acids Glu1 through Lys274), ULBP1 (Amino acids Glu1 through Lys180), and ULBP3 (Amino acids Glu1 through Lys180) (Li et al, 2001; Steinle et al, 2001; McFarland & Strong, 2003) were expressed by 293F cells. The cDNA (MICA, HG12302‐G, Sino biological, China; MICB, HG10759‐M, Sino biological, China; ULBP1, G165669, Youbio, China; ULBP3, G122065, Youbio, China) fragments of the proteins mentioned above were cloned into a modified pHAGE (plasmid HIV‐1 Alex Gustavo George Enhanced) vector (a lentiviral vector based on an HIV‐1‐based backbone, kindly provided by Dr. Qiming Sun, Zhejiang University) containing a GGGGS linker, a ten‐residue polyhistidine tag for purification and an Avi tag for biotinylation at the C‐terminal site of the cDNA to be cloned in. In addition, an independent cDNA of ZsGreen was followed and separated by iRES (internal Ribosome Entry Site). All the plasmids were confirmed by sequencing (GenScript, China) and co‐transfected into 293T cells together with pMD2.G and psPAX2 (envelope plasmid and packaging plasmid, respectively, kindly provided by Dr. Qiming Sun, Zhejiang University). After being cultured at 37°C for 48 h, the supernatants containing virus were collected and filtered to infect 293F cells at 37°C for 72 h to obtain cell lines that can stably secrete respective soluble proteins. Finally, ZsGreen positive cells were sorted (FACS Aria II, BD Biosciences, USA) to improve the purity of the cell lines and the production of proteins. The cell lines were then cultured in a large scale in suspension at 37°C, 120 rpm for 3–5 days in SMM 293‐TI suspension culture medium (M293TI, Sino Biological, China), and the supernatants containing proteins were collected and condensed by using precise peristaltic pump (BT100‐2J/YZ2515x, LongerPump, China) and Vivaflow 200 Laboratory Cross Flow Cassette (VF20P0 or VF20P2, Sartorius, Germany) for protein purification. To exclude the formation of dimer/multimer and ensure the purity of proteins used for single‐molecule assays, all protein samples were firstly purified by HisSep Ni‐NTA Agarose Resin (20503ES60, Yeasen, China) and HiTrap Q HP 5 mL (17‐1154‐01, GE Healthcare, USA), then concentrated samples were biotinylated at the site of Avi tag by homemade BirA (at a final concentration of 1 μM) in PBS (pH7.4) containing 5 mM MgCl2,0.2 mM D‐biotin and 2 mM ATP for 60 min at 30°C. Finally, the proteins were purified by size exclusion chromatography Superdex 75 10/300 GL or Superdex 200 10/300 GL (17‐5174‐01 or 28‐9909‐44, GE Healthcare, USA) on ÄKTA pure chromatography system (GE Healthcare, USA) and identified by SDS/PAGE and flow cytometry (CytoFLEX S, Beckman Coulter, USA) with PE‐labeled specific monoclonal antibodies (mouse anti‐human MICA antibody, 12302‐MM04‐P, Sino Biological Inc. China; mouse anti‐human MICB antibody, 10759‐MM12‐P, Sino Biological Inc., China; mouse anti‐human ULBP1 antibody, FAB1380P, R&D Systems, USA; mouse anti‐human ULBP3 antibody, FAB1380P, R&D Systems, USA).
Preparation of biotinylated RBCs for BFP
Biotinylated and pressurized human RBC served as a sensitive force sensor with a bead attached to its apex as previously described (Chen et al, 2008; Huang et al, 2010; Liu et al, 2014; Le Saux et al, 2019). In brief, a drop of blood was collected from a healthy donor by fingerstick and washed three times at 587 × g (5424R, Eppendorf, Germany) for 2.5 min with Coating Buffer (aqueous carbonate/bicarbonate buffer contains 0.1 M NaHCO3, 0.1 M Na2CO3, pH 8.5, ~180 mOsm) to obtain RBCs. The washed RBCs were then covalently linked to Biotin‐PEG3500‐SGA (A5057, Jenkem, China), an amine‐reactive PEG‐biotin polymer by incubation for 30 min at a concentration of 1.5 mg/ml at room temperature (RT). Then, the biotinylated RBCs were pressurized by a series concentration of nystatin (N4014‐50MG, Sigma‐Aldrich, Germany) in N2 Buffer (38.8 mM NaCl, 265.2 mM KCl, 4.74 mM Na2HPO4, 0.94 mM KH2PO4, 27 mM sucrose; pH 7.2, ~600 mOsm) for 1 h at 4°C. The RBCs were washed three times with N2 Buffer prewarmed at 37°C and stored in 200 μl N2 Buffer supplemented with 1% BSA at 4°C for use.
BFP spring constant calibration
BFP spring constant was calibrated by using thermal fluctuation analysis as previously described (Chen et al, 2008; Ju & Zhu, 2017). Briefly, we perform a linear fit between experimental thermal fluctuations (Var(X))and the reciprocals of a series of spring constants (1/k ps) derived based on membrane mechanics according to Evans’ model (Evans et al, 1995) we used to investigate whether their relationship conforms to the thermal fluctuation analysis based on the equipartition theorem (Formula 1) (Chen et al, 2008).
| (1) |
where Var(X) is the variance of the thermally excited random displacements X of the force probe, k B is the Boltzmann constant, and T is the absolute temperature. According to the Evans’ model (Formula 2),
| (2) |
where R p, R 0, and R c are the respective radii of the micropipette lumen, the spherical portion of the aspirated RBC, and the circular contact area between the RBC and the probe bead. Δp is the aspiration pressure. We changed the k p values by changing Δp, and record the thermal fluctuation data under different k p values.
Coupling NKG2D ligands onto RBCs and glass beads
Biotinylated monomers of NKG2D ligands were coated onto the surfaces of RBCs and BFP beads by biotin‐streptavidin coupling (Chen et al, 2008; Le Saux et al, 2019). To prepare NKG2D ligands coated RBCs, RBCs washed with Coating Buffer were biotinylated using 0.35 mg/ml of Biotin‐PEG3500‐SGA (A5057, Jenkem, China) in Coating Buffer for 30 min at RT. The RBCs were then washed twice by using Coating Buffer and once by using Hepes Buffer (10 mM Hepes supplemented with about 144 mM NaCl, pH7.4, ~300 mOsm). Washed RBCs were incubated with 0.1 mg/ml tetrameric streptavidin (SA) (A610492, Sangon Biotech, China) in Hepes Buffer for 30 min at RT and washed three times with Hepes Buffer. Biotinylated NKG2D ligands monomers of series concentration were then incubated with SA‐coated RBCs for 1h at 4°C and finally resuspended in 200 μl Hepes Buffer supplemented with 1% BSA for use.
As for the preparation of NKG2D ligand‐coated glass beads (Le Saux et al, 2019), glass surfaces of borosilicate beads (9002, Duke Scientific corp. USA) were cleaned by boiling the beads in a mixture of ammonium hydroxide and hydrogen peroxide solution (mix 0.5 ml of 30% H2O2 with 9.5 ml dH2O and then add 2.5 ml conc. NH4OH) for 10 min. Cleaned beads were then treated with 2.5% mercapto‐propyl‐trimethoxysilane (M100619, Aladdin, China) in methanol supplemented with 3.7% H2O and 0.8% acetic acid for 3 h at RT. After that, the beads were washed with fresh methanol and dried to the walls of glass vials by dry argon. The vials were then heated in a drying oven at 120°C for 5 min to stabilize sulfhydryl with the caps loosely fitted. After heated, the vials were placed in a vacuum desiccator to remove the air and input dry argon into the vials after the vials return to normal temperature. Tighten the caps of the vials and store the beads in a cool dry place until use. The beads were functionalized with sulfhydryl and ready to react with maleimide. We resuspended and used the ‐SH anchored beads to react with streptavidin‐maleimide (s9415‐2mg, Sigma‐Aldrich, Germany) in PBS (pH = 6.8) overnight at RT. Beads functionalized by SA were then incubated with biotinylated NKG2D ligands at various concentrations for 30 min at RT in Hepes Buffer supplemented with 1% BSA for use. Beads were washed three times after each step.
Determination of molecular densities on the surfaces of NK cells and RBCs
Site densities of NKG2D on NK cells and NKG2D ligands on RBCs were measured via flow cytometry analysis and corresponding standard beads (Chesla et al, 1998; Huang et al, 2010; Le Saux et al, 2019). To measure the site densities of NKG2D receptor, NK cells were incubated with PE‐labeled mouse anti‐human NKG2D monoclonal antibody 5C6 (12‐5879‐42, eBioscience, USA) or isotype control at 2.5 μg/ml in 100 μl of FACS Buffer (DMEM, 5 mM EDTA and 1% BSA) at RT for 30 min. To measure the site densities of NKG2D ligands linked on the surfaces of RBCs via biotin‐streptavidin coupling, NKG2D ligand‐coated RBCs were incubated with monoclonal antibodies of PE‐conjugated NKG2D ligands (mouse anti‐human MICA antibody, 12302‐MM04‐P, Sino Biological Inc., China; mouse anti‐human MICB antibody, 10759‐MM12‐P, Sino Biological Inc., China; mouse anti‐human ULBP1 antibody, FAB1380P, R&D Systems, USA; mouse anti‐human ULBP3 antibody, FAB1380P, R&D Systems, USA) or isotype controls according to the manufacturer’s instructions in 100 μl of FACS Buffer (DMEM, 5 mM EDTA, and 1% BSA) at RT for 30 min. NK cells or RBCs incubated with corresponding antibodies were analyzed by a flow cytometer (CytoFLEX S, Beckman Coulter, USA) together with Quantibrite (340495.0, BD Biosciences, USA). The fluorescent intensities of NKG2D and ligands on NK cells and RBCs were compared to the standard curve of Quantibrite to obtain the total numbers of molecules per cell. The radius of NK cells and RBCs was taken as 3 and 5 μm, respectively. The site densities of NKG2D (m r) or ligands (m l) can be obtained by dividing the total numbers of molecules per cell by the surface areas of the corresponding cells.
Apparatuses of micropipette and BFP
The setups of micropipette and BFP based on an inverted microscope (Nikon TiE, Japan) have been described previously in detail (Chesla et al, 1998; Chen et al, 2008; Liu et al, 2014). Briefly, two opposing pipettes with suction pressures controlled by manometer systems were used in both apparatuses to control an NK cell (target) expressing NKG2D and a ligand‐presenting RBC (micropipette) or bead (BFP). Computer‐programmed cyclic contact and separation of NK cell and RBC/beads were finely controlled by a one‐dimensional (1D) piezoelectric translator (P‐753 LISA, Physic Instrument, Germany). Real‐time images of the experiments were captured by one CCD camera (GC1290, Allied Vision, Canada) at 30 frames per second (fps). In BFP, another high‐speed CCD camera (GE680, Allied Vision, Canada) recorded a well‐defined grayscale profile with a higher speed of 1,600 fps at the contact interface of RBC‐bead. The grayscale profile allowed a custom‐designed program implemented in LabView (National Instruments, USA) to track the axial position of the bead and displayed it real‐time on the computer. The BFP spring constant was regulated to 0.3 pN/nm by changing the suction pressure according to the radius of RBC measured at the beginning of experiment. Detailed force spectrums were thus obtained and displayed on computer according to the axial position of the bead and the spring constant of the BFP.
Micropipette adhesion frequency assay
2D kinetics of NKG2D receptor and ligands were measured by using micropipette adhesion frequency assay that has been reported previously (Chesla et al, 1998; Chen et al, 2008; Huang et al, 2010). Briefly, two opposing pipettes were applied to control contact and separation of an NK cell (target) with a ligand‐presenting RBC in isotonic chamber medium (DMEM supplemented with 1% BSA). Adhesion was detected by visual observation of the deflection of RBC membrane in each cycle. Adhesion frequencies (P a) at different contact times (t c) were obtained from 50 cyclically repeated contacts of pairs of cells. P a versus t c curves were fit to a probabilistic kinetic model (Formula 3) for receptor–ligand interaction.
| (3) |
where m r and m l are the densities of the receptor and ligand, respectively, A c K a is the effective in situ affinity under no force, k off is the in situ off‐rate under no force. A c K a and k off can be independently obtained by fitting the experimental data with the formula. The effective in situ on‐rate A c k on under no force was obtained from corresponding A c K a and k off according to the following formula (Formula 4):
| (4) |
The adhesion frequencies were all kept between 20 and 80% by adjusting the density of ligand coated on the RBC to ensure the accuracy of the estimated kinetics.
Force clamp assay of BFP
We used force‐clamp assay of BFP (Chen et al, 2008; Liu et al, 2014; Le Saux et al, 2019) to measure the bond lifetimes of NKG2D ligands under a series of forces at single‐molecule level. In brief, an NK cell captured by the target pipette was controlled by a customized program created by LabView (National Instruments, USA). The NK cell was driven to approach and contact the NKG2D ligand‐coated glass sphere for 0.1 s with a 20‐pN impingement force to allow the formation of a bond between NKG2D and the ligand. Then, the target pipette holding NK cell retracted at 1,000 pN/s to a preset force and clamped until bond rupture. A bond lifetime was exactly the duration of the clamped phase. After one cycle was finished, the target pipette and NK cell returned to the original position to start another cycle. The mean adhesion frequency was kept below 15% by adjusting the density of NKG2D ligand linked on the glass sphere to guarantee that most adhesion events were mediated by one single bond of NKG2D and ligand. All experiments were performed in isotonic chamber medium (DMEM supplemented with 1% BSA) at RT.
IFN‐γ release assay
IFN‐γ secretion of NK cells was measured by using human IFN‐γ Cytometric Bead Array assay (560111, BD Biosciences, USA) (Le Saux et al, 2019). To be brief, coat a 96‐well plate with 50 μg/ml SA at 37°C for 1 h, wash thoroughly with plenty of PBS, and use PBS supplemented with 1% BSA to block nonspecific binding. Coat serial concentrations of biotinylated NKG2D ligands at 37°C for 1 h. Then add 3 × 10⁵ NK cells in 200 μl culture medium (DMEM supplemented with 10% FBS, 100 mg/ml streptomycin, and 100 U/ml penicillin) to every well and culture the cells at 37°C in 5% CO2 for 16 h. Supernatants were harvested and analyzed to determine the concentrations of IFN‐γ according to the manufacturer’s instructions. The concentrations of NKG2D ligands and corresponding IFN‐γ concentrations were plotted and fit to a log (agonist) versus response curve with Prism GraphPad to calculate EC50 values.
Molecular dynamics simulations
Molecular dynamics (MD) simulations were performed based on the complex structures of NKG2D with MICA (PDB code: 1HYR (Li et al, 2001)) or ULBP3 (PDB code: 1KCG (Radaev et al, 2001)) by using NAMD2 package (Phillips et al, 2005). In brief, all‐atom models of NKG2D‐MICA or NKG2D‐ULBP3 complexes were established and water boxes and counterions were added for pre‐equilibration. Subsequently, 100‐ns production simulations were carried out. Representative snapshots of the production runs of each system were chosen for Steered Molecular Dynamics (SMD) simulations of force‐driven NKG2D/Ligand dissociation. External force was then applied to the complex and stretched at speeds of 0.1 nm/ns or 0.2 nm/ns respectively (loading rate was 7 pN/ns or 14 pN/ns, respectively), resulting in two kinds of different dissociation trajectories to analyze the structural changes in the processes of dissociation of the two complexes under force. To validate the key residues in process of NKG2D‐MICA dissociation, MICA 3A (D15A/S17A/ Q83A) and TAT (D15T/S17A/Q83T) mutants were obtained using VMD MUTATOR module based on NKG2D‐MICA crystal complex. The similar SMD simulations were performed to study the force‐driven NKG2D dissociation with both MICA mutants at a loading rate of 7 pN/ns. For each NKG2D/Ligand model, at least 3 SMD trajectories were generated to study their dissociations in presence of force. All simulation trajectories were analyzed using VMD (Humphrey et al, 1996). Snapshots of selected key frames were taken and analyzed in Chimera (UCSF) (Pettersen et al, 2004).
Mathematical modeling of NKG2D activation
Rebinding kinetic proofreading model was implemented with the ODEs as follows:
Step 0:
Step 1 ~s‐1:
Step s:
In the ODEs, A and B represented NKG2D and ligands were associated in a complex state or disassociated but still in proximity state, respectively. We supposed that ligands were initially in B 0 state and could bind NKG2D characterized by on‐rates (k on–initial) which were measured in aforementioned experiments. Once in bound state, the formed complex could dissociate at off‐rate (k off) to the proximity state (Bi ), which could subsequently rebind with persistent signal or directly return to the unmodified state (B 0 ) by fast dephosphorylations at rate µ. The probabilities of ligands in state As were considered as active signals.
Author contributions
WC, WY, and JL conceived this project, supervised the research, and revised the manuscript. JF performed experiments, wrote, and revised the corresponding part of the manuscript; JS built up the KPR model, wrote, and revised the corresponding part of the manuscript. JL and YZ performed Molecular Dynamics Simulations and revised the manuscript. JL analyzed single‐cell data. CA and HZ participated in micropipette experiments. RQ participated in BFP spring constant calibration. XS, YX, JX, and JZ cultured and provided NK cells. PW, WH, DY, ZT, XW, and WF provided suggestions for the research and revised the manuscript.
Supporting information
Expanded View Figures PDF
Movie EV1
Movie EV2
Movie EV3
Movie EV4
Source Data for Figure 1
Source Data for Figure 2
Source Data for Figure 3
Source Data for Figure 4
Source Data for Figure 5
Source Data for Figure 6
Acknowledgements
The authors thank Dr. Qiming Sun, Xun Zeng, and Jie Sun for kindly providing us reagents. This work was supported by grants from the National Science Foundation of China (31470900, 31522021, and 31971237 to W.C., 31600751 to W.Y., 32090044 and 11672317 to J.L., 11772348 to Y.Z., 12002307 to W.H.), the National Basic Research Program of China (2015CB910800 to W.C. and 2019YFA0707001 to J.L.), the Strategic Priority Research Program of the Chinese Academy of Sciences (XDB37020102 to J. L.), the Major Scientific Project of Zhejiang Province (2017C03028 to Weijia Fang), Natural Science Foundation of Zhejiang Province (LQ20H1600036 to Xue Wen), and Foundation for Zhejiang Medical and Health Science and Technology Project (2018KY376 to Xue Wen).
Conflict of interest
The authors declare that they have no conflict of interest.
The EMBO Journal (2022) 41: e107739
Contributor Information
Jizhong Lou, Email: jlou@ibp.ac.cn.
Weiwei Yin, Email: wwyin@zju.edu.cn.
Wei Chen, Email: jackweichen@zju.edu.cn.
Data availability
The RNA sequencing data used in this publication are from the NCBI Gene Expression Omnibus (GEO) database at Accession No. GSE140228 (http://www.ncbi.nlm.nih.gov/geo/query/acc.cgi?acc=GSE140228) and No. GSE136103 (http://www.ncbi.nlm.nih.gov/geo/query/acc.cgi?acc=GSE136103). There are no public datasets associated to the results in the paper.
References
- An C, Hu W, Gao J, Ju B‐F, Obeidy P, Zhao YC, Tu X, Fang W, Ju LA, Chen W (2020) Ultra‐stable biomembrane force probe for accurately determining slow dissociation kinetics of PD‐1 blockade antibodies on single living cells. Nano Lett 20: 5133–5140 [DOI] [PubMed] [Google Scholar]
- Anton van der Merwe P, Davis SJ, Shaw AS, Dustin ML (2000) Cytoskeletal polarization and redistribution of cell‐surface molecules during T cell antigen recognition. Semin Immunol 12: 5–21 [DOI] [PubMed] [Google Scholar]
- Armeanu S, Bitzer M, Lauer UM, Venturelli S, Pathil A, Krusch M, Kaiser S, Jobst J, Smirnow I, Wagner A et al (2005) Natural killer cell‐mediated lysis of hepatoma cells via specific induction of NKG2D ligands by the histone deacetylase inhibitor sodium valproate. Cancer Res 65: 6321–6329 [DOI] [PubMed] [Google Scholar]
- Balint S, Lopes FB, Davis DM (2018) A nanoscale reorganization of the IL‐15 receptor is triggered by NKG2D in a ligand‐dependent manner. Sci Signal 11: eaal3606 [DOI] [PMC free article] [PubMed] [Google Scholar]
- Basu R, Whitlock BM, Husson J, Le Floc’h A, Jin W, Oyler‐Yaniv A, Dotiwala F, Giannone G, Hivroz C, Biais N et al (2016) Cytotoxic T cells use mechanical force to potentiate target cell killing. Cell 165: 100–110 [DOI] [PMC free article] [PubMed] [Google Scholar]
- Bauer S, Groh V, Wu J, Steinle A, Phillips JH, Lanier LL, Spies T (1999) Activation of NK cells and T cells by NKG2D, a receptor for stress‐inducible MICA. Science 285: 727–729 [DOI] [PubMed] [Google Scholar]
- Billadeau DD, Upshaw JL, Schoon RA, Dick CJ, Leibson PJ (2003) NKG2D‐DAP10 triggers human NK cell‐mediated killing via a Syk‐independent regulatory pathway. Nat Immunol 4: 557–564 [DOI] [PubMed] [Google Scholar]
- Brown AC, Dobbie IM, Alakoskela JM, Davis I, Davis DM (2012) Super‐resolution imaging of remodeled synaptic actin reveals different synergies between NK cell receptors and integrins. Blood 120: 3729–3740 [DOI] [PMC free article] [PubMed] [Google Scholar]
- Brown ACN, Oddos S, Dobbie IM, Alakoskela J‐M, Parton RM, Eissmann P, Neil MAA, Dunsby C, French PMW, Davis I et al (2011) Remodelling of cortical actin where lytic granules dock at natural killer cell immune synapses revealed by super‐resolution microscopy. PLoS Biol 9: e1001152 [DOI] [PMC free article] [PubMed] [Google Scholar]
- Call ME, Wucherpfennig KW, Chou JJ (2010) The structural basis for intramembrane assembly of an activating immunoreceptor complex. Nat Immunol 11: 1023–1029 [DOI] [PMC free article] [PubMed] [Google Scholar]
- Chen W, Zarnitsyna VI, Sarangapani KK, Huang J, Zhu C (2008) Measuring receptor‐ligand binding kinetics on cell surfaces: from adhesion frequency to thermal fluctuation methods. Cell Mol Bioeng 1: 276–288 [DOI] [PMC free article] [PubMed] [Google Scholar]
- Chesla SE, Selvaraj P, Zhu C (1998) Measuring two‐dimensional receptor‐ligand binding kinetics by micropipette. Biophys J 75: 1553–1572 [DOI] [PMC free article] [PubMed] [Google Scholar]
- Cosman D, Mullberg J, Sutherland CL, Chin W, Armitage R, Fanslow W, Kubin M, Chalupny NJ (2001) ULBPs, novel MHC class I‐related molecules, bind to CMV glycoprotein UL16 and stimulate NK cytotoxicity through the NKG2D receptor. Immunity 14: 123–133 [DOI] [PubMed] [Google Scholar]
- Deguine J, Breart B, Lemaitre F, Di Santo JP, Bousso P (2010) Intravital imaging reveals distinct dynamics for natural killer and CD8(+) T cells during tumor regression. Immunity 33: 632–644 [DOI] [PubMed] [Google Scholar]
- Dhar P, Wu JD (2018) NKG2D and its ligands in cancer. Curr Opin Immunol 51: 55–61 [DOI] [PMC free article] [PubMed] [Google Scholar]
- Dunn C, Chalupny NJ, Sutherland CL, Dosch S, Sivakumar PV, Johnson DC, Cosman D (2003) Human cytomegalovirus glycoprotein UL16 causes intracellular sequestration of NKG2D ligands, protecting against natural killer cell cytotoxicity. J Exp Med 197: 1427–1439 [DOI] [PMC free article] [PubMed] [Google Scholar]
- Dushek O, Das R, Coombs D (2009) A role for rebinding in rapid and reliable T cell responses to antigen. Plos Comput Biol 5: e1000578 [DOI] [PMC free article] [PubMed] [Google Scholar]
- Dustin ML (2004) Stop and go traffic to tune T cell responses. Immunity 21: 305–314 [DOI] [PubMed] [Google Scholar]
- Eagle RA, Jafferji I, Barrow AD (2009) Beyond stressed self: evidence for NKG2D ligand expression on healthy cells. Curr Immunol Rev 5: 22–34 [DOI] [PMC free article] [PubMed] [Google Scholar]
- Einspahr KJ, Abraham RT, Binstadt BA, Uehara Y, Leibson PJ (1991) Tyrosine phosphorylation provides an early and requisite signal for the activation of natural killer cell cytotoxic function. Proc Natl Acad Sci USA 88: 6279–6283 [DOI] [PMC free article] [PubMed] [Google Scholar]
- Eleme K, Taner SB, Onfelt B, Collinson LM, McCann FE, Chalupny NJ, Cosman D, Hopkins C, Magee AI, Davis DM (2004) Cell surface organization of stress‐inducible proteins ULBP and MICA that stimulate human NK cells and T cells via NKG2D. J Exp Med 199: 1005–1010 [DOI] [PMC free article] [PubMed] [Google Scholar]
- Endt J, McCann FE, Almeida CR, Urlaub D, Leung R, Pende D, Davis DM, Watzl C (2007) Inhibitory receptor signals suppress ligation‐induced recruitment of NKG2D to GM1‐rich membrane domains at the human NK cell immune synapse. J Immunol 178: 5606–5611 [DOI] [PubMed] [Google Scholar]
- Evans E, Ritchie K, Merkel R (1995) Sensitive force technique to probe molecular adhesion and structural linkages at biological interfaces. Biophys J 68: 2580–2587 [DOI] [PMC free article] [PubMed] [Google Scholar]
- Fang L, Gong J, Wang Y, Liu R, Li Z, Wang Z, Zhang Y, Zhang C, Song C, Yang A et al (2014) MICA/B expression is inhibited by unfolded protein response and associated with poor prognosis in human hepatocellular carcinoma. J Exp Clin Cancer Res 33: 76 [DOI] [PMC free article] [PubMed] [Google Scholar]
- Fujisaki H, Kakuda H, Shimasaki N, Imai C, Ma J, Lockey T, Eldridge P, Leung WH, Campana D (2009) Expansion of highly cytotoxic human natural killer cells for cancer cell therapy. Cancer Res 69: 4010–4017 [DOI] [PMC free article] [PubMed] [Google Scholar]
- Gao B, Jeong WI, Tian Z (2008) Liver: An organ with predominant innate immunity. Hepatology 47: 729–736 [DOI] [PubMed] [Google Scholar]
- Gee MH, Han A, Lofgren SM, Beausang JF, Mendoza JL, Birnbaum ME, Bethune MT, Fischer S, Yang X, Gomez‐Eerland R et al (2018) Antigen identification for orphan T cell receptors expressed on tumor‐infiltrating lymphocytes. Cell 172: 549–563.e16 [DOI] [PMC free article] [PubMed] [Google Scholar]
- Groh V, Bahram S, Bauer S, Herman A, Beauchamp M, Spies T (1996) Cell stress‐regulated human major histocompatibility complex class I gene expressed in gastrointestinal epithelium. Proc Natl Acad Sci USA 93: 12445–12450 [DOI] [PMC free article] [PubMed] [Google Scholar]
- Hu W, Zhang Y, Sun X, Zhang T, Xu L, Xie H, Li Z, Liu W, Lou Ji, Chen W (2019) FcγRIIB‐I232T polymorphic change allosterically suppresses ligand binding. eLife 8 10.7554/elife.46689 [DOI] [PMC free article] [PubMed] [Google Scholar]
- Huang J, Zarnitsyna VI, Liu B, Edwards LJ, Jiang N, Evavold BD, Zhu C (2010) The kinetics of two‐dimensional TCR and pMHC interactions determine T‐cell responsiveness. Nature 464: 932–936 [DOI] [PMC free article] [PubMed] [Google Scholar]
- Humphrey W, Dalke A, Schulten K (1996) VMD: visual molecular dynamics. J Mol Graph 14: 33–38 [DOI] [PubMed] [Google Scholar]
- Jong AY, Wu CH, Li J, Sun J, Fabbri M, Wayne AS, Seeger RC (2017) Large‐scale isolation and cytotoxicity of extracellular vesicles derived from activated human natural killer cells. J Extracell Vesicles 6: 1294368 [DOI] [PMC free article] [PubMed] [Google Scholar]
- Ju L, Zhu C (2017) Benchmarks of biomembrane force probe spring constant models. Biophys J 113: 2842–2845 [DOI] [PMC free article] [PubMed] [Google Scholar]
- Kamimura H, Yamagiwa S, Tsuchiya A, Takamura M, Matsuda Y, Ohkoshi S, Inoue M, Wakai T, Shirai Y, Nomoto M et al (2012) Reduced NKG2D ligand expression in hepatocellular carcinoma correlates with early recurrence. J Hepatol 56: 381–388 [DOI] [PubMed] [Google Scholar]
- Kraetzel K, Stoelcker B, Eissner G, Multhoff G, Pfeifer M, Holler E, Schulz C (2008) NKG2D‐dependent effector function of bronchial epithelium‐activated alloreactive T‐cells. Eur Respir J 32: 563–570 [DOI] [PubMed] [Google Scholar]
- Lanier LL (2015) NKG2D receptor and its ligands in host defense. Cancer Immunol Res 3: 575–582 [DOI] [PMC free article] [PubMed] [Google Scholar]
- Le Saux G, Bar‐Hanin N, Edri A, Hadad U, Porgador A, Schvartzman M (2019) Nanoscale mechanosensing of natural killer cells is revealed by antigen‐functionalized nanowires. Adv Mater 31: e1805954 [DOI] [PubMed] [Google Scholar]
- Lever M, Maini PK, van der Merwe PA, Dushek O (2014) Phenotypic models of T cell activation. Nat Rev Immunol 14: 619–629 [DOI] [PubMed] [Google Scholar]
- Li K, Mandai M, Hamanishi J, Matsumura N, Suzuki A, Yagi H, Yamaguchi K, Baba T, Fujii S, Konishi I (2009) Clinical significance of the NKG2D ligands, MICA/B and ULBP2 in ovarian cancer: high expression of ULBP2 is an indicator of poor prognosis. Cancer Immunol Immunother 58: 641–652 [DOI] [PMC free article] [PubMed] [Google Scholar]
- Li P, Morris DL, Willcox BE, Steinle A, Spies T, Strong RK (2001) Complex structure of the activating immunoreceptor NKG2D and its MHC class I‐like ligand MICA. Nat Immunol 2: 443–451 [DOI] [PubMed] [Google Scholar]
- Liu B, Chen W, Evavold BD, Zhu C (2014) Accumulation of dynamic catch bonds between TCR and agonist peptide‐MHC triggers T cell signaling. Cell 157: 357–368 [DOI] [PMC free article] [PubMed] [Google Scholar]
- Liu Y, Zhang T, Zhang H, Li J, Zhou N, Fiskesund R, Chen J, Lv J, Ma J, Zhang H et al (2021) Cell softness prevents cytolytic T‐cell killing of tumor‐repopulating cells. Cancer Res 81: 476–488 [DOI] [PubMed] [Google Scholar]
- Margulies DH (2003) Molecular interactions: stiff or floppy (or somewhere in between?). Immunity 19: 772–774 [DOI] [PubMed] [Google Scholar]
- McFarland BJ, Kortemme T, Yu SF, Baker D, Strong RK (2003) Symmetry recognizing asymmetry: analysis of the interactions between the C‐type lectin‐like immunoreceptor NKG2D and MHC class I‐like ligands. Structure 11: 411–422 [DOI] [PubMed] [Google Scholar]
- McFarland BJ, Strong RK (2003) Thermodynamic analysis of degenerate recognition by the NKG2D immunoreceptor: not induced fit but rigid adaptation. Immunity 19: 803–812 [DOI] [PubMed] [Google Scholar]
- McGilvray RW, Eagle RA, Rolland P, Jafferji I, Trowsdale J, Durrant LG (2010) ULBP2 and RAET1E NKG2D ligands are independent predictors of poor prognosis in ovarian cancer patients. Int J Cancer 127: 1412–1420 [DOI] [PubMed] [Google Scholar]
- Mitra A, Satelli A, Yan J, Xia XQ, Gagea M, Hunter CA, Mishra L, Li SL (2014) IL‐30 (IL27p28) attenuates liver fibrosis through inducing NKG2D‐Rae1 interaction between NKT and activated hepatic stellate cells in mice. Hepatology 60: 2027–2039 [DOI] [PMC free article] [PubMed] [Google Scholar]
- Molinero LL, Fuertes MB, Rabinovich GA, Fainboim L, Zwirner NW (2002) Activation‐induced expression of MICA on T lymphocytes involves engagement of CD3 and CD28. J Leukoc Biol 71: 791–797 [PubMed] [Google Scholar]
- Molinero LL, Fuertes MB, Girart MV, Fainboim L, Rabinovich GA, Costas MA, Zwirner NW (2004) NF‐kappa B regulates expression of the MHC class I‐related chain A gene in activated T lymphocytes. J Immunol 173: 5583–5590 [DOI] [PubMed] [Google Scholar]
- Muller S, Zocher G, Steinle A, Stehle T (2010) Structure of the HCMV UL16‐MICB complex elucidates select binding of a viral immunoevasin to diverse NKG2D ligands. PLoS Pathog 6: e1000723 [DOI] [PMC free article] [PubMed] [Google Scholar]
- Ogasawara K, Benjamin J, Takaki R, Phillips JH, Lanier LL (2005) Function of NKG2D in natural killer cell‐mediated rejection of mouse bone marrow grafts. Nat Immunol 6: 938–945 [DOI] [PMC free article] [PubMed] [Google Scholar]
- Oppenheim DE, Roberts SJ, Clarke SL, Filler R, Lewis JM, Tigelaar RE, Girardi M, Hayday AC (2005) Sustained localized expression of ligand for the activating NKG2D receptor impairs natural cytotoxicity in vivo and reduces tumor immunosurveillance. Nat Immunol 6: 928–937 [DOI] [PubMed] [Google Scholar]
- Pettersen EF, Goddard TD, Huang CC, Couch GS, Greenblatt DM, Meng EC, Ferrin TE (2004) UCSF Chimera–a visualization system for exploratory research and analysis. J Comput Chem 25: 1605–1612 [DOI] [PubMed] [Google Scholar]
- Phillips JC, Braun R, Wang W, Gumbart J, Tajkhorshid E, Villa E, Chipot C, Skeel RD, Kale L, Schulten K (2005) Scalable molecular dynamics with NAMD. J Comput Chem 26: 1781–1802 [DOI] [PMC free article] [PubMed] [Google Scholar]
- Poggi A, Prevosto C, Massaro AM, Negrini S, Urbani S, Pierri I, Saccardi R, Gobbi M, Zocchi MR (2005) Interaction between human NK cells and bone marrow stromal cells induces NK cell triggering: role of NKp30 and NKG2D receptors. J Immunol 175: 6352–6360 [DOI] [PubMed] [Google Scholar]
- Radaev S, Kattah M, Zou Z, Colonna M, Sun PD (2002) Making sense of the diverse ligand recognition by NKG2D. J Immunol 169: 6279–6285 [DOI] [PubMed] [Google Scholar]
- Radaev S, Rostro B, Brooks AG, Colonna M, Sun PD (2001) Conformational plasticity revealed by the cocrystal structure of NKG2D and its class I MHC‐like ligand ULBP3. Immunity 15: 1039–1049 [DOI] [PubMed] [Google Scholar]
- Radaeva S, Sun R, Jaruga B, Nguyen VT, Tian Z, Gao B (2006) Natural killer cells ameliorate liver fibrosis by killing activated stellate cells in NKG2D‐dependent and tumor necrosis factor‐related apoptosis‐inducing ligand‐dependent manners. Gastroenterology 130: 435–452 [DOI] [PubMed] [Google Scholar]
- Ramachandran P, Dobie R, Wilson‐Kanamori JR, Dora EF, Henderson BEP, Luu NT, Portman JR, Matchett KP, Brice M, Marwick JA et al (2019) Resolving the fibrotic niche of human liver cirrhosis at single‐cell level. Nature 575: 512–518 [DOI] [PMC free article] [PubMed] [Google Scholar]
- Raulet DH, Gasser S, Gowen BG, Deng W, Jung H (2013) Regulation of ligands for the NKG2D activating receptor. Annu Rev Immunol 31: 413–441 [DOI] [PMC free article] [PubMed] [Google Scholar]
- Robinson J, Waller MJ, Fail SC, McWilliam H, Lopez R, Parham P, Marsh SG (2009) The IMGT/HLA database. Nucleic Acids Res 37: D1013–1017 [DOI] [PMC free article] [PubMed] [Google Scholar]
- Roy S, Barnes PF, Garg A, Wu S, Cosman D, Vankayalapati R (2008) NK cells lyse T regulatory cells that expand in response to an intracellular pathogen. J Immunol 180: 1729–1736 [DOI] [PubMed] [Google Scholar]
- Serrano‐Pertierra E, Cernuda‐Morollon E, Brdicka T, Hooejsi V, Lopez‐Larrea C (2014) L‐plastin is involved in NKG2D recruitment into lipid rafts and NKG2D‐mediated NK cell migration. J Leukoc Biol 96: 437–445 [DOI] [PMC free article] [PubMed] [Google Scholar]
- Somanchi SS, Senyukov VV, Denman CJ, Lee DA (2011) Expansion, purification, and functional assessment of human peripheral blood NK cells. J Vis Exp 48: 2540 [DOI] [PMC free article] [PubMed] [Google Scholar]
- Steinle A, Li P, Morris DL, Groh V, Lanier LL, Strong RK, Spies T (2001) Interactions of human NKG2D with its ligands MICA, MICB, and homologs of the mouse RAE‐1 protein family. Immunogenetics 53: 279–287 [DOI] [PubMed] [Google Scholar]
- Strong RK (2002) Asymmetric ligand recognition by the activating natural killer cell receptor NKG2D, a symmetric homodimer. Mol Immunol 38: 1029–1037 [DOI] [PubMed] [Google Scholar]
- Sutherland CL, Chalupny NJ, Schooley K, VandenBos T, Kubin M, Cosman D (2002) UL16‐binding proteins, novel MHC class I‐related proteins, bind to NKG2D and activate multiple signaling pathways in primary NK cells. J Immunol 168: 671–679 [DOI] [PubMed] [Google Scholar]
- Tello‐Lafoz M, Srpan K, Sanchez EE, Hu J, Remsik J, Romin Y, Calò A, Hoen D, Bhanot U, Morris L et al (2021) Cytotoxic lymphocytes target characteristic biophysical vulnerabilities in cancer. Immunity 54: 1037–1054.e7 [DOI] [PMC free article] [PubMed] [Google Scholar]
- Tian M, Li Y, Liu W, Jin L, Jiang X, Wang X, Ding Z, Peng Y, Zhou J, Fan J et al (2015) The nanomechanical signature of liver cancer tissues and its molecular origin. Nanoscale 7: 12998–13010 [DOI] [PubMed] [Google Scholar]
- Vogel V, Sheetz M (2006) Local force and geometry sensing regulate cell functions. Nat Rev Mol Cell Biol 7: 265–275 [DOI] [PubMed] [Google Scholar]
- Wang G, Hu W, Chen H, Shou X, Ye T, Xu Y (2019) Cocktail strategy based on NK cell‐derived exosomes and their biomimetic nanoparticles for dual tumor therapy. Cancers 11: 1560 [DOI] [PMC free article] [PubMed] [Google Scholar]
- Wang Z, Guan D, Wang S, Chai LYA, Xu S, Lam KP (2020) Glycolysis and oxidative phosphorylation play critical roles in natural killer cell receptor‐mediated natural killer cell functions. Front Immunol 11: 202 [DOI] [PMC free article] [PubMed] [Google Scholar]
- Wu J, Song Y, Bakker AB, Bauer S, Spies T, Lanier LL, Phillips JH (1999) An activating immunoreceptor complex formed by NKG2D and DAP10. Science 285: 730–732 [DOI] [PubMed] [Google Scholar]
- Wu P, Zhang T, Liu B, Fei P, Cui L, Qin R, Zhu H, Yao D, Martinez RJ, Hu W et al (2019) Mechano‐regulation of peptide‐MHC class I conformations determines TCR antigen recognition. Mol Cell 73: 1015–1027.e7 [DOI] [PMC free article] [PubMed] [Google Scholar]
- Xu B, Pizarro JC, Holmes MA, McBeth C, Groh V, Spies T, Strong RK (2011) Crystal structure of a gammadelta T‐cell receptor specific for the human MHC class I homolog MICA. Proc Natl Acad Sci USA 108: 2414–2419 [DOI] [PMC free article] [PubMed] [Google Scholar]
- Zhang Q, He Y, Luo N, Patel SJ, Han Y, Gao R, Modak M, Carotta S, Haslinger C, Kind D et al (2019) Landscape and dynamics of single immune cells in hepatocellular carcinoma. Cell 179: 829–845.e20 [DOI] [PubMed] [Google Scholar]
- Zhang T, Hu W, Chen W (2021) Plasma Membrane integrates biophysical and biochemical regulation to trigger immune receptor functions. Front Immunol 12: 613185 [DOI] [PMC free article] [PubMed] [Google Scholar]
- Zhu C, Chen W, Lou J, Rittase W, Li K (2019) Mechanosensing through immunoreceptors. Nat Immunol 20: 1269–1278 [DOI] [PMC free article] [PubMed] [Google Scholar]