Abstract
Objective:
To determine whether there is a correlation between body mass index (BMI), patient cooperation, and treatment success during multibracket (MB) appliance therapy.
Materials and Methods:
All adolescent MB patients started and finished between 2007 and 2010 were analyzed. The pretreatment BMI was calculated and negative file entries such as bad oral hygiene, missed appointments, and appliance breakage were recorded. According to the number of negative entries, cooperation was classified as good, bad, or poor. Additionally, the treatment duration and the number of appointments were recorded. For the evaluation of treatment success, the pretreatment and posttreatment PAR (peer assessment rating) scores were measured.
Results:
Of the 77 subjects, 61 had a normal BMI (79.2%) and 16 were considered overweight (20.8%). Whereas 51.7% of the normal-weight children had a good cooperation, only 25% of the overweight patients cooperated sufficiently. Consequently, the number of patients exhibiting bad or poor cooperation was higher in the overweight group (37.5% bad, 37.5% poor) than in the normal-weight group (30.6% bad, 17.7% poor). Patients with an increased BMI had a slightly longer treatment duration (21.4 months) and needed more appointments (19.9) than their normal-weight peers (18.9 months, 18.1 appointments). The PAR (peer assessment rating) score reduction, however, was comparable (normal BMI: 17.8 points, 64.0%; increased BMI: 15.2 points, 65.3%).
Conclusion:
In the present study, children with increased BMI did not cooperate as well during MB therapy as their normal-weight peers, but the treatment outcome was comparable in the two groups.
Keywords: Body Mass Index, Treatment outcome, Childhood overweight
INTRODUCTION
As observed in the daily press, overweight and obesity is increasingly becoming a problem in the economically developed world. This problem does not only affect adults, but to a dramatic extent, also children and adolescents. Today, it is assumed that 287 million school-age children worldwide are severely overweight,1 with a globally increasing tendency. The International Obesity Task Force describes that in 2004 about 14 million school children in the European Union were overweight, 3 million of these obese, and an additional 1% of the European children are becoming overweight each year.2 Data for the UK suggest that in 2002 22% of the boys and 28% of the girls aged 2–15 years were overweight or obese,3 also with an increasing tendency. The same becomes evident, when looking at the US data collected in the National Health and Nutrition Examination Survey. While only 4.6% of the American adolescents were overweight in 1963–1965, this number increased to 15.5% in 2000,4 and continued increasing to 17.1% in 2004 and 18.1% in 2008.5 The World Health Organization (WHO) regards childhood overweight as “one of the most serious public health challenges of the 21st century,”6 especially because the affected children are likely to stay overweight into adulthood.
A number of secondary problems, such as metabolic syndrome, hypertension, liver/gastrointestinal disease, type 2 diabetes, sleep apnea, hyperinsulinemia, hyperandrogenism/polycystic ovarian syndrome, social exclusion, or depression have been described for the overweight child.2,7–12 Additionally, orthopedic problems arise13 due to a greater strain on the joints as well as changes of bone metabolism and bone mineral density resulting from the increased body mass index.13–21
In general medicine, child obesity is a big issue and these children receive special medical attention. From the orthodontic perspective, however, overweight children have not been regarded. Whether or not the obese child needs special orthodontic care, due to perhaps a modified skeletal metabolism or because of increasingly observed psychosocial problems, is unclear.
Therefore, it was the aim of this pilot study to compare normal and overweight orthodontic patients treated with multibracket appliances to assess for differences concerning:
cooperation during treatment,
treatment duration,
number of appointments/missed appointments, and
treatment success (PAR (peer assessment rating) score reduction).
MATERIALS AND METHODS
Before starting, the study protocol was approved by the ethics committee of the University of Giessen (82/11). Beginning in August 2007 the weight and height of all patients were documented when the pretreatment records were taken. All children and adolescents, whose multibracket treatment was started and completed at the Orthodontic Department of the University of Giessen, Germany between 2007 and 2010 and of whom complete records were available, were analyzed. A total of 77 patients fulfilled these requirements. Their body mass index (BMI) was calculated according to the pretreatment data, and the patients were classified as normal weight (normal BMI) or overweight (higher BMI > 85th percentile) on the basis of the age-dependent scales of Coners et al.22
The cooperation during treatment was assessed using the patient records. According to the number of negative file entries (poor oral hygiene, insufficient wearing of elastics or headgear, appliance loosening, appliance breakages, loss of alastics, power chains or uprighting springs), cooperation was defined as “good” (0–1 negative entries), “bad” (2–4 negative entries), or “poor” (>5 negative entries). Additionally, the active treatment duration was calculated and the number of regular appointments, missed appointments, or additionally needed appointments was recorded. Treatment success was evaluated by assessment of the pretreatment and posttreatment PAR scores as measured on the dental models. The PAR score assessment was carried out twice by a calibrated (certified) observer, and the mean value was used for final analysis. Both the evaluation of the models and the examination of the patients' files were carried out in a blinded manner.
RESULTS
Of the 77 patients who fulfilled the requirements, 61 (79.2%) had a normal BMI, whereas 16 (20.8%) were overweight. In both groups, the number of boys was higher than the number of girls (normal BMI: 60% male, 40% female; increased BMI: 69% male, 31% female).
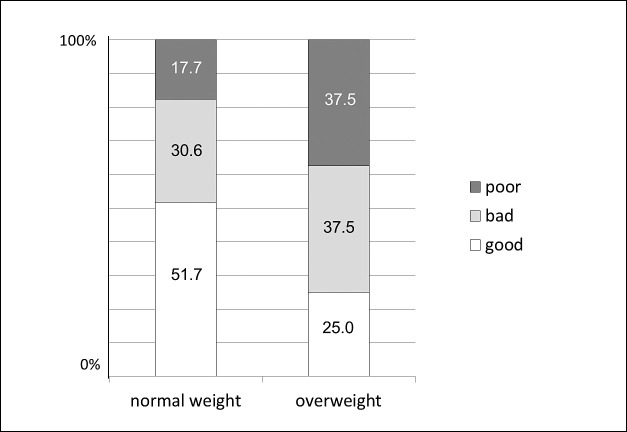
Whereas 51.7% of the normal-weight patients cooperated sufficiently, only 25.0% of the overweight patients exhibited an acceptable cooperation. Consequently, the number of patients with bad or poor cooperation was significantly higher in the overweight group than in the normal-weight group (Figure 1).
Figure 1.
Distribution of patient compliance in relation to body mass index (normal weight/overweight).
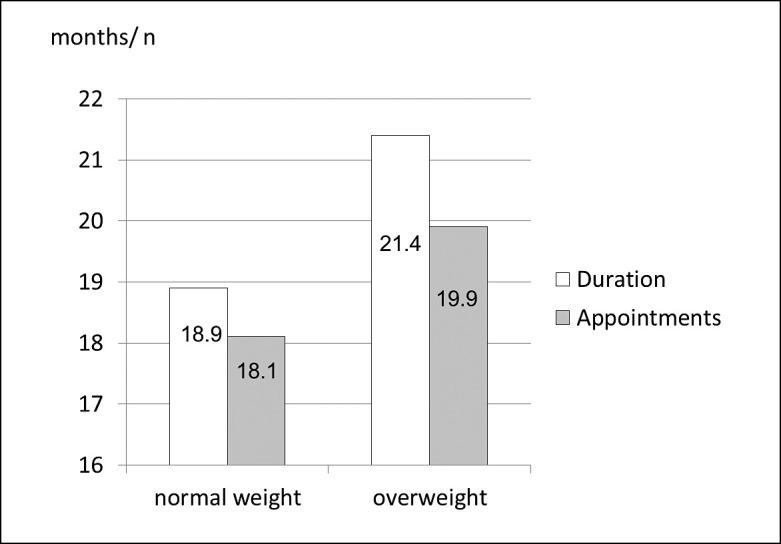
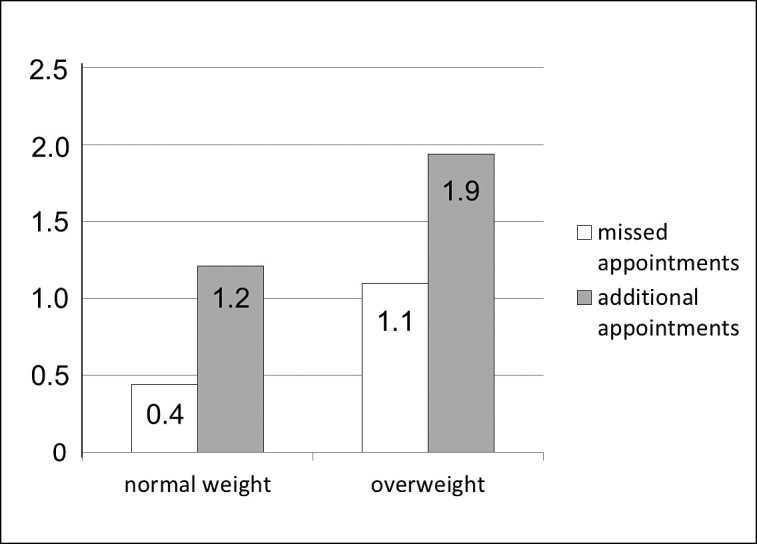
On average, the treatment of the overweight patients took slightly longer (21.4 months) and required more appointments (19.9) than that of the patients with a normal BMI (18.9 months, 18.1 appointments) (Figure 2). When looking at extraordinary appointments, it becomes evident, that overweight patients missed their appointment almost three times as often (1.1 appointments) as their normal-weight peers (0.4 appointments). Also, the number of extraordinary appointments due to appliance breakage was higher in the overweight group (1.9 appointments) than in the normal-weight group (1.2 appointments) (Figure 3).
Figure 2.

Distribution of treatment duration and number of appointments in relation to body mass index (normal weight/overweight).
Figure 3.

Distribution of missed and additional appointments (eg, due to appliance breakage) in relation to body mass index (normal weight/overweight).
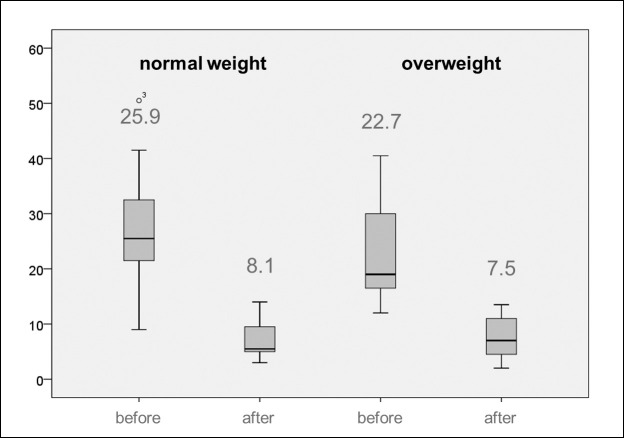
Concerning the PAR score reduction, it can be seen that equally good results could be reached for both groups (Figure 4). Whereas the normal-weight patients reached a mean PAR score reduction of 64.0% (17.8 points reduction; pretreatment 25.9, posttreatment 8.1), the patients with an increased BMI achieved a PAR score reduction of 65.3% (15.2 points reduction; pretreatment 22.7, posttreatment 7.5), with no relevant differences between the two groups.
Figure 4.
Distribution of pretreatment and posttreatment PAR scores in relation to body mass index (normal weight/overweight).
DISCUSSION
Within the limits of this study, there were no differences in treatment outcome between the two groups. However, it appears as if it takes more effort, time, and cost to reach equally good treatment results in the group with an increased BMI because the cooperation during treatment was not as good, and treatment took longer and required more appointments than in the normal-weight group. The reason for this longer treatment may be that these patients are more likely to have a restricted oropharyngeal and tend to exhibit tongue thrust or interference of a thick buccal mucosa, which makes treatment more difficult. Furthermore, in cases of extreme overweight, it is impossible for the orthodontist to work in a proper ergonomic chair position, once more resulting in a more difficult, time-consuming treatment. Additionally, the poor cooperation in the overweight group might explain the longer treatment time; on the other hand, however, it is also possible that changes in the bone metabolism due to the increased amount of adipose tissue influenced the orthodontic tooth movement.
Contradictory information concerning the effect of childhood overweight or obesity on bone mineral density is found in the literature. Some authors describe a positive influence of increased body mass resulting in increased bone mass or bone mineral density,23,24 which is explained by the fact that the bone simply adapts to the increased load it carries. If this were also true for the maxilla and mandible, it would imply that tooth movement might be slower in obese patients due to a stronger bone. Other authors, however, report the opposite.21,25,26 They found a loss of bone quality in overweight patients due to a change of hormone status, which could imply easier tooth movement. Also in growing rats, it could be verified that a high-fat diet had deleterious effects on bone parameters (decrease of bone mineral density, bone mineral content, and total skeleton area) compared to rats given a standard diet.27
To examine the influence of fat on bone more closely, the adipocyte hormones have to be considered. Among others, leptin and adiponectin are two protein hormones that are directly associated with the amount of adipose tissue. In obese patients, the blood levels of leptin are generally higher, and those of adiponectin generally lower compared to normal-weight patients.28 Leptin both directly and indirectly influences bone metabolism, causing a slower bone turnover. It has been shown to inhibit both bone formation29 and resorption through a reduced expression of RANK and RANK-ligand and an increased expression of osteoprotegerin.30,31 Additionally, the amount of leptin has been shown to be directly positively correlated to bone mineral density in prepubertal girls, where higher leptin levels were associated with a higher bone mineral density.25 Therefore, it seems obvious that overweight, which leads to an increase of the leptin level, might possibly imply slower tooth movement due to both the slower bone turnover rate and the higher bone mineral density.
Furthermore, it is known that overweight leads to lower adiponectin levels. Williams et al.32 analyzed the bone mass in adiponectin knockout mice and concluded that adiponectin stimulates osteoblast growth and inhibits osteoclastogenesis. Luo et al.33 also found adiponectin to modulate the osteoblast production of both RANKL and osteoprotegerin, which again would decrease osteoclastogenesis. Similar findings were reported by Oshima et al.34 Once more, for the orthodontist this might result in slower tooth movement.
Other factors that are being discussed are if a hyperinsulinemia, which is often associated with adiposity, causes decreased bone turnover rates, or if vitamin D might have an influence on bone regeneration due to its regulation of the calcium metabolism. Since obese children often exhibit a vitamin D deficiency,35 it is absolutely possible that this might be another cofactor for slower orthodontic tooth movement compared to normal-weight adolescents.
Maybe, however, things are a lot simpler, and it is not a matter of skeletal metabolism but merely a question of compliance why the treatment of obese children took longer. It has been shown that in Germany a strong correlation exists between socioeconomic status and overweight, suggesting the percentage of overweight children to be significantly higher among socially lower status families when compared to those with a higher status.36–38 The insufficient support from home could be the cause for the lack of compliance during orthodontic treatment. Also in other areas of medicine, the poorer compliance of patients with a lower social status has been described in relation to medication nonadherence.39–41
One aspect, which was not addressed in this study, is the general dental condition of the patients after treatment. Orthodontically, satisfactory results have been reached for both normal and overweight children. However, one aspect of patient cooperation were repeated file entries criticizing the oral hygiene, and it could well be that patients with an increased BMI had more gingival inflammation or more white spot lesions following fixed appliance therapy than their normal-weight peers. This aspect is currently being analyzed.
Another aspect that must be considered is that patients who fell into the group with an increased BMI were not necessarily as obese as to influence bone metabolism to an orthodontically relevant extent. The present study is limited, however, by a relatively small obesity sample size, in which only three individuals had extreme overweight, which, of course, is not enough for any statistical evaluation. These three, however, had a surprisingly long treatment duration with an extraordinary number of additional appointments. For future studies, it would be desirable to compare normal-weight adolescents to those with obesity.
CONCLUSION
Although there were no differences in PAR score reduction between normal-weight and overweight multibracket patients, patients with an increased BMI did not cooperate as well during treatment and had slightly longer treatment durations with more appointments than adolescents with a normal BMI.
REFERENCES
- 1.World Heart Federation. Childhood Obesity Think Tank. Available at: http://www.world-heart-federation.org/publications/heart-beat-e-newsletter/heart-beat-december-2006January-2007/in-this-issue/childhood-obesity-think-tank/ Accessed October 1, 2012. [Google Scholar]
- 2.Lobstein T, Baur L, Uauy R. Obesity in children and young people, a crisis in public health. Obes Rev. 2004;5:4–85. doi: 10.1111/j.1467-789X.2004.00133.x. [DOI] [PubMed] [Google Scholar]
- 3.British Medical Association. Preventing Childhood Obesity. 2005. London, UK: BMJ Publishing Group Ltd. [Google Scholar]
- 4.Ogden CL, Flegal KM, Carroll MD, Johnson CL. Prevalence and trends in overweight among US children and adolescents, 1999–2000. JAMA. 2002;288:1728–1732. doi: 10.1001/jama.288.14.1728. [DOI] [PubMed] [Google Scholar]
- 5.Ogden CL, Carroll MD, Curtin LR, Lamb MM, Flegal KM. Prevalence of high body mass index in US children and adolescents, 2007–2008. JAMA. 2010;303:242–249. doi: 10.1001/jama.2009.2012. [DOI] [PubMed] [Google Scholar]
- 6.World Health Organization. Available at: www.who.org Accessed March 3, 2012. [Google Scholar]
- 7.Neufeld ND, Raffel LJ, Landon C, Chen YD, Vadheim CM. Early presentation of type 2 diabetes in Mexican-American youth. Diabetes Care. 1998;21:80–86. doi: 10.2337/diacare.21.1.80. [DOI] [PubMed] [Google Scholar]
- 8.Must A, Strauss RS. Risks and consequences of childhood and adolescent obesity. Int J Obes Relat Metab Disord. 1999;23:2–11. doi: 10.1038/sj.ijo.0800852. [DOI] [PubMed] [Google Scholar]
- 9.Friedlander SL, Larkin EK, Rosen CL, Palermo TM, Redline S. Decreased quality of life associated with obesity in school-aged children. Arch Pediatr Adolesc Med. 2003;157:1206–1211. doi: 10.1001/archpedi.157.12.1206. [DOI] [PubMed] [Google Scholar]
- 10.Weiss R, Dziura J, Burgert TS, et al. Obesity and the metabolic syndrome in children and adolescents. N Engl J Med. 2004;350:2362–2374. doi: 10.1056/NEJMoa031049. [DOI] [PubMed] [Google Scholar]
- 11.Strass RS, Pollack HA. Social marginalization of overweight children. Arch Pediatr Adolesc Med. 2003;8:746–752. doi: 10.1001/archpedi.157.8.746. [DOI] [PubMed] [Google Scholar]
- 12.Abrams P, Levitt, Katz LE. Metabolic effects of obesity causing disease in childhood. Curr Opin Endocrinol Diabetes Obes. 2011;18:23–27. doi: 10.1097/MED.0b013e3283424b37. [DOI] [PubMed] [Google Scholar]
- 13.Goulding A, Jones IE, Taylor RW, Piggot JM, Taylor D. Dynamic and static tests of balance and postural sway in boys: effects of previous wrist bone fractures and high adiposity. Gait Posture. 2003;17:136–141. doi: 10.1016/s0966-6362(02)00161-3. [DOI] [PubMed] [Google Scholar]
- 14.Cobayashi F, Lopes LA, Taddei JA. Bone mineral density in overweight and obese adolescents. J Pediatr (Rio J) 2005;81:337–342. [PubMed] [Google Scholar]
- 15.Eliakim A, Nemet D, Wolach B. Quantitative ultrasound measurements of bone strength in obese children and adolescents. J Pediatr Endocrinol Metab. 2001;14:159–164. doi: 10.1515/jpem.2001.14.2.159. [DOI] [PubMed] [Google Scholar]
- 16.Afghani A, Goran MI. Lower bone mineral content in hypertensive compared with normotensive overweight Latino children and adolescents. Am J Hypertens. 2007;20:190–196. doi: 10.1016/j.amjhyper.2006.07.014. [DOI] [PMC free article] [PubMed] [Google Scholar]
- 17.Afghani A, Goran MI. Racial differences in the association of subcutaneous and visceral fat on bone mineral content in prepubertal children. Calcif Tissue Int. 2006;79:383–388. doi: 10.1007/s00223-006-0116-1. [DOI] [PubMed] [Google Scholar]
- 18.Farr JN, Funk JL, Chen Z, et al. Skeletal muscle fat content is inversely associated with bone strength in young girls. J Bone Miner Res. 2011;26:2217–2225. doi: 10.1002/jbmr.414. [DOI] [PMC free article] [PubMed] [Google Scholar]
- 19.Fricke O, Land C, Semler O, Tutlewski B, Stabrey A, Remer T, Schoenau E. Subcutaneous fat and body fat mass have different effects on bone development at the forearm in children and adolescents. Calcif Tissue Int. 2008;82:436–444. doi: 10.1007/s00223-008-9129-2. [DOI] [PubMed] [Google Scholar]
- 20.Hasanoğlu A, Bideci A, Cinaz P, Tümer L, Unal S. Bone mineral density in childhood obesity. J Pediatr Endocrinol Metab. 2000;13:307–311. doi: 10.1515/JPEM.2000.13.3.307. [DOI] [PubMed] [Google Scholar]
- 21.Janicka A, Wren TA, Sanchez MM, Dorey F, Kim PS, Mittelman SD, Gilsanz V. Fat mass is not beneficial to bone in adolescents and young adults. J Clin Endocrinol Metab. 2007;92:143–147. doi: 10.1210/jc.2006-0794. [DOI] [PubMed] [Google Scholar]
- 22.Coners H, Himmelmann GW, Hebebrand J, Hesker H, Remschmidt H, Schäfer H. Perzentilenkurven für den Body-Mass-Index zur Gewichtsbeurteilung. Kinderarzt. 1996;27:1002–1007. [Google Scholar]
- 23.Clark EM, Ness AR, Tobias JH. Adipose tissue stimulates bone growth in prepubertal children. J Clin Endocrinol Metab. 2006;91:2534–2541. doi: 10.1210/jc.2006-0332. [DOI] [PMC free article] [PubMed] [Google Scholar]
- 24.Leonard MB, Shults J, Wilson BA, Tershakovec AM, Zemel BS. Obesity during childhood and adolescence augments bone mass and bone dimensions. Am J Clin Nutr. 2004;80:514–523. doi: 10.1093/ajcn/80.2.514. [DOI] [PubMed] [Google Scholar]
- 25.Rhie YJ, Lee KH, Chung SC, Kim HS, Kim DH. Effects of body composition, leptin, and adiponectin on bone mineral density in prepubertal girls. J Korean Med Sci. 2010;25:1187–1190. doi: 10.3346/jkms.2010.25.8.1187. [DOI] [PMC free article] [PubMed] [Google Scholar]
- 26.Viljakainen HT, Pekkinen M, Saarnio E, Karp H, Lamberg-Allardt C, Mäkitie O. Dual effect of adipose tissue on bone health during growth. Bone. 2011;48:212–217. doi: 10.1016/j.bone.2010.09.022. [DOI] [PubMed] [Google Scholar]
- 27.Lac G, Cavalie H, Ebal E, Michaux O. Effects of a high fat diet on bone of growing rats. Correlations between visceral fat, adiponectin and bone mass density. Lipids Health Dis. 2008;28:7–16. doi: 10.1186/1476-511X-7-16. [DOI] [PMC free article] [PubMed] [Google Scholar]
- 28.Reid IR. Relationships between fat and bone. Osteoporos Int. 2008;19:595–606. doi: 10.1007/s00198-007-0492-z. [DOI] [PubMed] [Google Scholar]
- 29.Ducy P, Amling M, Takeda S, et al. Leptin inhibits bone formation through a hypothalamic relay: a central control of bone mass. Cell. 2000;100:197–207. doi: 10.1016/s0092-8674(00)81558-5. [DOI] [PubMed] [Google Scholar]
- 30.Holloway WR, Collier FM, Aitken CJ, et al. Leptin inhibits osteoclast generation. J Bone Miner Res. 2002;17:200–209. doi: 10.1359/jbmr.2002.17.2.200. [DOI] [PubMed] [Google Scholar]
- 31.Cornish J, Callon KE, Bava U, et al. Leptin directly regulates bone cell function in vitro and reduces bone fragility in vivo. J Endocrinol. 2002;175:405–415. doi: 10.1677/joe.0.1750405. [DOI] [PubMed] [Google Scholar]
- 32.Williams GA, Wang Y, Callon KE, et al. In vitro and in vivo effects of adiponectin on bone. Endocrinology. 2009;150:3603–3610. doi: 10.1210/en.2008-1639. [DOI] [PubMed] [Google Scholar]
- 33.Luo XH, Guo LJ, Xie H, Yuan LQ, Wu XP, Zhou HD, Liao EY. Adiponectin stimulates RANKL and inhibits OPG expression in human osteoblasts through the MAPK signaling pathway. J Bone Miner Res. 2006;21:1648–1656. doi: 10.1359/jbmr.060707. [DOI] [PubMed] [Google Scholar]
- 34.Oshima K, Nampei A, Matsuda M, Iwaki M, Fukuhara A, Hashimoto J, Yoshikawa H, Shimomura I. Adiponectin increases bone mass by suppressing osteoclast and activating osteoblast. Biochem Biophys Res Commun. 2005;331:520–526. doi: 10.1016/j.bbrc.2005.03.210. [DOI] [PubMed] [Google Scholar]
- 35.Rajakumar K, Fernstrom JD, Holick MF, Janosky JE, Greenspan SL. Vitamin D status and response to Vitamin D(3) in obese vs. non-obese African American children. Obesity (Silver Spring) 2008;16:90–95. doi: 10.1038/oby.2007.23. [DOI] [PubMed] [Google Scholar]
- 36.Langnäse K, Mast M, Müller MJ. Social class differences in overweight of prepubertal children in northwest Germany. Int J Obes Relat Metab Disord. 2002;26:566–572. doi: 10.1038/sj.ijo.0801956. [DOI] [PubMed] [Google Scholar]
- 37.Kleiser C, Schaffrath Rosario A, Mensink GB, Prinz-Langenohl R, Kurth BM. Potential determinants of obesity among children and adolescents in Germany: results from the cross-sectional KiGGS Study. BMC Public Health. 2009;9:46. doi: 10.1186/1471-2458-9-46. [DOI] [PMC free article] [PubMed] [Google Scholar]
- 38.Dannemann A, Ernert A, Rücker P, Babitsch B, Wiegand S. The influence of migration background and parental education on childhood obesity and the metabolic syndrome [in German] Bundesgesundheitsblatt Gesundheitsforschung Gesundheitsschutz. 2011;54:636–641. doi: 10.1007/s00103-011-1258-5. [DOI] [PubMed] [Google Scholar]
- 39.Fischer MA, Choudhry NK, Brill G, et al. Trouble getting started: predictors of primary medication nonadherence. Am J Med. 2011;124:1081.e9–e22. doi: 10.1016/j.amjmed.2011.05.028. [DOI] [PubMed] [Google Scholar]
- 40.Mujtaba SF, Masood T, Khalid D. Personal and social factors regarding medical non-compliance in cardiac failure patients. J Coll Physicians Surg Pak. 2011;21:659–661. [PubMed] [Google Scholar]
- 41.Westhoff CL, Torgal AT, Mayeda ER, Shimoni N, Stanczyk FZ, Pike MC. Predictors of noncompliance in an oral contraceptive clinical trial. Contraception. 2012;85:465–469. doi: 10.1016/j.contraception.2011.09.019. [DOI] [PubMed] [Google Scholar]


