

Abstract
Background:
The gut microbiome is important in modulating health in childhood. Metal exposures affect multiple health outcomes, but their ability to modify bacterial communities in children is poorly understood.
Objectives:
We assessed the associations of childhood and perinatal blood metal levels with childhood gut microbiome diversity, structure, species, gene family-inferred species, and potential pathway alterations.
Methods:
We assessed the gut microbiome using 16S rRNA gene amplicon sequencing and shotgun metagenomic sequencing in stools collected from 6- to 7-year-old children participating in the GESTation and Environment (GESTE) cohort study. We assessed blood metal concentrations [cadmium (Cd), manganese (Mn), mercury (Hg), lead (Pb), selenium (Se)] at two time points, namely, perinatal exposures at delivery () and childhood exposures at the 6- to 7-y follow-up (). We used multiple covariate-adjusted statistical models to determine microbiome associations with continuous blood metal levels, including linear regression (Shannon and Pielou alpha diversity indexes), permutational multivariate analysis of variance (adonis; beta diversity distance matrices), and multivariable association model (MaAsLin2; phylum, family, species, gene family-inferred species, and pathways).
Results:
Children’s blood Mn and Se significantly associated with microbiome phylum [e.g., Verrucomicrobiota (, ; , , respectively)] and children’s blood Mn significantly associated with family [e.g., Eggerthellaceae (, )]-level differences. Higher relative abundance of potential pathogens (e.g., Flavonifractor plautii), beneficial species (e.g., Bifidobacterium longum, Faecalibacterium prausnitzii), and both potentially pathogenic and beneficial species (e.g., Bacteriodes vulgatus, Eubacterium rectale) inferred from gene families were associated with higher childhood or perinatal blood Cd, Hg, and Pb (). We found significant negative associations between childhood blood Pb and acetylene degradation pathway abundance (). Finally, neither perinatal nor childhood metal concentrations were associated with children’s gut microbial inter- and intrasubject diversity.
Discussion:
Our findings suggest both long- and short-term associations between metal exposure and the childhood gut microbiome, with stronger associations observed with more recent exposure. Future epidemiologic analyses may elucidate whether the observed changes in the microbiome relate to children’s health. https://doi.org/10.1289/EHP9674
Introduction
Metals and essential elements, hereafter collectively referred to as “metals,” have been found to have impacts on children’s developmental health (Cao et al. 2014; Ghaisas et al. 2016; Zeng et al. 2016). The intestine is one of the most important organs to metabolize toxicants through the myriad of microbes present in it (Human Microbiome Project Consortium 2012). Intestinal microbiome diversity, structure, and functional potential are likely changed by toxicant exposure, but studies in humans, especially children, are scant. Previous studies have investigated the associations of metals, including cadmium (Cd) (Breton et al. 2013; He et al. 2020; Li et al. 2019), arsenic (Li et al. 2019), and lead (Pb) (Breton et al. 2013; Gao et al. 2017), with the mouse gut microbiome. Most metal-related human studies assessed exposure related to highly contaminated industrial sites (Shao and Zhu 2020) in populations that had a high prevalence of diseases (e.g., autism) (Zhai et al. 2019) or the neonatal gut microbiome (Laue et al. 2020b). However, many of these studies did not consider potential confounders or effect modifiers (Markle et al. 2013; Shao and Zhu 2020; Zhai et al. 2019), a major limitation in epidemiologic analyses that may engender spurious associations. For example, sex has been found to be one of the important effect modifiers in metal microbiome studies (Chi et al. 2016, 2017; Hoen et al. 2018). Limited data are available on the long-term influence of early life metal exposures on the pediatric microbiome (Zhai et al. 2019). Although long-read 16S rRNA gene amplicon sequencing can reveal species and strain level identification (Franzén et al. 2015; Santos et al. 2020), most current human studies on metal exposures have used only short reads (mostly V3–V4 regions) of 16S rRNA gene amplicon sequencing (Duan et al. 2020; Shao and Zhu 2020; Zhai et al. 2019), which are inadequate for investigating species-level associations and functional potential.
In the present study, we addressed these research gaps by investigating the associations of blood levels of five metals measured perinatally and during childhood with the 6- to 7-year-old children’s gut microbiomes in a healthy French-Canadian birth cohort. Specifically, this study aimed to a) assess the longitudinal and cross-sectional associations of children microbiome diversity and taxonomy profile with metal exposures using 16S rRNA gene sequencing and b) investigate the associations of metal exposures and childhood microbiome species, gene family-inferred species, and related potential functional pathways measured by shotgun metagenomic sequencing.
Methods
Study Population
This study was performed in the GESTation and Environment (GESTE) cohort in Sherbrooke, Quebec, Canada. Mothers were recruited at delivery or at their first prenatal care visit (with a subsequent delivery study visit) between 2007 and 2009. A graphic representation of the workflow can be found in Figure 1. At the 6- to 7-y follow-up study visit, a subgroup of children () provided stool samples for microbiome analysis. Of these 86, 68 had available blood metal levels from the same visit and 70 of their mothers had blood metals measured at delivery (Table 1). One sample had insufficient stool material for shotgun metagenomic sequencing, reducing the sample size to 67 children with childhood blood metals and 69 children with complete perinatal blood metals. The study population of the GESTE cohort is homogeneous in socioeconomic status and race/ethnicity, with most self-identifying as middle-class, White, French-Canadian (Serme-Gbedo et al. 2016). Parents signed informed and written consent forms at each follow-up. All study protocols were approved by the institutional review boards of the University of Sherbrooke, Harvard T.H. Chan School of Public Health, and Columbia University.
Figure 1.

Graphic representation of microbiome analysis workflow in the GESTation and Environment (GESTE) cohort in Sherbrooke, Quebec, Canada. Covariates: child exposure–child microbiome (): sex, family income, gestational age, and ever breastfed; perinatal exposure–child microbiome (): sex, family income, delivery mode, maternal BMI, pregnancy complications, and preexisting conditions. For gene family-inferred species association, protein features were mapped to UniRef90 database. Note: AAS, atomic absorption spectrophotometry; Cd, cadmium; Hg, mercury; ICP-MS, inductively coupled plasma mass spectrometry; Mn, manganese; , number of participants; , total number of associations examined; Pb, lead; Se, selenium.
Table 1.
Characteristics of GESTation and the environment (GESTE) cohort participants [, (%) or ] evaluated for this study.
| Exposures and Covariates | Child exposure–child microbiome () | Perinatal exposure–child microbiome ) |
|---|---|---|
| Cd (nmol/L) | 0.81 ()a | 2.20 ()a |
| Mn (nmol/L) | 186 () | 282 () |
| Hg (nmol/L) | 2.28 ()a | 3.54 ()a |
| Pb () | 0.041 () | 0.044 () |
| Se () | 2.03 () | 2.13 () |
| Sex | ||
| Female | 33 (48.5) | 33 (47.1) |
| Male | 35 (51.5) | 37 (52.9) |
| Family income | 91,300 ()b | 72,100 ()c |
| Gestational age | 39.3 () | 39.3 () |
| Ever breastfed | ||
| Yes | 62 (91.2) | 64 (91.4) |
| No | 6 (8.8) | 6 (8.6) |
| Delivery mode | ||
| Vaginal | 53 (77.9) | 53 (75.7) |
| Caesarean | 15 (22.1) | 17 (24.3) |
| Perinatal BMI | 26.5 () | 25.7 () |
| Pregnancy complicationsd | ||
| Yes | 6 (8.8) | 8 (11.4) |
| No | 62 (91.2) | 62 (88.6) |
| Preexisting conditionse | ||
| Yes | 25 (36.8) | 30 (42.9) |
| No | 43 (63.2) | 40 (57.1) |
Note: The GESTE cohort is in Sherbrooke, Quebec, Canada. Mothers were recruited at delivery or their first prenatal care visit between 2007 and 2009. At the year 6–7 study visit, of 365 mother–children pairs, a subgroup of children provided stool samples for microbiome analysis. BMI, body mass index; Cd, cadmium; Hg, mercury; LOD, limit of detection; Mn, manganese; Pb, lead; SD, standard deviation; Se, selenium.
The concentration of Cd and Hg below the LOD was imputed as the LOD divided by the square root of 2.
Family income at the 6- to 7-y postnatal follow-up, Canadian dollars.
Family income at delivery, Canadian dollars.
Pregnancy complications: gestational diabetes or preeclampsia.
Preexisting conditions: asthma, allergies, high blood pressure, thyroid disease, group B streptococcus infection, and type 1 or 2 diabetes.
Metal Measurement
Blood was collected from mothers at delivery and children at the 6- to 7-y follow-up. All metal analyses were performed at the Quebec Center of Toxicology of the Quebec Institute for Public Health, Quebec, Canada. Total blood mercury (Hg) was analyzed by cold vapor atomic absorption spectrophotometry (CVAAS) using a model 100 Hg monitor (Pharmacia Instruments). Total blood Pb, manganese (Mn), Cd, and selenium (Se) were measured using inductively coupled plasma mass spectrometry (ICP-MS) (Thermo Fisher Scientific). The limit of detection (LOD) was set at three times the standard deviation from 10 consecutive measurements of a representative sample. For the perinatal blood metals, the LODs for Hg, Pb, Mn, Cd, and Se were , , , , and , respectively. Childhood blood metals had LODs of (Pb), (Mn), and (Se). Metals in children’s blood were measured in two batches, resulting in two different LODs for Hg ( or ) and Cd ( or ). The population characteristics and blood metal concentrations are reported in Table 1 and Table S1.
DNA Extraction and Sequencing
Children were assisted by parents for stool collection as previously described (Laue et al. 2019). Briefly, the child excreted feces into a compostable receptacle nested in their toilet and parents then transferred a feces sample into a sterile glass vial using a wooden tongue depressor while wearing gloves. Stools were immediately stored in the household freezer until staff picked them up within 48 h. Stools were then placed in a laboratory freezer until extraction.
DNA from children’s stool samples was extracted in 2018 using the QIAamp DNA Fast DNA Stool Mini Kit (Qiagen) following the manufacturer’s protocol with additional bead beating in the lysis buffer (Laue et al. 2019; Yuan et al. 2012). Stool bacterial microbiome was measured using 16S rRNA gene amplicon sequencing at the New York University Langone Genome Technology Center (New York, New York). All DNA samples were normalized to in , amplified, and used for library preparation. We amplified the 16S rRNA gene V4 hypervariable region with previously validated Illumina dual-indexed compatible primers 515F/806R (Apprill et al. 2015; Caporaso et al. 2011; Parada et al. 2016). After quantification, the amplicon pool was loaded into an Illumina MiSeq flow cell in a paired-end format. Raw data were output as individual fastq files.
DNA from the same participants’ stool samples was extracted in 2020 using the QIAamp PowerFecal Pro kit following the manufacturer’s protocol (Qiagen). DNA samples () were normalized and sent to the New York University Langone Genome Technology Center for shotgun metagenomic sequencing. The library was first pooled using Illumina Flex library preparation and then loaded to Illumina NovaSeq 6000 flowcell S2, paired-end format for sequencing.
Covariates
Covariate data were collected from questionnaires given at delivery and at the 6- to 7-y postnatal follow-up. Potential confounding factors [maternal age, child age, gestational age, delivery mode, perinatal body mass index (BMI) at delivery, child BMI, family income at delivery, family income at the 6- to 7-y follow-up, child sex, breastfeeding practices, special school, family proximity to industry, pregnancy complications, preexisting conditions, child prescription medication, child dietary supplement, child food intolerance, and child digestion issues] were first independently screened for association with alpha diversity using linear regression (Tables S2 and S3) with . Covariates were then selected for inclusion in multivariable analysis either a priori or because of significant association with alpha diversity. In the analysis based on the children’s blood metal data, covariates used in multivariable analysis included child sex, family income at the 6- to 7-y follow-up (continuous), gestational age (continuous), and ever breastfed (yes/no) (Cioffi et al. 2020; Laue et al. 2019, 2020a; Min et al. 2019; Thion et al. 2018), with ever breastfed selected from covariates screening. In the analysis based on perinatal blood metal data, covariates included child sex, family income at delivery (continuous), delivery mode (vaginal or cesarean), perinatal BMI (continuous), pregnancy complications (yes or no), and preexisting conditions (yes or no) (Laue et al. 2020a; Min et al. 2019; Mitchell et al. 2020; Thion et al. 2018; Vujkovic-Cvijin et al. 2020). Missing income data in either analyses were imputed with the nonmissing income either at delivery or the year 6–7 follow-up. Mothers clinically diagnosed with at least one of either gestational diabetes or preeclampsia (extracted from medical records) were classified as having pregnancy complications. Perinatal preexisting conditions included clinical diagnosis at any time before delivery with one or more of the following diseases: asthma, allergies, high blood pressure, thyroid disease, group B Streptococcus infection, and type 1 or 2 diabetes (extracted from medical records).
Data Analyses
16S rRNA gene amplicon sequencing.
The raw 16S rRNA fastq.gz data were preprocessed using Trimmomatic to remove adapters and poor quality start and end reads (Bolger et al. 2014). The trimmed data were then quality checked using fastqc and analyzed through QIIME2 pipeline (version 2020.6) (Andrews 2010; Bolyen et al. 2019; Ewels et al. 2016). Briefly, the data set was first demultiplexed and run through DADA2 to denoise and remove chimeric sequences. Next, to obtain a representative sequence, the feature table was calculated and mapped to match feature identifier to sequences. Afterward, the representative sequence was trained using an unsupervised machine learning method to cluster through Silva (version 138) reference database (Quast et al. 2013). We selected a 99% similarity threshold for operational taxonomic unit (OTU) picking to determine taxonomy composition. After quality control, the average sequencing depth was approximately 155,000 reads per sample.
Shotgun metagenomic sequencing.
After preprocessing raw sequences ( reads per sample) with Trimmomatic, the average sequencing depth was reads per sample (Bolger et al. 2014). Raw data were then quality checked using fastqc and multiqc (Andrews 2010; Ewels et al. 2016). We then used Bowtie2, version 2.4.2 (Johns Hopkins University) to remove host reads aligned with National Center for Biotechnology Information Homo sapiens GRCh 38 no-alt analysis genome (Langmead and Salzberg 2012). The average host contamination was 0.06%. The remaining reads were then input to HUMAnN 3.0 (alpha) for functional profiling (Franzosa et al. 2018). Briefly, HUMAnN 3.0 performs a three-tiered search, taxonomic prescreen, pangenome search, and translated search (Franzosa et al. 2018). We obtained gene family, pathway abundance, and pathway coverage table from raw HUMAnN 3.0 (alpha) pipeline output. We also obtained the Metagenomic Phylogenetic Analysis (MetaPhlAn) species relative abundance table. Gene families are groups of evolutionarily related protein-coding sequences that often perform similar functions (Franzosa et al. 2018). Gene families were grouped to MetaCyc pathways and unrelated pathways (i.e., eukaryote pathways) were removed (Franzosa et al. 2018). The gene family table with species classification was collapsed to UniRef90 protein database features (Franzosa et al. 2018). Each gene family (protein) feature was broken down into individual species contribution (Franzosa et al. 2018). We hereafter refer to this process as gene family-inferred species association screening.
Statistical analyses.
The concentration of metals below the LOD was imputed as the LOD divided by the square root of 2 (Hornung and Reed 1990). All analyses involved multiple comparisons, thus a false discovery rate (FDR) cutoff -value of 0.1 was applied to define associations as noteworthy. Linear regression diagnostics were performed in each alpha diversity association to examine model fitness and in each significant multivariable association model (MaAsLin2) association to find potential outliers. The raw OTU table and participants metadata were first turned into a phyloseq object (McMurdie and Holmes 2013) in R (version 4.0.2; R Development Core Team).
Alpha and beta diversity, taxa (phylum and family) associations were computed from 16S rRNA gene amplicon sequencing data (Figure 1). Species, gene family-inferred species, and pathway associations were computed from shotgun metagenomic data (Figure 1). Alpha (within-subject) diversity, including Shannon (richness and evenness) and Pielou (evenness), was calculated using the phyloseq package (McMurdie and Holmes 2013). Alpha diversity was linearly regressed with individual childhood or perinatal blood metals, adjusting for the above-listed covariates sets. Beta (between-subject) diversity association was evaluated using permutational multivariate analysis of variance (adonis) (Anderson 2017; Oksanen et al. 2007). Adonis allows the linear fitting of individual metal exposure to the beta diversity distance matrix, using permutation test, adjusting for covariates (Stevens 2020). We applied two quantitative distance matrices, weighted UniFrac and Bray-Curtis distance, and two qualitative distance matrices, unweighted UniFrac and Jaccard distance (Beals 1984; Lozupone et al. 2011). We performed a sensitivity analysis on diversity measures stratified by child sex using the same method.
All taxa, species, and pathway data were normalized to relative abundance before screening. MaAsLin2 was used to screen significant taxa from 16S rRNA gene amplicon data, and significant species and pathways from shotgun metagenomic data (Mallick et al. 2021). Briefly, each taxon (phylum and family), species, pathway, or gene family was first selected if it was present in of the total participants. They were then regressed against individual metal measurements, adjusting for the above-listed covariates sets. We selected individual metal and corresponding taxa from the raw MaAsLin2 output table and calculated the FDR-adjusted -value. Influential points including one participant with high childhood blood Mn, Se, and Cd; two participants with high perinatal blood Cd; and one participant with high perinatal blood Pb were removed in all analyses. We extracted over 530,000 protein features mapped to UniRef90 for species association screening for each blood metal. Gene family-inferred species were then extracted from individual significant UniRef90 protein features. Unclassified species were later removed in gene family-inferred species association from the raw results. All de-identified R and batch scripts are publicly available in a Github repository (https://github.com/YikeShen).
Results
Alpha and Beta Diversity
Children included in analyses had mean alpha diversity of for the Shannon index and for the Pielou index, with no notable differences between the analytical subsets. There was no significant association of alpha diversity with either childhood blood metals or perinatal blood metals, adjusting for the above-listed covariates sets (Figure 2; Table S4). Similarly, beta diversity measured by weighted UniFrac, Bray-Curtis, unweighted UniFrac, and Jaccard distance matrices was not significantly associated with the five metals measured in either childhood blood or perinatal blood, adjusting for the above-listed covariates sets (Figure 3; Table S5). There was no apparent effect modification by child sex (Tables S6 and S7).
Figure 2.

Adjusted associations of childhood or perinatal blood metals (Cd, Hg, Mn, Pb, and Se) with children’s gut microbiome alpha diversity at the 6- to 7-y follow-up. Association of alpha diversity with (A) childhood or (B) perinatal blood metals. Alpha diversity was measured by Shannon richness and evenness index and Pielou evenness index. Point estimates are the result of linear regression per 1-nmol/L increase in Cd, Mn, and Hg and increase in Pb and Se; whiskers represent 95% confidence intervals. Childhood blood metal models adjust for child sex, family income at the 6- to 7-y follow-up, gestational age, and ever breastfed; perinatal blood metal models adjust for child sex, family income at delivery, delivery mode, perinatal BMI, pregnancy complications, and preexisting conditions. Additional information can be found in Table S4. Note: BMI: body mass index; Cd, cadmium; Hg, mercury; Mn, manganese; Pb, lead; Se, selenium.
Figure 3.

Significance of adjusted associations of childhood or perinatal blood metals (Cd, Hg, Mn, Pb, and Se) with children gut microbiome beta diversity at 6- to 7-y follow-up. Association of beta diversity with (A) childhood or (B) perinatal blood metals. Beta diversity was measured by weighted UniFrac, Bray-Curtis, unweighted UniFrac, and Jaccard distances. Colors represent -values from the adonis test. Associations with are displayed. Childhood blood metals models adjust for child sex, family income at the 6- to 7-y follow-up, gestational age, and ever breastfed; perinatal blood metal models adjust for child sex, family income at delivery, delivery mode, perinatal BMI, pregnancy complications, and preexisting conditions. Additional information can be found in Table S5. Note: BMI, body mass index; Cd, cadmium; Hg, mercury; Mn, manganese; Pb, lead; Se, selenium.
Taxa (Phylum and Family) Associations
We examined 9 phyla and 63 families that were present in of participants for associations with childhood blood metal concentrations. Both Mn and Se measured in childhood blood were associated with several taxa after adjusting for the above-listed covariates sets (Table 2; Excel Table S8). Specifically, higher childhood blood Mn was significantly associated with a lower relative abundance of Verrucomicrobiota (, ), Akkermansiaceae (, ), Erysipelatoclostridiaceae (, ), and Eggerthellaceae (, ) and higher relative abundance of Prevotellaceae (, ) (Table 2; Figure S1, Excel Table S8). Higher childhood blood Se was significantly associated with a higher relative abundance of Verrucomicrobiota (, ) and Proteobacteria (, ) (Table 2; Figure S1, Excel Table S8).
Table 2.
Taxa associations from 16S rRNA gene amplicon sequencing.
| Metals | Phylum/feature | Family/pathway | Coef | SE | -Value | FDR -Value |
|---|---|---|---|---|---|---|
| Child exposure–child microbiome—taxa associations | ||||||
| Mn | Verrucomicrobssiota | — | 0.100 | 0.003 | 0.031 | |
| Mn | Verrucomicrobiota | Akkermansiaceae | 0.100 | 0.003 | 0.052 | |
| Mn | Firmicutes | Erysipelatoclostridiaceae | 0.061 | 0.000 | 0.027 | |
| Mn | Actinobacteriota | Eggerthellaceae | 0.072 | 0.003 | 0.052 | |
| Mn | Bacteroidota | Prevotellaceae | 0.437 | 0.136 | 0.002 | 0.052 |
| Se | Verrucomicrobiota | — | 0.262 | 0.098 | 0.009 | 0.084 |
| Se | Proteobacteria | — | 0.158 | 0.067 | 0.021 | 0.093 |
| Child exposure–child microbiome—pathway associations | ||||||
| Pb | P161.PWY | Acetylene degradation | 0.065 | 0.001 | 0.100 | |
| Perinatal exposure–child microbiome—taxa associations | ||||||
| Mn | Actinobacteriota | Actinomycetaceae | 0.263 | 0.079 | 0.001 | 0.086 |
| Se | Actinobacteriota | — | 0.176 | 0.067 | 0.011 | 0.095 |
| Pb | Fusobacteriota | — | 0.189 | 0.061 | 0.003 | 0.028 |
Note: Pathway association from shotgun metagenomic sequencing. Association of gut microbiome taxa (phylum and family) with childhood or perinatal blood metals. Association of gut microbiome functional pathway with childhood blood metals. Association was analyzed using MaAsLin2. Childhood blood metals covariate sets: child sex, family income at the 6- to 7-y follow-up, gestational age, and ever breastfed; perinatal blood metals covariate sets: child sex, family income at delivery, delivery mode, perinatal BMI, pregnancy complications, and preexisting conditions. All statistics, including nonsignificant results, can be found in Excel Table S8 (taxa) and Excel Table S23 (pathway). —; data not available; BMI, body mass index; Coef, coefficient; FDR, false discovery rate; MaAsLin2, multivariable association model; Mn, manganese; Pb, lead; SE, standard error; Se, selenium.
Similarly, we explored the relationship between perinatal metals and 9 phyla and 59 families that were present in of participants. Taxa were significantly associated with perinatal blood Mn, Se, and Pb, adjusting for the above-listed covariates sets (Table 2; Figure S2, Excel Table S8). Higher perinatal blood Mn was significantly associated with a higher relative abundance of Actinomycetaceae (, ) (Table 2; Figure S2, Excel Table S8). Higher perinatal blood Se was significantly associated with a higher relative abundance of Actinobacteriota (, ) (Table 2; Figure S2, Excel Table S8). Finally, higher perinatal blood Pb was significantly associated with a higher relative abundance of Fusobacteriota (, ) (Table 2; Figure S2, Excel Table S8).
Species Associations
There was no significant association of MetaPhlAn species with either childhood blood metals or perinatal blood metals, adjusting for the above-listed covariates sets (Excel Tables S9 and S10). Bifidobacterium longum had the highest population average relative abundance (Excel Table S11). However, the relative abundance of several gene family-inferred species was significantly higher in relation to higher childhood blood Cd (), Hg (), and Pb (), adjusting for the above-listed covariates sets (Figure 4; Table S12, Excel Tables S13–S17). Higher childhood blood Cd was significantly associated with a higher relative abundance of 11 gene family-inferred species, namely, Bacteroides ovatus (, ), Bacteroides thetaiotaomicron (, ), Bacterodes uniformis [, ], Bacteroides vulgatus [, ], Bifidobacterium adolescentis [, ], Bifidobacterium longum (, ), Bifidobacterium pseudocatenulatum [, ], Agathobaculum butyriciproducens [, ], Parabacteroides distasonis [, ], and Parabacteroides merdae (, ]. Higher childhood blood Hg was significantly associated with a higher relative abundance of gene family-inferred Bacteroides vulgatus and Ruminococcus lactaris [, ]. Higher childhood blood Pb was significantly associated with a higher relative abundance of gene family-inferred Eubacterium rectale (, ). We found no significant gene family-inferred species association with childhood blood Mn and Se. A range of coefficients for significant gene family-inferred species is shown because different UniRef90 gene families can map to the same species (Figure 4; Table S12, Excel Tables S13–S17).
Figure 4.
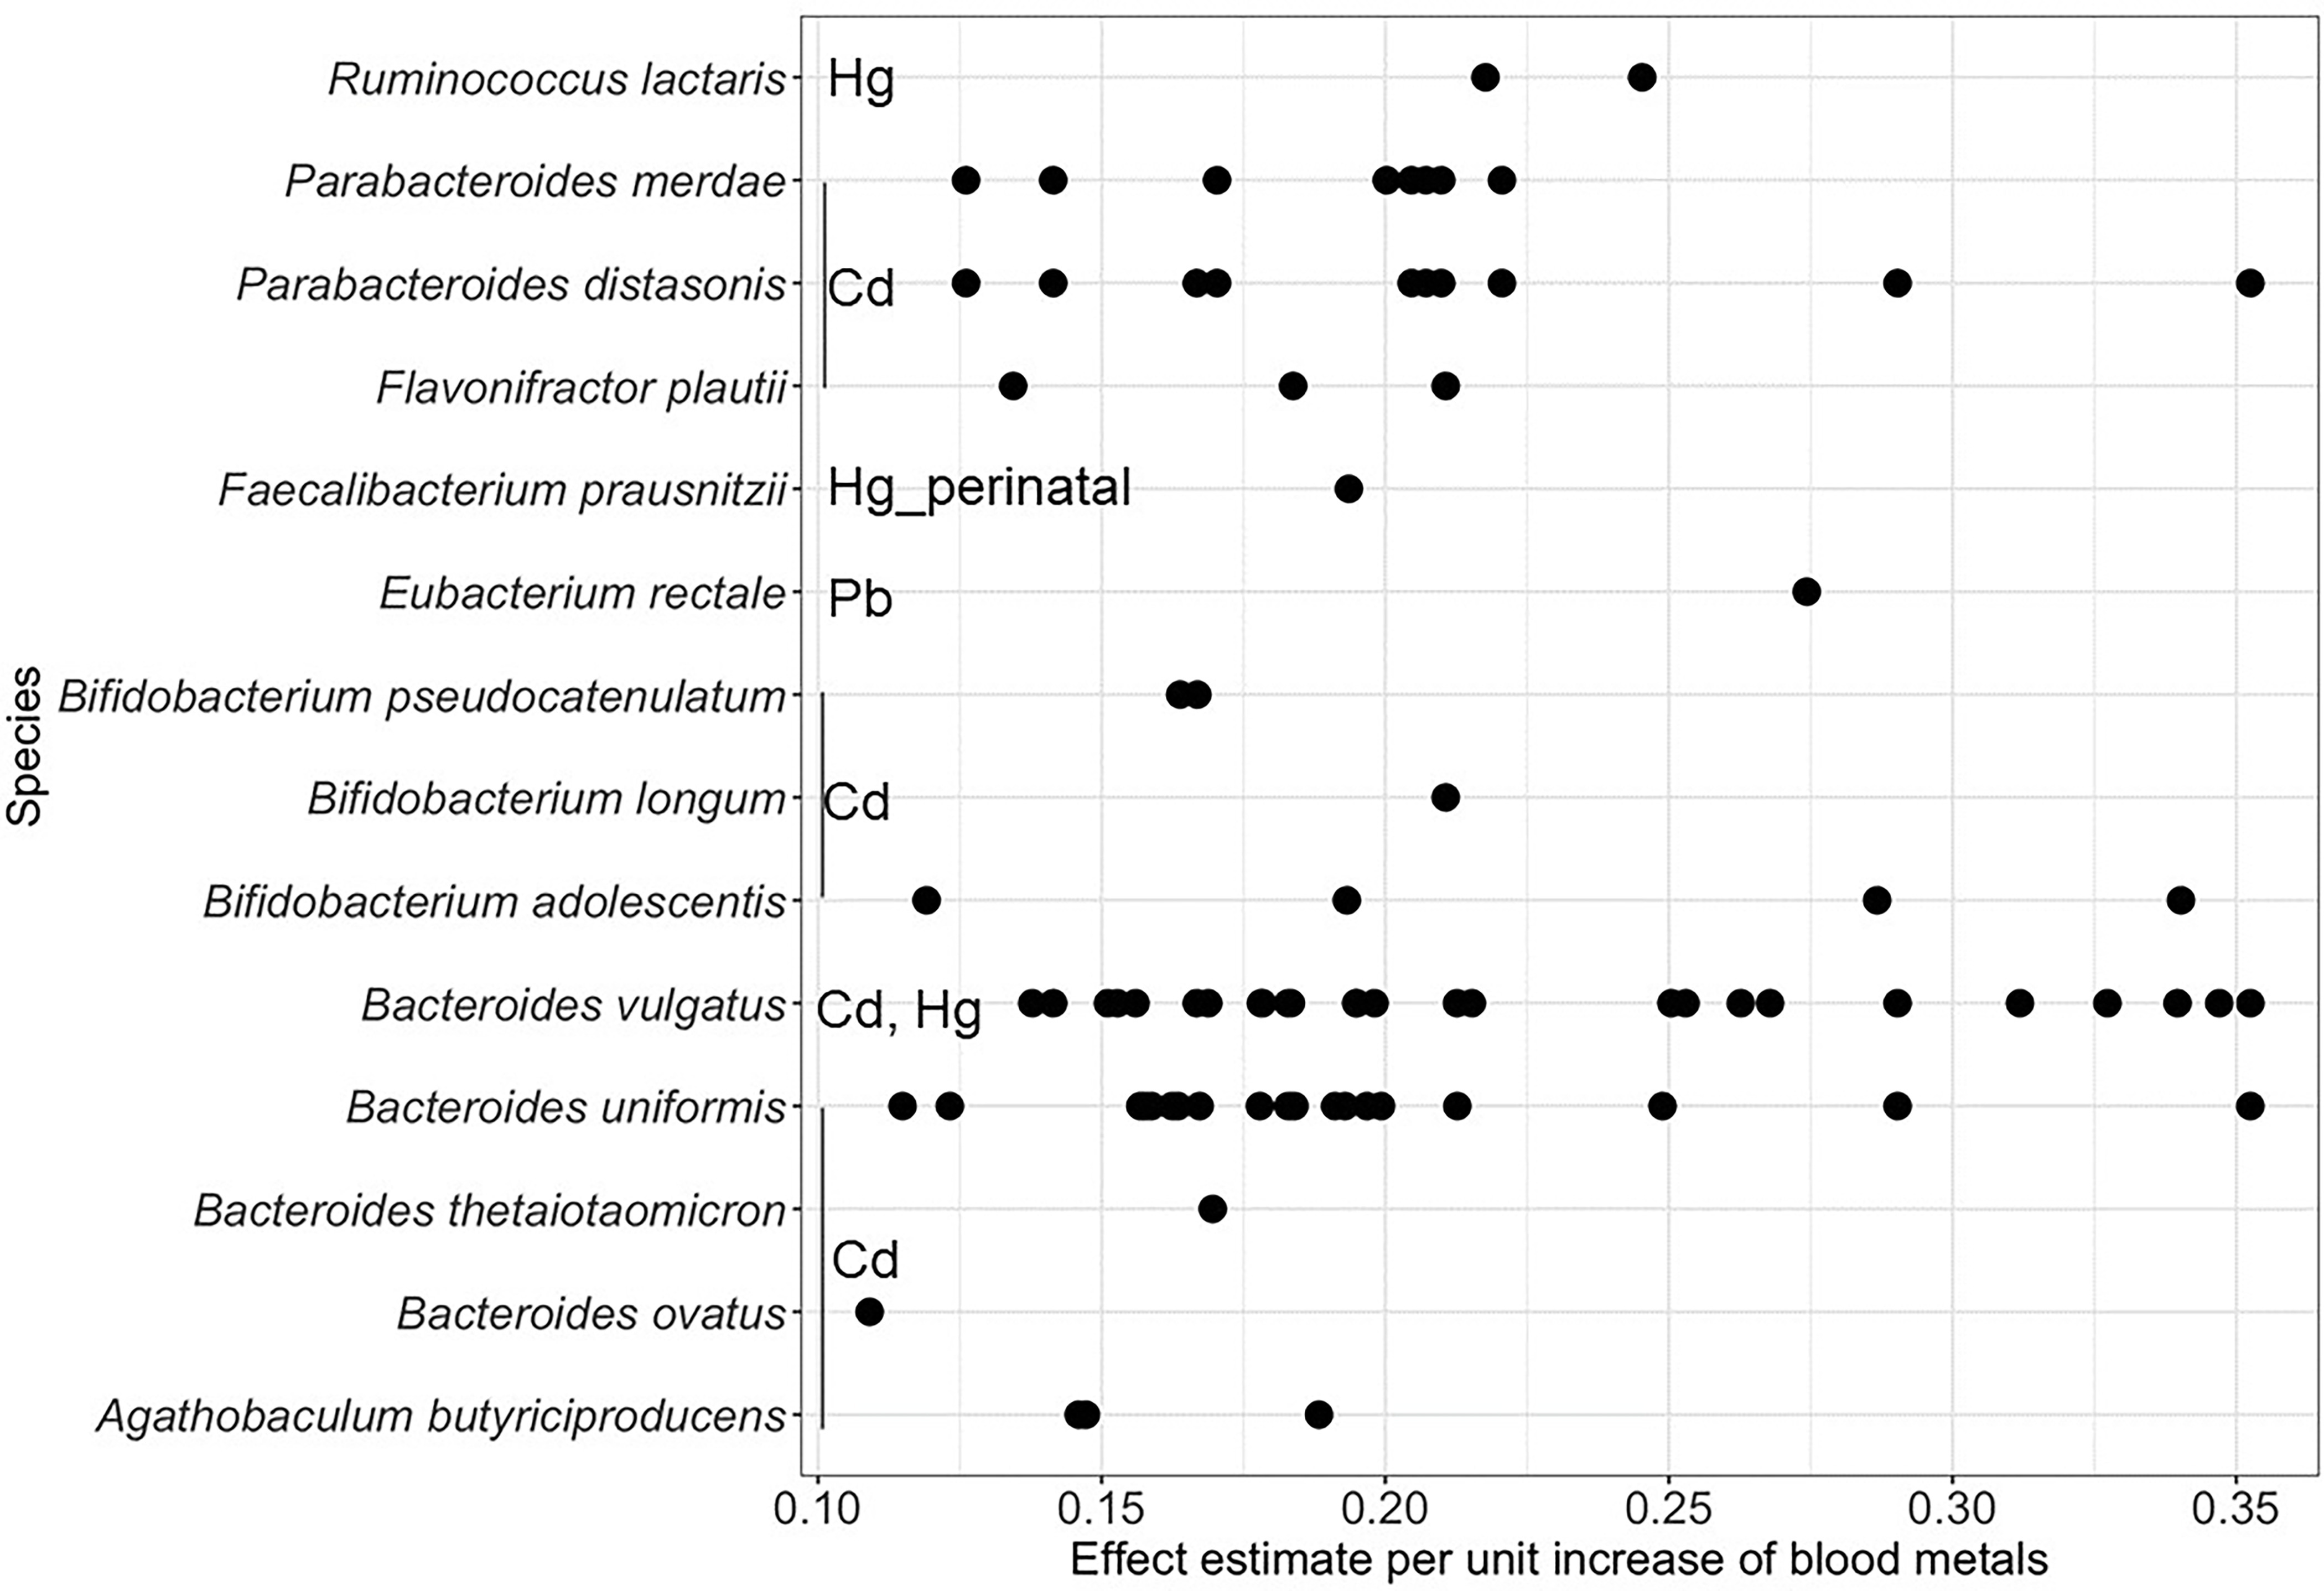
Association of childhood or perinatal blood metals with child gut microbiome gene family-inferred species. Effect estimates per unit increase of childhood Cd (in nmol/L), Hg (in nmol/L), and Pb (in ), adjusted for covariate sets. Perinatal association with Hg was denoted with Hg_perinatal. Associations were analyzed using MaAsLin2. Childhood blood metals covariate sets: child sex, family income at the 6- to 7-y follow-up, gestational age, and ever breastfed; perinatal blood metals covariate sets: child sex, family income at delivery, delivery mode, perinatal BMI, pregnancy complications, and preexisting conditions. Note: BMI, body mass index; Cd, cadmium; Hg, mercury; MaAsLin2, multivariable association model; Pb, lead.
In the analyses based on perinatal blood metals, higher blood Hg was significantly associated with a higher relative abundance of gene family-inferred Faecalibacterium prausnitzii (, ) (Figure 4; Table S12). We found no significant association with perinatal blood Cd, Mn, Pb, and Se, adjusting for the above-listed covariates sets. All results for the analysis of childhood and perinatal blood metals can be found in Excel Tables S18–S22.
Pathway Associations
In the analysis based on childhood blood metals, we examined a total of 362 pathways that were present in of participants for association with each metal, adjusting for the above-listed covariates sets. Acetylene degradation (, ) had significant negative associations with higher childhood blood Pb (Table 2; Figure S1, Excel Table S23). In the analysis based on perinatal blood metals, we assessed a total of 368 pathways that were present in of participants for association with each metal, adjusting for the above-listed covariates sets. We found no significant pathway association with perinatal blood metal levels.
Discussion
This study investigated the association of childhood or perinatal blood metals with children’s gut microbial community diversity measures, taxa, species, and pathways. We found numerous significant associations of childhood blood metals with taxa (), gene family-inferred species (), and pathway () relative abundance. Perinatal blood Hg, Mn, Se, and Pb were associated with Faecalibaterium prausnitzii, Actinomycetaceae, Actinobacteriota, and Fusobacteriota, respectively, but not with any potential functional pathways. Overall, our study suggests that concurrent children’s metal exposures may result in differentially abundant microbial community profiles, gene family-inferred species, and potential functional pathways. Conversely, perinatal metal exposures may have limited impact on the children’s gut microbiome measured in 6- to 7-year-olds.
Previous animal studies on metal exposures and gut microbiome diversity have yielded conflicting findings. Breton et al. (2013) found that subtoxic levels of Cd and a critical dose of Pb () did not significantly modify the gut microbiome of 6- to 14-wk-old mice, whereas Li et al. (2019) found that subtoxic levels of Cd significantly lowered alpha diversity in 7- to 9-wk-old mice. Gao et al. (2017) found that subtoxic Pb exposure () disturbed the development of the microbiome in 8- to 21-wk-old mice, resulting in lower alpha diversity and differences in beta diversity. Human studies of metal exposures and the gut microbiome among school-age children have been extremely limited. The only study we found on metal exposure on 3- to 7-year-olds was heavily focused on autistic children without analyzing continuous metals and childhood gut microbiome diversity measures (Zhai et al. 2019). One study in adults found that gut microbial evenness increased during long-term high Pb exposure near a mining and smelting site (Shao and Zhu 2020). Sitarik et al. (2020) found infant alpha diversity was not significantly associated with a high level of fetal and early postnatal Pb measured in teeth. Mothers and children included in our analysis had exposures comparable with the U.S. population geometric mean levels of blood Cd, Hg, and Pb (CDC 2021). Previous studies have shown that children’s gut microbiomes are highly susceptible to modifications immediately after delivery and up to 3 years of age, when their gut microbiome reaches maturity (Laue et al. 2020b; Lozupone et al. 2012). In addition, gut microbiome alpha diversity continues to slowly change until 40 years of age (Yadav et al. 2016). However, our study suggests influences from perinatal and early life metal exposures may not exert long-term influences on the diversity of childhood gut microbiome.
We found no significant associations of beta diversity (intrasubject diversity) with either perinatal or childhood blood metals. Similarly, Sitarik et al. (2020) found no association between high fetal or early postnatal tooth Pb and infant beta diversity measures. Shao and Zhu (2020) found perturbation of adult gut microbial beta diversity with long-term metal mixture exposure in a mining and smelting area. However, that study did not adjust for covariates and used categorical analysis metal exposure. A study in rats showed that Cd altered gut microbiota beta diversity in a dose–response matter (Richardson et al. 2018). Our results may not support the link between intrasubject diversity and childhood blood metal levels because of differences in population and experimental conditions.
Taxa analysis showed that perinatal and childhood blood Cd, Hg, and Pb were not significantly associated with the relative abundance of phyla and families. Higher childhood blood Mn was significantly associated with lower Verrucomicrobiota and Akkermansiaceae. Verrucomicrobiota is ubiquitous in the human gut and ecosystems and may live in association with eukaryotes (Wagner and Horn 2006). A member of Akkermansiaceae was found to degrade mucin (Arumugam et al. 2011; Derrien et al. 2008). Higher childhood blood Mn may therefore lead to lower mucin degradation and energy generation, but more detailed analysis of Akkermansiaceae species affected by exposure is required. Family Erysipelatoclostridiaceae, which was associated with Mn in our study, consists of some Clostridium species (e.g., Clostridium sp. CJ61, Clostridium sp. A4-51) that belong to the XVIII clostridial cluster (Cole et al. 2009; Quast et al. 2013). However, the implication of this result is uncertain because of the large number of genera and species present in the family. Members of Eggerthellaceae, which was associated with Mn in the present study, were found to be associated with secondary plant compound metabolization (Danylec et al. 2020). In addition, Eggerthellaceae were shown to produce bioactive molecules from the dietary polyphenols ellagitannins and ellagic acid, which mediate some of the health benefits associated with fruit consumption (Selma et al. 2017). Higher childhood blood Se was significantly associated with a higher relative abundance of two phyla commonly found in the gut microbiome—Verrucomicrobiota and Proteobacteria. Proteobacteria are facultative anaerobes, and some Proteobacteria members have been linked with negative health-related outcomes such as dysbiosis and metabolic diseases (Shin et al. 2015). Proteobacteria were also found to increase with environmental stresses, such as antibiotic exposure (Shen et al. 2019, 2021). Hence, the increased relative abundance of Proteobacteria may not be beneficial.
We found that higher perinatal blood Mn was associated with a higher relative abundance of Actinomycetaceae. Whether this association has any health relevance is uncertain. Members of the family Actinomycetaceae have a wide range of morphological and chemotaxonomic properties (Yassin 2014). Some members were associated with human and animal infections (Yassin 2014). A lower relative abundance of Actinomycetaceae has been linked to oral cancer and clinical depression (Börnigen et al. 2017; Kelly et al. 2015).
To investigate taxa associations at higher resolution, we employed shotgun metagenomic sequencing. Higher childhood blood Cd was associated with a higher relative abundance of 11 gene family-inferred species, including several beneficial gene family-inferred species. Most Bifidobacterium members, including the 3 gene family-inferred species significantly associated with higher childhood blood Cd, are beneficial bacteria that establish metabolic and physiologic interactions with the host (Al-Sheraji et al. 2012; Colombel et al. 1987; Duranti et al. 2020; Ghoddusi and Tamime 2014; Moya-Pérez et al. 2015; Schell et al. 2002). In particular, gene family-inferred Bifidobacterium longum is well-adapted to the human gastrointestinal tract, has potential immunomodulatory activity, and may be used as a probiotic to reduce adverse health outcomes (Colombel et al. 1987; Schell et al. 2002). Agathobaculum butyriciproducens, which was also positively associated with childhood blood Cd, was found to improve cognitive impairment of Alzheimer’s disease in mouse models (Go et al. 2021). Parabacteroides distasonis, which can alleviate obesity and metabolic dysfunctions and tumor formation associated with a high-fat diet in mice (Koh et al. 2018; Wang et al. 2019), was also positively associated with childhood blood Cd. Gene family-inferred Ruminococcus lactaris, a potential beneficial species with the capacity to ferment lactose in the gut (Moore et al. 1976), was positively associated with childhood blood Hg. The only significant association in our analysis of perinatal blood metals was a positive association between Hg and gene family-inferred Faecalibacterium prausnitzii. Faecalibacterium prausnitzii has been observed to promote gut health and to be a potential biomarker for gut disease diagnostics given its reduced abundance in intestinal disorders (Lopez-Siles et al. 2017). These beneficial species may have adapted to harmful metals and thus had a higher relative abundance in relation to higher blood metals. It is also possible that high blood metals inhibit the growth of some potentially harmful species, resulting in the increase in the relative abundance of the observed species.
High childhood blood Cd, Se, and Pb had positive associations with gene family-inferred species that can be either beneficial or harmful, depending on the context. Childhood blood Cd was positively associated with four gene family-inferred Bacteriodes species, including Bacteroides vulgatus, which was also positively associated with childhood Hg exposure. Bacteroides species are ubiquitous, commensal obligate anaerobes commonly found in the lower human intestinal tract that regulate molecular interactions (Patrick 2015; Wexler 2007). Among Bacteriodes species, avirulent Bacteroides vulgatus accounts for and can potentially contribute to pectin degradation, benefitting the human host (Larsen et al. 2019; Patrick 2015). Bacteroides uniformis has been shown to mitigate metabolic disorders and immunological dysfunction (Dahiya et al. 2019). However, Bacteroides can be harmful outside the gut environment and was the most common type of bacteria found in anaerobic infections (Wexler 2007). In addition, Bacteroides may confer resistance to metals (Ignacio et al. 2015; Riley and Mee 1982; Wexler 2007). Gene family-inferred Eubacterium rectale, which significantly associated with higher childhood blood Pb, promotes butyrate production, which may be harmful in suppressing stem cell proliferation in the crypts but beneficial for its energy metabolism and intestinal homeostasis activities (Liu et al. 2018; Singh et al. 2016).
High childhood blood Cd and Pb had positive associations with potentially harmful species. Gene family-inferred Flavonifractor plautii, a potential pathogen positively associated with childhood blood Cd, was related to worse Social Responsiveness Scale scores in toddlers and suppressed immune response in mice (Laue et al. 2020a; Mikami et al. 2020; Ogita et al. 2020). Additional gene family-inferred species characteristics and implications can be found in Table S24.
Higher childhood blood Pb was significantly associated with a lower relative abundance of genes in the acetylene degradation pathway. Some bacterial species use acetylene as a carbon source and produce acetate or ethanol through acetaldehyde hydrogenase (Caspi et al. 2020; Schink 1985). Among the results we analyzed, there was no significant species breakdown from the acetylene degradation pathway other than unclassified species from the MetaCyc database. Although no other studies, to our knowledge, have described associations between Pb and acetylene degradation, a lower relative abundance of this pathway has been associated with type I diabetes (Vatanen et al. 2018). Future mechanistic studies should examine whether capacity of the gut microbiome to degrade acetylene mediates or modifies known environmental epidemiologic associations.
To the best of our knowledge, this is the first human study to evaluate the association of both childhood and perinatal blood metals with the composition of the childhood gut microbiome. We used both shotgun metagenomic sequencing and 16S rRNA gene amplicon sequencing, covering both taxonomic and functional potential level analyses. Our study also had several limitations, including small sample size. We used FDR-corrected -values to limit the FDR to . In addition, some metal concentrations (i.e., Cd and Hg) in childhood blood had 45.6% and 40% of values below the LOD, respectively. Thus, we had limited power to detect associations with these exposures and our findings may not apply to populations with higher exposure. Furthermore, diet and antibiotic usage information were not collected in the 6- to 7-y follow-up, which may result in confounding. In addition to differences in sequencing methodology, data processing, and reference databases, differences in DNA extraction for 16S rRNA and metagenomic sequencing limit comparability of our results. Finally, the GESTE cohort is relatively homogeneous in demographics (primarily of upper middle-class French-Canadians) with mean levels of exposure, making our study less comparable with population groups with high levels of metal exposure.
In conclusion, our study found associations of childhood and perinatal blood metals with relative abundance of specific gut microbiome taxa and gene family-inferred species that, based on previous findings, may be beneficial to the host, whereas others may have negative consequences. Additional epidemiologic and mechanistic studies are warranted to confirm and generalize our results, as well as to investigate how these microbial variations may affect children’s health.
Supplementary Material
Acknowledgments
We appreciate the participation of all GESTation and Environment Cohort Study families and the support of the cohort study staff. We thank all the Baccarelli Laboratory members for data analysis discussions. Figure 1 graphic representation was created with BioRender.com.
The study was supported by grants R21ES024841, R01ES027845, and P30ES009089 from the National Institute of Environmental Health Sciences (to A.A.B.); grant MOP-84551 from the Canadian Institutes of Health Research (to L.T.); and Canadian Research Chair grant CRC-950-230570 from the Natural Sciences and Engineering Research Council of Canada (to L.T.).
References
- Al-Sheraji SH, Ismail A, Manap MY, Mustafa S, Yusof RM, Hassan FA. 2012. Hypocholesterolaemic effect of yoghurt containing Bifidobacterium pseudocatenulatum G4 or Bifidobacterium longum BB536. Food Chem 135(2):356–361, PMID: , 10.1016/j.foodchem.2012.04.120. [DOI] [PubMed] [Google Scholar]
- Anderson MJ. 2017. Permutational multivariate analysis of variance (PERMANOVA). In: Wiley StatsRef: Statistics Reference Online. Hoboken, NJ: John Wiley & Sons. Balakrishnan N, Colton T, Everitt B, Piegorsch W, Ruggeri F, Teugels JL, eds. 10.1002/9781118445112.stat07841. [DOI] [Google Scholar]
- Andrews S. 2010. FastQC: a quality control tool for high throughput sequence data. Cambridge, United Kingdom: Babraham Bioinformatics, Babraham Institute. https://www.bioinformatics.babraham.ac.uk/projects/fastqc/ [accessed 20 December 2021]. [Google Scholar]
- Apprill A, McNally S, Parsons R, Weber L. 2015. Minor revision to V4 region SSU rRNA 806R gene primer greatly increases detection of SAR11 bacterioplankton. Aquat Microb Ecol 75(2):129–137, 10.3354/ame01753. [DOI] [Google Scholar]
- Arumugam M, Raes J, Pelletier E, Le Paslier D, Yamada T, Mende DR, et al. 2011. Enterotypes of the human gut microbiome. Nature 473(7346):174–180, PMID: , 10.1038/nature09944. [DOI] [PMC free article] [PubMed] [Google Scholar]
- Beals EW. 1984. Bray-Curtis ordination: an effective strategy for analysis of multivariate ecological data. Adv Ecol Res 14:1–55. [Google Scholar]
- Bolger AM, Lohse M, Usadel B. 2014. Trimmomatic: a flexible trimmer for Illumina sequence data. Bioinformatics 30(15):2114–2120, PMID: , 10.1093/bioinformatics/btu170. [DOI] [PMC free article] [PubMed] [Google Scholar]
- Bolyen E, Rideout JR, Dillon MR, Bokulich NA, Abnet CC, Al-Ghalith GA, et al. 2019. Reproducible, interactive, scalable and extensible microbiome data science using QIIME 2. Nat Biotechnol 37(8):852–857, PMID: , 10.1038/s41587-019-0209-9. [DOI] [PMC free article] [PubMed] [Google Scholar]
- Börnigen D, Ren B, Pickard R, Li J, Ozer E, Hartmann EM, et al. 2017. Alterations in oral bacterial communities are associated with risk factors for oral and oropharyngeal cancer. Sci Rep 7(1):17686, PMID: , 10.1038/s41598-017-17795-z. [DOI] [PMC free article] [PubMed] [Google Scholar]
- Breton J, Massart S, Vandamme P, De Brandt E, Pot B, Foligné B. 2013. Ecotoxicology inside the gut: impact of heavy metals on the mouse microbiome. BMC Pharmacol Toxicol 14:62, PMID: , 10.1186/2050-6511-14-62. [DOI] [PMC free article] [PubMed] [Google Scholar]
- Cao S, Duan X, Zhao X, Ma J, Dong T, Huang N, et al. 2014. Health risks from the exposure of children to As, Se, Pb and other heavy metals near the largest coking plant in China. Sci Total Environ 472:1001–1009, PMID: , 10.1016/j.scitotenv.2013.11.124. [DOI] [PubMed] [Google Scholar]
- Caporaso JG, Lauber CL, Walters WA, Berg-Lyons D, Lozupone CA, Turnbaugh PJ, et al. 2011. Global patterns of 16s rRNA diversity at a depth of millions of sequences per sample. Proc Natl Acad Sci U S A 108(suppl 1):4516–4522, PMID: , 10.1073/pnas.1000080107. [DOI] [PMC free article] [PubMed] [Google Scholar]
- Caspi R, Billington R, Keseler IM, Kothari A, Krummenacker M, Midford PE, et al. 2020. The MetaCyc database of metabolic pathways and enzymes—a 2019 update. Nucleic Acids Res 48(D1):D445–D453, PMID: , 10.1093/nar/gkz862. [DOI] [PMC free article] [PubMed] [Google Scholar]
- CDC (Centers for Disease Control and Prevention). 2021. Fourth National Report on Human Exposure to Environmental Chemicals: Updated Tables, March 2021. https://www.cdc.gov/exposurereport/pdf/FourthReport_UpdatedTables_Volume4_Mar2021-508.pdf [accessed 29 December 2021].
- Chi L, Bian X, Gao B, Ru H, Tu P, Lu K. 2016. Sex-specific effects of arsenic exposure on the trajectory and function of the gut microbiome. Chem Res Toxicol 29(6):949–951, PMID: , 10.1021/acs.chemrestox.6b00066. [DOI] [PMC free article] [PubMed] [Google Scholar]
- Chi L, Gao B, Bian X, Tu P, Ru H, Lu K. 2017. Manganese-induced sex-specific gut microbiome perturbations in C57BL/6 mice. Toxicol Appl Pharmacol 331:142–153, PMID: , 10.1016/j.taap.2017.06.008. [DOI] [PMC free article] [PubMed] [Google Scholar]
- Cioffi CC, Tavalire HF, Neiderhiser JM, Bohannan B, Leve LD. 2020. History of breastfeeding but not mode of delivery shapes the gut microbiome in childhood. PLoS One 15(7):e0235223, PMID: , 10.1371/journal.pone.0235223. [DOI] [PMC free article] [PubMed] [Google Scholar]
- Cole JR, Wang Q, Cardenas E, Fish J, Chai B, Farris RJ, et al. 2009. The Ribosomal Database Project: improved alignments and new tools for rRNA analysis. Nucleic Acids Res 37(database issue):D141–D145, PMID: , 10.1093/nar/gkn879. [DOI] [PMC free article] [PubMed] [Google Scholar]
- Colombel J, Cortot A, Neut C, Romond C. 1987. Yoghurt with Bifidobacterium longum reduces erythromycin-induced gastrointestinal effects. Lancet 330(8549):43, PMID: , 10.1016/S0140-6736(87)93078-9. [DOI] [PubMed] [Google Scholar]
- Dahiya DK, Renuka , Dangi AK, Shandilya UK, Puniya AK, Shukla P. 2019. Chapter 44. New-generation probiotics: perspectives and applications. In: Microbiome and Metabolome in Diagnosis, Therapy, and Other Strategic Applications. Faintuch J, Faintuch S, eds. London, UK: Academic Press, 417–424. [Google Scholar]
- Danylec N, Stoll DA, Göbl A, Huch M. 2020. Draft genome sequences of 13 isolates of Adlercreutzia equolifaciens, Eggerthella lenta, and Gordonibacter urolithinfaciens, isolated from human fecal samples in Karlsruhe, Germany. Microbiol Resour Announc 9(8):e00017–e00020, PMID: , 10.1128/MRA.00017-20. [DOI] [PMC free article] [PubMed] [Google Scholar]
- Derrien M, Collado MC, Ben-Amor K, Salminen S, de Vos WM. 2008. The mucin degrader Akkermansia muciniphila is an abundant resident of the human intestinal tract. Appl Environ Microbiol 74(5):1646–1648, PMID: , 10.1128/AEM.01226-07. [DOI] [PMC free article] [PubMed] [Google Scholar]
- Duan H, Yu L, Tian F, Zhai Q, Fan L, Chen W. 2020. Gut microbiota: a target for heavy metal toxicity and a probiotic protective strategy. Sci Total Environ 742:140429, PMID: , 10.1016/j.scitotenv.2020.140429. [DOI] [PubMed] [Google Scholar]
- Duranti S, Ruiz L, Lugli GA, Tames H, Milani C, Mancabelli L, et al. 2020. Bifidobacterium adolescentis as a key member of the human gut microbiota in the production of GABA. Sci Rep 10(1):14112, PMID: , 10.1038/s41598-020-70986-z. [DOI] [PMC free article] [PubMed] [Google Scholar]
- Ewels P, Magnusson M, Lundin S, Käller M. 2016. MultiQC: summarize analysis results for multiple tools and samples in a single report. Bioinformatics 32(19):3047–3048, PMID: , 10.1093/bioinformatics/btw354. [DOI] [PMC free article] [PubMed] [Google Scholar]
- Franzén O, Hu J, Bao X, Itzkowitz SH, Peter I, Bashir A. 2015. Improved OTU-picking using long-read 16s rRNA gene amplicon sequencing and generic hierarchical clustering. Microbiome 3:43, PMID: , 10.1186/s40168-015-0105-6. [DOI] [PMC free article] [PubMed] [Google Scholar]
- Franzosa EA, McIver LJ, Rahnavard G, Thompson LR, Schirmer M, Weingart G, et al. 2018. Species-level functional profiling of metagenomes and metatranscriptomes. Nat Methods 15(11):962–968, PMID: , 10.1038/s41592-018-0176-y. [DOI] [PMC free article] [PubMed] [Google Scholar]
- Gao B, Chi L, Mahbub R, Bian X, Tu P, Ru H, et al. 2017. Multi-omics reveals that lead exposure disturbs gut microbiome development, key metabolites, and metabolic pathways. Chem Res Toxicol 30(4):996–1005, PMID: , 10.1021/acs.chemrestox.6b00401. [DOI] [PMC free article] [PubMed] [Google Scholar]
- Ghaisas S, Maher J, Kanthasamy A. 2016. Gut microbiome in health and disease: linking the microbiome–gut–brain axis and environmental factors in the pathogenesis of systemic and neurodegenerative diseases. Pharmacol Ther 158:52–62, PMID: , 10.1016/j.pharmthera.2015.11.012. [DOI] [PMC free article] [PubMed] [Google Scholar]
- Ghoddusi HB, Tamime AY. 2014. Microflora of the intestine: biology of Bifidobacteria. In: Encyclopedia of Food Microbiology. 2nd ed. Batt CA, Tortorello ML, eds. Amsterdam, Netherlands: Academic Press, 639–645. [Google Scholar]
- Go J, Chang DH, Ryu YK, Park HY, Lee IB, Noh JR, et al. 2021. Human gut microbiota Agathobaculum butyriciproducens improves cognitive impairment in LPS-induced and APP/PS1 mouse models of Alzheimer’s disease. Nutr Res 86:96–108, PMID: , 10.1016/j.nutres.2020.12.010. [DOI] [PubMed] [Google Scholar]
- He X, Qi Z, Hou H, Qian L, Gao J, Zhang XX. 2020. Structural and functional alterations of gut microbiome in mice induced by chronic cadmium exposure. Chemosphere 246:125747, PMID: , 10.1016/j.chemosphere.2019.125747. [DOI] [PubMed] [Google Scholar]
- Hoen AG, Madan JC, Li Z, Coker M, Lundgren SN, Morrison HG, et al. 2018. Sex-specific associations of infants’ gut microbiome with arsenic exposure in a US population. Sci Rep 8(1):12627, PMID: , 10.1038/s41598-018-30581-9. [DOI] [PMC free article] [PubMed] [Google Scholar]
- Hornung RW, Reed LD. 1990. Estimation of average concentration in the presence of nondetectable values. Appl Occup Environ Hyg 5(1):46–51, 10.1080/1047322X.1990.10389587. [DOI] [Google Scholar]
- Human Microbiome Project Consortium. 2012. Structure, function and diversity of the healthy human microbiome. Nature 486:207–214, PMID: , 10.1038/nature11234. [DOI] [PMC free article] [PubMed] [Google Scholar]
- Ignacio A, Nakano V, Avila-Campos MJ. 2015. Intestinal Bacteroides vulgatus showing resistance to metals. Appl Med Res 1(2):46–50, 10.5455/amr.20150401012721. [DOI] [Google Scholar]
- Kelly JR, Kennedy PJ, Cryan JF, Dinan TG, Clarke G, Hyland NP. 2015. Breaking down the barriers: the gut microbiome, intestinal permeability and stress-related psychiatric disorders. Front Cell Neurosci 9:392, PMID: , 10.3389/fncel.2015.00392. [DOI] [PMC free article] [PubMed] [Google Scholar]
- Koh GY, Kane A, Lee K, Xu Q, Wu X, Roper J, et al. 2018. Parabacteroides distasonis attenuates toll‐like receptor 4 signaling and Akt activation and blocks colon tumor formation in high‐fat diet‐fed azoxymethane‐treated mice. Int J Cancer 143(7):1797–1805, PMID: , 10.1002/ijc.31559. [DOI] [PubMed] [Google Scholar]
- Langmead B, Salzberg SL. 2012. Fast gapped-read alignment with Bowtie 2. Nat Methods 9(4):357–359, PMID: , 10.1038/nmeth.1923. [DOI] [PMC free article] [PubMed] [Google Scholar]
- Larsen N, Bussolo de Souza C, Krych L, Barbosa Cahú T, Wiese M, Kot W, et al. 2019. Potential of pectins to beneficially modulate the gut microbiota depends on their structural properties. Front Microbiol 10:223, PMID: , 10.3389/fmicb.2019.00223. [DOI] [PMC free article] [PubMed] [Google Scholar]
- Laue HE, Brennan KJM, Gillet V, Abdelouahab N, Coull BA, Weisskopf MG, et al. 2019. Associations of prenatal exposure to polybrominated diphenyl ethers and polychlorinated biphenyls with long-term gut microbiome structure: a pilot study. Environ Epidemiol 3(1):e039, PMID: , 10.1097/EE9.0000000000000039. [DOI] [PMC free article] [PubMed] [Google Scholar]
- Laue HE, Korrick SA, Baker ER, Karagas MR, Madan JC. 2020a. Prospective associations of the infant gut microbiome and microbial function with social behaviors related to autism at age 3 years. Sci Rep 10(1):15515, PMID: , 10.1038/s41598-020-72386-9. [DOI] [PMC free article] [PubMed] [Google Scholar]
- Laue HE, Moroishi Y, Jackson BP, Palys TJ, Madan JC, Karagas MR. 2020b. Nutrient-toxic element mixtures and the early postnatal gut microbiome in a United States longitudinal birth cohort. Environ Int 138:105613, PMID: , 10.1016/j.envint.2020.105613. [DOI] [PMC free article] [PubMed] [Google Scholar]
- Li X, Brejnrod AD, Ernst M, Rykær M, Herschend J, Olsen NMC, et al. 2019. Heavy metal exposure causes changes in the metabolic health-associated gut microbiome and metabolites. Environ Int 126:454–467, PMID: , 10.1016/j.envint.2019.02.048. [DOI] [PubMed] [Google Scholar]
- Liu H, Wang J, He T, Becker S, Zhang G, Li D, et al. 2018. Butyrate: a double-edged sword for health? Adv Nutr 9(1):21–29, PMID: , 10.1093/advances/nmx009. [DOI] [PMC free article] [PubMed] [Google Scholar]
- Lopez-Siles M, Duncan SH, Garcia-Gil LJ, Martinez-Medina M. 2017. Faecalibacterium prausnitzii: from microbiology to diagnostics and prognostics. ISME J 11(4):841–852, PMID: , 10.1038/ismej.2016.176. [DOI] [PMC free article] [PubMed] [Google Scholar]
- Lozupone C, Lladser ME, Knights D, Stombaugh J, Knight R. 2011. UniFrac: an effective distance metric for microbial community comparison. ISME J 5(2):169–172, PMID: , 10.1038/ismej.2010.133. [DOI] [PMC free article] [PubMed] [Google Scholar]
- Lozupone CA, Stombaugh JI, Gordon JI, Jansson JK, Knight R. 2012. Diversity, stability and resilience of the human gut microbiota. Nature 489(7415):220–230, PMID: , 10.1038/nature11550. [DOI] [PMC free article] [PubMed] [Google Scholar]
- Mallick H, Rahnavard A, McIver LJ, Ma S, Zhang Y, Nguyen LH, et al. 2021. Multivariable association discovery in population-scale meta-omics studies. PLoS Comput Biol 17(11):e1009442, PMID: , 10.1371/journal.pcbi.1009442. [DOI] [PMC free article] [PubMed] [Google Scholar]
- Markle JGM, Frank DN, Mortin-Toth S, Robertson CE, Feazel LM, Rolle-Kampczyk U, et al. 2013. Sex differences in the gut microbiome drive hormone-dependent regulation of autoimmunity. Science 339(6123):1084–1088, PMID: , 10.1126/science.1233521. [DOI] [PubMed] [Google Scholar]
- McMurdie PJ, Holmes S. 2013. phyloseq: an R package for reproducible interactive analysis and graphics of microbiome census data. PLoS One 8(4):e61217, PMID: , 10.1371/journal.pone.0061217. [DOI] [PMC free article] [PubMed] [Google Scholar]
- Mikami A, Ogita T, Namai F, Shigemori S, Sato T, Shimosato T. 2020. Oral administration of Flavonifractor plautii attenuates inflammatory responses in obese adipose tissue. Mol Biol Rep 47(9):6717–6725, PMID: , 10.1007/s11033-020-05727-6. [DOI] [PubMed] [Google Scholar]
- Min Y, Ma X, Sankaran K, Ru Y, Chen L, Baiocchi M, et al. 2019. Sex-specific association between gut microbiome and fat distribution. Nat Commun 10(1):2408, PMID: , 10.1038/s41467-019-10440-5. [DOI] [PMC free article] [PubMed] [Google Scholar]
- Mitchell CM, Mazzoni C, Hogstrom L, Bryant A, Bergerat A, Cher A, et al. 2020. Delivery mode affects stability of early infant gut microbiota. Cell Rep Med 1(9):100156, PMID: , 10.1016/j.xcrm.2020.100156. [DOI] [PMC free article] [PubMed] [Google Scholar]
- Moore WEC, Johnson JL, Holdeman LV. 1976. Emendation of Bacteroidaceae and Butyrivibrio and descriptions of Desulfomonas gen. nov. and ten new species in the genera Desulfomonas, Butyrivibrio, Eubacterium, Clostridium, and Ruminococcus. Int J Syst Evol Microbiol 26(2):238–252, 10.1099/00207713-26-2-238. [DOI] [Google Scholar]
- Moya-Pérez A, Neef A, Sanz Y. 2015. Bifidobacterium pseudocatenulatum CECT 7765 reduces obesity-associated inflammation by restoring the lymphocyte-macrophage balance and gut microbiota structure in high-fat diet-fed mice. PLoS One 10(7):e0126976, PMID: , 10.1371/journal.pone.0126976. [DOI] [PMC free article] [PubMed] [Google Scholar]
- Ogita T, Yamamoto Y, Mikami A, Shigemori S, Sato T, Shimosato T. 2020. Oral administration of Flavonifractor plautii strongly suppresses Th2 immune responses in mice. Front Immunol 11:379, PMID: , 10.3389/fimmu.2020.00379. [DOI] [PMC free article] [PubMed] [Google Scholar]
- Oksanen J, Kindt R, Legendre P, O’Hara B, Stevens MHH, Oksanen MJ, et al. 2007. The vegan package. Community Ecology Package 10(631–637):719. [Google Scholar]
- Parada AE, Needham DM, Fuhrman JA. 2016. Every base matters: assessing small subunit rRNA primers for marine microbiomes with mock communities, time series and global field samples. Environ Microbiol 18(5):1403–1414, PMID: , 10.1111/1462-2920.13023. [DOI] [PubMed] [Google Scholar]
- Patrick S. 2015. Chapter 51. Bacteroides. In: Molecular Medical Microbiology. 2nd ed. Tang YW, Sussman M, Liu D, Poxton I, Schwartzman J, eds. London, UK: Academic Press, 917–944. [Google Scholar]
- Quast C, Pruesse E, Yilmaz P, Gerken J, Schweer T, Yarza P, et al. 2013. The SILVA ribosomal RNA gene database project: improved data processing and web-based tools. Nucleic Acids Res 41(database issue):D590–D596, PMID: , 10.1093/nar/gks1219. [DOI] [PMC free article] [PubMed] [Google Scholar]
- Richardson JB, Dancy BCR, Horton CL, Lee YS, Madejczyk MS, Xu ZZ, et al. 2018. Exposure to toxic metals triggers unique responses from the rat gut microbiota. Sci Rep 8(1):6578, PMID: , 10.1038/s41598-018-24931-w. [DOI] [PMC free article] [PubMed] [Google Scholar]
- Riley TV, Mee BJ. 1982. Susceptibility of Bacteroides spp. to heavy metals. Antimicrob Agents Chemother 22(5):889–892, PMID: , 10.1128/AAC.22.5.889. [DOI] [PMC free article] [PubMed] [Google Scholar]
- Santos A, van Aerle R, Barrientos L, Martinez-Urtaza J. 2020. Computational methods for 16S metabarcoding studies using Nanopore sequencing data. Comput Struct Biotechnol J 18:296–305, PMID: , 10.1016/j.csbj.2020.01.005. [DOI] [PMC free article] [PubMed] [Google Scholar]
- Schell MA, Karmirantzou M, Snel B, Vilanova D, Berger B, Pessi G, et al. 2002. The genome sequence of Bifidobacterium longum reflects its adaptation to the human gastrointestinal tract. Proc Natl Acad Sci U S A 99(22):14422–14427, PMID: , 10.1073/pnas.212527599. [DOI] [PMC free article] [PubMed] [Google Scholar]
- Schink B. 1985. Fermentation of acetylene by an obligate anaerobe, Pelobacter acetylenicus sp. nov. Arch Microbiol 142:295–301, 10.1007/BF00693407. [DOI] [Google Scholar]
- Selma MV, Beltrán D, Luna MC, Romo-Vaquero M, García-Villalba R, Mira A, et al. 2017. Isolation of human intestinal bacteria capable of producing the bioactive metabolite isourolithin A from ellagic acid. Front Microbiol 8:1521, PMID: , 10.3389/fmicb.2017.01521. [DOI] [PMC free article] [PubMed] [Google Scholar]
- Serme-Gbedo YK, Abdelouahab N, Pasquier JC, Cohen AA, Takser L. 2016. Maternal levels of endocrine disruptors, polybrominated diphenyl ethers, in early pregnancy are not associated with lower birth weight in the Canadian birth cohort GESTE. Environ Health 15(1):49, PMID: , 10.1186/s12940-016-0134-z. [DOI] [PMC free article] [PubMed] [Google Scholar]
- Shao M, Zhu Y. 2020. Long-term metal exposure changes gut microbiota of residents surrounding a mining and smelting area. Sci Rep 10(1):4453, PMID: , 10.1038/s41598-020-61143-7. [DOI] [PMC free article] [PubMed] [Google Scholar]
- Shen Y, Ryser ET, Li H, Zhang W. 2021. Bacterial community assembly and antibiotic resistance genes in the lettuce-soil system upon antibiotic exposure. Sci Total Environ 778:146255, PMID: , 10.1016/j.scitotenv.2021.146255. [DOI] [PubMed] [Google Scholar]
- Shen Y, Stedtfeld RD, Guo X, Bhalsod GD, Jeon S, Tiedje JM, et al. 2019. Pharmaceutical exposure changed antibiotic resistance genes and bacterial communities in soil-surface- and overhead-irrigated greenhouse lettuce. Environ Int 131:105031, PMID: , 10.1016/j.envint.2019.105031. [DOI] [PubMed] [Google Scholar]
- Shin NR, Whon TW, Bae JW. 2015. Proteobacteria: microbial signature of dysbiosis in gut microbiota. Trends Biotechnol 33(9):496–503, PMID: , 10.1016/j.tibtech.2015.06.011. [DOI] [PubMed] [Google Scholar]
- Singh V, San Yeoh B, Vijay-Kumar M. 2016. Feed your gut with caution! Transl Cancer Res 5(suppl 3):S507–S513, PMID: , 10.21037/tcr.2016.09.13. [DOI] [PMC free article] [PubMed] [Google Scholar]
- Sitarik AR, Arora M, Austin C, Bielak LF, Eggers S, Johnson CC, et al. 2020. Fetal and early postnatal lead exposure measured in teeth associates with infant gut microbiota. Environ Int 144:106062, PMID: , 10.1016/j.envint.2020.106062. [DOI] [PMC free article] [PubMed] [Google Scholar]
- Stevens MHH. 2020. adonis: permutational multivariate analysis of variance using… In: vegan: Community Ecology Package. https://rdrr.io/rforge/vegan/man/adonis.html [accessed 27 December 2020].
- Thion MS, Low D, Silvin A, Chen J, Grisel P, Schulte-Schrepping J, et al. 2018. Microbiome influences prenatal and adult microglia in a sex-specific manner. Cell 172(3):500–516.e16, PMID: , 10.1016/j.cell.2017.11.042. [DOI] [PMC free article] [PubMed] [Google Scholar]
- Vatanen T, Franzosa EA, Schwager R, Tripathi S, Arthur TD, Vehik K, et al. 2018. The human gut microbiome in early-onset type 1 diabetes from the TEDDY study. Nature 562(7728):589–594, PMID: , 10.1038/s41586-018-0620-2. [DOI] [PMC free article] [PubMed] [Google Scholar]
- Vujkovic-Cvijin I, Sklar J, Jiang L, Natarajan L, Knight R, Belkaid Y. 2020. Host variables confound gut microbiota studies of human disease. Nature 587(7834):448–447, PMID: , 10.1038/s41586-020-2881-9. [DOI] [PMC free article] [PubMed] [Google Scholar]
- Wagner M, Horn M. 2006. The Planctomycetes, Verrucomicrobia, Chlamydiae and sister phyla comprise a superphylum with biotechnological and medical relevance. Curr Opin Biotechnol 17(3):241–249, PMID: , 10.1016/j.copbio.2006.05.005. [DOI] [PubMed] [Google Scholar]
- Wang K, Liao M, Zhou N, Bao L, Ma K, Zheng Z, et al. 2019. Parabacteroides distasonis alleviates obesity and metabolic dysfunctions via production of succinate and secondary bile acids. Cell Rep 26(1):222–235.e5, PMID: , 10.1016/j.celrep.2018.12.028. [DOI] [PubMed] [Google Scholar]
- Wexler HM. 2007. Bacteroides: the good, the bad, and the nitty-gritty. Clin Microbiol Rev 20(4):593–621, PMID: , 10.1128/CMR.00008-07. [DOI] [PMC free article] [PubMed] [Google Scholar]
- Yadav D, Ghosh TS, Mande SS. 2016. Global investigation of composition and interaction networks in gut microbiomes of individuals belonging to diverse geographies and age-groups. Gut Pathog 8(1):17, PMID: , 10.1186/s13099-016-0099-z. [DOI] [PMC free article] [PubMed] [Google Scholar]
- Yassin AAF. 2014. The family Actinomycetaceae. In: The Prokaryotes. Rosenberg E, DeLong EF, Lory S, Stackebrandt E, Thompson F, eds. Berlin, Germany: Springer Nature, 21–103. [Google Scholar]
- Yuan S, Cohen DB, Ravel J, Abdo Z, Forney LJ. 2012. Evaluation of methods for the extraction and purification of DNA from the human microbiome. PLoS One 7(3):e33865, PMID: , 10.1371/journal.pone.0033865. [DOI] [PMC free article] [PubMed] [Google Scholar]
- Zeng X, Xu X, Boezen HM, Huo X. 2016. Children with health impairments by heavy metals in an e-waste recycling area. Chemosphere 148:408–415, PMID: , 10.1016/j.chemosphere.2015.10.078. [DOI] [PubMed] [Google Scholar]
- Zhai Q, Cen S, Jiang J, Zhao J, Zhang H, Chen W. 2019. Disturbance of trace element and gut microbiota profiles as indicators of autism spectrum disorder: a pilot study of Chinese children. Environ Res 171:501–509, PMID: , 10.1016/j.envres.2019.01.060. [DOI] [PubMed] [Google Scholar]
Associated Data
This section collects any data citations, data availability statements, or supplementary materials included in this article.