

Supplemental digital content is available in the text.
Key Words: growth hormone pituitary adenoma, pathological subtype, magnetic resonance imaging, logistic regression model
Purpose
This study aimed to investigate the value of magnetic resonance (MR) characteristics in differentiating the subtypes of growth hormone pituitary adenomas.
Materials and Methods
The clinical and MR imaging data of 70 patients with growth hormone pituitary adenoma confirmed by surgery and pathology were retrospectively analyzed. The tumors were divided into dense granular (DG; 36 cases) and sparse granular subtypes (SG; 34 cases). The tumors' MR features were analyzed, including the mean and maximum diameters, T2 signal intensity, T2 relative signal intensity (rSI), homogeneity, enhancement degree, and invasiveness (Knosp grade). Mann-Whitney U test and χ2 test were used to analyze MR characteristics between the 2 groups. The independent predictors and predictive probabilities of tumor subtypes were obtained via a logistic regression model, and the efficacy was compared by receiver operating characteristic curve.
Results
The mean and maximum diameters of growth hormone adenoma in DG and SG were 1.77 versus 2.45 and 1.95 versus 3.00 cm (median, P < 0.05), respectively. There was a significant difference between the 2 groups in T2 signal intensity and rSI (P values were 0.02 and 0.001, respectively). Most DG adenomas (86.1%) appeared as hypointense on T2 images, and 38.2% of SG adenomas were hyperintense. There was no significant difference in tumor homogeneity (P = 0.622). A significant difference was found in the Knosp grade between the 2 subtypes (P = 0.004). In addition, the enhancement degree of SG adenomas was significantly higher than that of DG adenomas (P = 0.001). Logistic regression analysis showed that high T2 rSI value and marked contrast enhancement were independent predictors of the 2 subtypes, and the odds ratios were 4.811 and 4.649, respectively. The multivariate logistic model obtained relatively high predicting efficacy, and the area under the curve, sensitivity, and specificity were 0.765, 0.882, and 0.500, respectively.
Conclusions
There are significant differences in tumor size, T2 signal intensity, T2 rSI, enhancement degree, and invasiveness between DG and SG adenomas. The logistic model based on the marked contrast enhancement and high T2 rSI value has an important value in predicting the subtype of growth hormone adenoma.
As the leading cause of acromegaly, growth hormone (GH) pituitary adenomas have a high incidence, secondary only to nonfunctioning pituitary adenomas and prolactinomas.1 According to the granulation morphology, they are divided into densely granulated (DG) and sparsely granulated (SG) adenomas.2 Surgery is currently the primary treatment of GH adenomas.3,4 Compared with DG somatotroph adenomas, SG adenomas are larger, are more invasive, and have a worse prognosis.5,6 The aforementioned characteristics are closely related to the choice of surgical approach and scope of resection for GH adenomas and may affect the outcome of surgery.7,8 Therefore, it is useful to accurately predict the subtypes of GH adenomas before surgery.
At present, the diagnosis and evaluation of pituitary tumors mainly relies on magnetic resonance imaging (MRI). Previous studies have confirmed that magnetic resonance (MR) signal can reflect GH adenoma histological characteristics, and the T2 signal intensity is significantly related to its histological subtypes.9–11 On T2-weighted imaging (T2WI), most DG adenomas show low signal intensity, whereas SG adenomas show high signal intensity and are more aggressive and larger in size.12,13 However, the aforementioned studies are based on a single T2 sequence, which may not fully reflect the characteristics of GH adenoma subtypes. As far as we know, there is no related research on the combination of multisequence MRI for differentiating the subtypes of GH adenomas.
The present study aimed to explore the MRI characteristics of GH adenomas and determine the potential value of multisequence MRI in predicting the GH adenoma subtypes.
SUBJECTS AND METHODS
Patients
This retrospective single-center study was approved by the local ethics committee, and informed consent was waived according to its retrospective nature. This study was conducted in accordance with the Declaration of Helsinki.
Between October 2015 and January 2021, 70 patients with GH pituitary adenomas were included in this study. Pituitary protocol multisequence MRI was performed in all patients. The inclusion criteria were as follows: (a) patients with GH pituitary adenoma proved by pathological analysis and the subtypes confirmed by immunohistochemical staining, and (b) patients with baseline pituitary MR images, including the contrast-enhanced sequence. The exclusion criteria were as follows: (a) patients with drug therapy or radiotherapy before surgery and (b) poor image quality or obvious artifact.
MRI and Image Analysis
All preoperative MRI examinations were performed using a 3.0-T whole-body system (MR750; GE Healthcare, Milwaukee, Wisconsin) with a 40-mT/m maximum gradient capability and a standard receive-only head coil. Pituitary MRI protocols included precontrast coronal T1-weighted imaging (repetition time [TR]/echo time [TE], 441 ms/minimum; field of view [FOV], 220 mm; matrix size, 288 × 224; number of excitation [NEX], 4; slice thickness, 1.6 mm; gap, 0.3 mm), coronal T2WI (TR/TE, 441 ms/minimum; FOV, 220 mm; matrix size, 288 × 224; NEX, 4; slice thickness, 1.6 mm; gap, 0.3 mm), sagittal T2WI (TR/TE, 4312 ms/115 ms; FOV, 220 mm; matrix size, 288 × 224; NEX, 4; slice thickness, 1.6 mm; gap, 0.3 mm). Subsequently, coronal and sagittal contrast-enhanced T1-weighted imaging (imaging parameters were the same as precontrast sequences) were obtained 3 minutes, 16 seconds after intravenous bolus injection of 0.1 mmol/kg bodyweight of gadodiamide (Omniscan; GE Healthcare, Co, Cork, Ireland) at a rate of 0.2 mL/s.
All image data were stored in DICOM format after the anonymization process. The images of all cases were analyzed by 2 radiologists. The observers were told before the review that the patients had pituitary adenoma, but they were blinded to the definite histological subtypes. If the interpretation results were inconsistent, the 2 observers were agreed upon after negotiation.
The multisequence MR images were analyzed to determine the tumor size, homogeneity, T2 signal intensity, T2 relative signal intensity (rSI), contrast enhancement, and invasiveness (Knosp grade). The parameters are defined as follows: (1) tumor size: we defined the horizontal (a) and height (b) diameters of the tumor on the maximal coronal section, and the anteroposterior diameter measured as (c) in the maximal transverse axial plane. Then the mean diameter was calculated by (a + b + c)/3 and choose the longest diameter of a, b, and c as maximum diameter. (2) Homogeneity: the homogeneity was recorded as almost homogeneous or heterogeneous based on T2 and signal intensity change compared between precontrast and postcontrast MR images, and heterogeneous was further subclassified as cystic necrosis and hemorrhage. (3) T2 signal intensity: the visual assessment method was used to determine the T2 signal intensity of each adenoma relative to the surrounding tissues, with the gray matter as the control tissue. An adenoma may appear as hypointense (signal lower than gray matter) or hyperintense (signal higher than gray matter). (4) T2 rSI: measure the rSI of the adenoma on an oval region of interest, which was placed in the solid part of the tumor on the coronal T2WI where the tumor appeared largest, avoiding large vessels, and hemorrhagic, cystic, and necrotic areas. Then, the T2 rSI value is calculated by the ratio of tumor SI to normal frontal lobe gray matter SI.14 (5) Enhancement degree: the degree of tumor contrast enhancement was scored as mild or moderate (enhancement degree of tumor solid portion is significantly lower than that of the blood pool), and marked contrast enhancement (enhancement degree of tumor solid portion is close to that of the blood vessel). (6) Invasiveness: the invasion of surrounding tissues was evaluated based on Knosp grade.15 To facilitate assessment, we simplified them into 3 categories, which correspond to Knosp grades 0–1, 2–3, and 4, respectively.
Statistics Analysis
SPSS 20.0 program (SPSS for Windows; SPSS Inc, Chicago, Illinois) was used for data analysis. The quantitative data were expressed as mean ± SD, and the qualitative data were expressed as rate or percentage. The χ2 test was used to compare the differences of sex, clinical manifestation, tumor size, homogeneity, and signal intensity between the 2 groups. Mann-Whitney U test was used to determine the differences of independent continuous variables between groups. Cohen κ coefficient with 95% confidence interval was used to assess the level of agreement in MR qualitative parameters between the 2 readers, and κ values were interpreted as follows: poor, 0.00–0.20; fair, 0.21–0.40; moderate, 0.41–0.60; good, 0.61–0.80; and excellent, 0.81–1.00. Taking the score corresponding to the statistically significant features as the independent variable and group of the DG or SG adenomas as the dependent variable, the binary logistic regression analysis was conducted, and the regression model was established. The receiver operating characteristic curve analysis was carried out for each single factor parameter, and the predicted probability value of the regression model, and the area under the curve (AUC), sensitivity, and specificity were calculated. P < 0.05 was statistically significant.
RESULTS
Demographic Characteristics
Table 1 exhibits the baseline characteristics of 70 GH adenomas, including 36 DG (21 men, 15 women; mean age, 42 ± 12 years) and 34 SG adenomas (11 men, 23 women; mean age, 40 ± 12 years). There was a significant difference in sex (P = 0.029), but no significant difference in age (P = 0.306) and clinical manifestations (P = 0.135). The major clinical features of the patients included headache (19 of 36 DG and 20 of 34 SG patients), acromegaly (13 of 36 DG and 14 of 34 SG patients), and no symptom in 4 DG patients (11.1%).
TABLE 1.
Demographic Characteristics of 70 Patients With GH Pituitary Adenoma
| Variable | DG (n = 36) | SG (n = 34) | t/χ2 | P |
|---|---|---|---|---|
| Age, mean ± SD, y | 42 ± 12 | 40 ± 12 | 37.640 | 0.306 |
| Sex (M/F) | 21/15 | 11/23 | 4.756 | 0.029 |
| Clinical manifestations, n (%) | 4.009 | 0.135 | ||
| Headache | 19 (52.8) | 20 (58.8) | ||
| Acromegaly | 13 (36.1) | 14 (41.2) | ||
| None | 4 (11.1) | 0 (0) |
Comparison of MRI Features Between the DG and SG Groups
Table 2 and Figures 1 and 2 show the MRI features of DG and SG adenomas. Overall, multiple parameters demonstrated significant differences between the 2 subtypes of GH adenomas (all P < 0.05).
TABLE 2.
Comparison of MRI Features Between DG and SG GH Pituitary Adenomas
| Variable | DG (n = 36) | SG (n = 34) | z/χ2 | P |
|---|---|---|---|---|
| Tumor size, median (IQR), cm | ||||
| Mean diameter | 1.767 (1.308–2.433) | 2.450 (1.725–2.792) | 2.104 | 0.035* |
| Mean diameter | 6.507 | 0.039 | ||
| <1.5 | 13 (37.1) | 6 (17.6) | ||
| 1.5–2.2 | 10 (28.6) | 6 (17.6) | ||
| >2.2 | 12 (34.3) | 22 (64.7) | ||
| Maximum diameter | 1.950 (1.500–2.850) | 3.000 (1.975–3.325) | 2.523 | 0.012* |
| Maximum diameter | 6.050 | 0.049 | ||
| <1.6 | 19 (52.8) | 9 (26.5) | ||
| 1.6–2.3 | 10 (17.8) | 12 (35.3) | ||
| >2.3 | 7 (19.4) | 13 (38.2) | ||
| Homogeneity, n (%) | 0.243 | 0.622 | ||
| Homogeneous | 18 (50) | 19 (55.9) | ||
| Heterogeneous | 18 (50) | 15 (44.1) | 0.000 | 1.000 |
| Cystic necrosis | 12 (33.3) | 10 (29.4) | ||
| Hemorrhage | 6 (16.7) | 5 (14.7) | ||
| T2 signal intensity, n (%) | 5.426 | 0.020 | ||
| Hypointense | 31 (86.1) | 21 (61.8) | ||
| Hyperintense | 5 (13.9) | 13 (38.2) | ||
| T2 rSI, n (%) | 10.212 | 0.001 | ||
| <1 | 30 (83.3) | 16 (47.1) | ||
| >1 | 6 (16.7) | 18 (52.9) | ||
| Contrast enhancement, n (%) | 10.380 | 0.001 | ||
| Mild-moderate | 21 (58.3) | 7 (20.6) | ||
| Marked | 15 (41.7) | 27 (79.4) | ||
| Knosp grade, n (%) | 11.187 | 0.004 | ||
| 0–1 | 17 (47.2) | 5 (14.7) | ||
| 2–3 | 16 (44.4) | 18 (52.9) | ||
| 4 | 3 (8.3) | 11 (32.3) |
*Comparisons between groups using the Mann-Whitney U test.
IQR indicates interquartile range.
FIGURE 1.
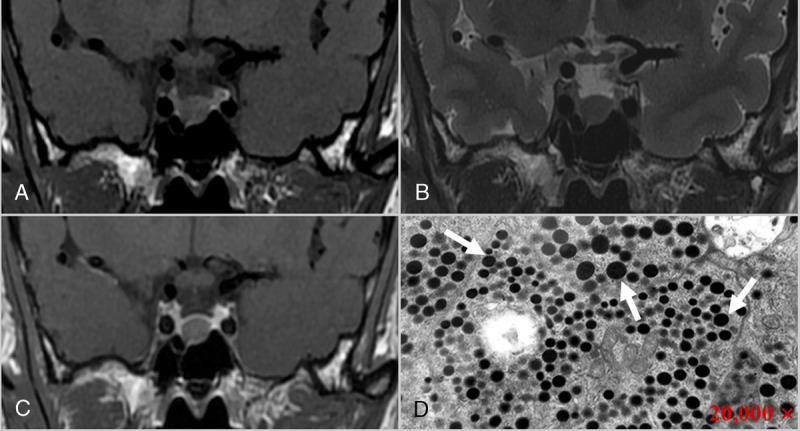
A 53-year-old man with DG adenoma, presenting with a headache. Coronal T1 (A), T2 (B), and contrast-enhanced T1-weighted images (C) reveal a homogeneous mass in the sellar region, which appeared as isointense on T1 and slightly hypointense on T2 images, with mild enhancement after contrast enhancement and Knosp grade 0. D, Electron microscopy shows that round secretory granules of varying sizes are seen in the tumor cytoplasm (arrows), and most of the tumor cells have more secretory granules (×20,000).
FIGURE 2.
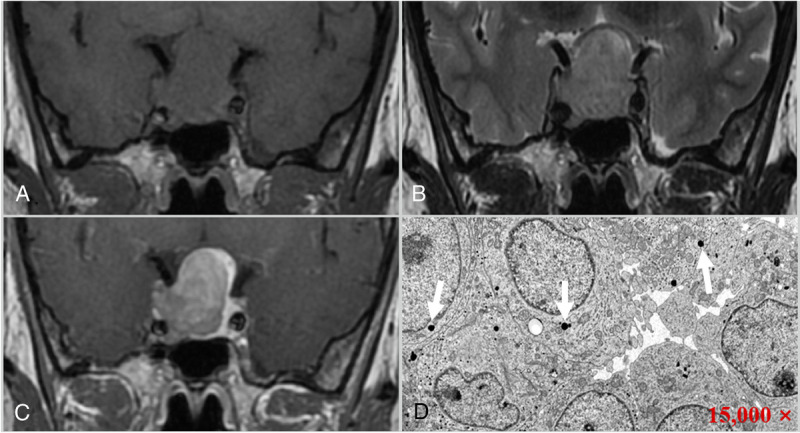
A 33-year-old woman with SG adenoma, presenting with a headache. Coronal T1 (A), T2 (B), and contrast-enhanced T1-weighted images (C) reveal a homogeneous mass in the sellar region, which appeared as isointense on T1 and hyperintense on T2 images, with marked enhancement after contrast enhancement and Knosp grade 3 (right). D, Electron microscopy shows that a few round secretory granules of varying sizes are seen in the tumor cytoplasm (arrows), and most of the tumor cells have few secretory granules (15,000 ×).
The mean and maximum diameters of SG (2.45 and 3.00 cm) were larger than those in DG adenomas (1.77 and 1.95 cm). Of the 36 patients with DG adenomas, 31 of 36 DG adenomas appeared hyperintense, whereas only 21 of 34 SG adenomas appeared hyperintense on T2WI. Similarly, the T2 rSI value was less than 1 in 30 (83.3%) DG and 16 (47.1%) SG tumors. As for the enhancement degree, 21 (58.3%) DG adenomas demonstrated mild or moderate enhancement; however, marked enhancement was found in 27 (79.4%) of SG adenomas. In addition, low Knosp grade (grade 0–1) was mainly found in DG adenomas (17; 47.2%), and Knosp grade 2–3 was demonstrated in 16 (44.4%) DG and 18 (52.9%) SG adenomas; only 3 DG and 11 SG adenomas were Knosp grade 4. With regard to the homogeneity, no significant differences were found between the 2 subtypes (P = 0.622).
In addition, Cohen κ coefficients were calculated to evaluate the reliability of the MR qualitative variables. Cohen κ coefficients were 1.000, 0.861, 0.912, and 0.712 between the 2 readers for homogeneity, T2 signal intensity, contrast enhancement, and Knosp grade, respectively (Supplemental Table 1, http://links.lww.com/RCT/A127).
Multivariate Analysis for Differentiating Subtypes of GH Pituitary Adenomas
Statistically significant indicators after univariate analysis, such as sex, maximum tumor diameter, T2 signal intensity, T2 rSI, contrast enhancement, and Knosp grade, were included in the logistic regression analysis. The results showed that only the high T2 rSI (β = 1.571; odds ratio, 4.811; P = 0.008) and the marked contrast enhancement (β = 1.537; odds ratio, 4.649; P = 0.007) were independent predictors of pituitary adenoma subtypes (Table 3). In other words, for high T2 rSI value (>1) and marked contrast enhancement, the odds of SG adenomas are 4.811 and 4.649 times, respectively.
TABLE 3.
Multivariable Logistic Regression Model in Predicting the Subtypes of GH Pituitary Adenoma
| Variable | β | SE | OR (95% CI) | P |
|---|---|---|---|---|
| High T2 rSI (>1) | 1.571 | 0.596 | 4.811 (1.495–15.485) | 0.008 |
| Marked enhancement | 1.537 | 0.573 | 4.649 (1.511–14.299) | 0.007 |
CI indicates confidence interval; OR, odds ratio.
Efficacy Analysis for Logistic Regression Model and Univariate MR Features
Based on the predictive probability values derived from the logistic regression model and univariate MR features for differentiating the subtypes of GH pituitary adenomas, receiver operating characteristic analysis was performed (Fig. 3). The logistic regression model demonstrated relatively high predicting efficacy, and the AUC, sensitivity, and specificity were 0.765, 0.882, and 0.500, respectively (Table 4).
FIGURE 3.
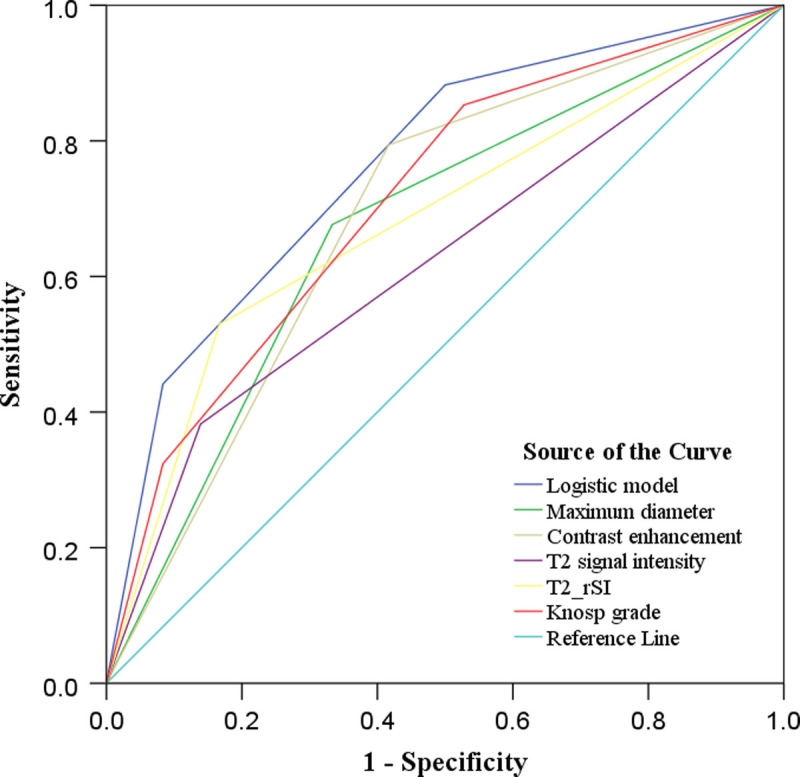
Receiver operating characteristic curve of multivariate logistic regression model and univariate MR parameters in predicting GH adenoma subtypes. Multivariate logistic model yields relatively high predicting efficacy, and the AUC, sensitivity, and specificity are 0.765, 0.882, and 0.500, respectively. Figure 3 can be viewed online in color at www.jcat.org.
TABLE 4.
Efficacy Analysis of Multivariable Logistic Regression Model and Univariate MR Features in Differentiating the Subtypes of GH Pituitary Adenoma
| Variable | AUC (95% CI) | Sensitivity | Specificity |
|---|---|---|---|
| Predictive model | 0.765 (0.653–0.876) | 0.882 | 0.500 |
| Maximum diameter | 0.672 (0.544–0.800) | 0.676 | 0.667 |
| T2 signal intensity | 0.622 (0.489–0.754) | 0.794 | 0.583 |
| T2 rSI | 0.681 (0.554–0.809) | 0.382 | 0.861 |
| Contrast enhancement | 0.689 (0.563–0.815) | 0.529 | 0.833 |
| Knosp grade | 0.712 (0.592–0.833) | 0.853 | 0.472 |
CI indicates confidence interval.
DISCUSSION
The subtypes and invasiveness of GH adenomas are closely related to its surgical planning. For example, complete resection in invasive macroadenomas with high Knosp grades means greater surgical risk, so when adenomas invade the lateral compartment of the cavernous sinus, the surgeons should avoid this specific region where the cranial nerves reside.16 In addition, for invasive adenomas, an aggressive approach into the cavernous sinus is required by using a magnification device or intraoperative imaging for radical resection of the tumor.17 Meanwhile, compared with SG adenomas, DG adenoma has a significantly higher remission rate in response to medical therapy with somatostatin analogs.18 However, the subtypes cannot be evaluated preoperatively and can only be confirmed by histopathology after an operation. Besides, there are few reports on the comprehensive evaluation of GH pituitary adenomas by combining multiple MR features.19,20
This study analyzed the value of multisequence MRI in predicting the subtypes of GH adenomas. Significant differences were found in tumor size, T2 signal intensity, T2 rSI, enhancement degree, and invasiveness between DG and SG adenomas. In addition, high T2 rSI value and marked contrast enhancement were independent predictors based on a logistic regression model, with high efficacy in differentiating 2 subtypes of GH adenomas. This model offers promising value in the preoperative subtyping of GH adenomas with implications for treatment planning. Meanwhile, the multivariate regression model has an important value in predicting GH adenoma subtypes.
In this study, most patients with GH adenoma had headache symptoms, but there was no significant statistical difference between DG and SG patients, which is consistent with previous research.21 Growth hormone and prolactin are closely related to headaches in patients with hormone-secreting pituitary adenomas,22 which may be the leading cause of headache in patients with pituitary adenoma. Also, our results show that acromegaly is another primary clinical manifestation in patients with GH adenomas, which is related to the GH secretion by the adenomas. In our study group, DG was more common in men, whereas SG was more common in women. Although there was no statistically significant difference in the onset age between the 2 subtypes, the age of SG was slightly lower than that of DG patients, which is consistent with the previous studies.1,23
The invasiveness of pituitary adenoma is closely related to its size, determining the clinical surgical plan and prognosis.24,25 Previous studies have shown that GH adenomas' volume or diameter is closely associated with its pathological subtypes.26 This study confirms that the mean diameter and maximum diameter of SG adenomas are significantly larger than that of DG adenomas, consistent with previous research.27 Similarly, this study reveals that DG adenomas are mostly low-invasive tumors (Knosp grade 0–1), whereas Knosp grade 4 is mainly found in SG adenomas. Therefore, compared with DG adenoma, SG adenoma has a higher Knosp grade or invasiveness. A recent study show that the differential proteins of SG adenoma mainly enrich the invasion and proliferation functions at the proteome level, and cadherin-1 and catenin β-1 play a critical role in the different biological features of the 2 adenoma subtypes,28 which may potentially explain why these 2 subtypes have different invasiveness.
T2 signal intensity is closely related to the histological characteristics of GH adenomas.9–11,29 On T2WI, most DG adenomas appear hypointense, whereas most SG adenomas appear hyperintense.30–32 At the same time, our research has obtained similar results: most DG adenomas (86.1%) appeared as hypointense on T2 images, and 38.2% of the SG adenomas were hyperintense. Compared with visual evaluation, quantitative T2 rSI can more objectively reflect the difference in tumor signal intensity. This study shows that the T2 rSI value of SG adenomas is usually larger than 1, reflecting its hyperintense in visual evaluation. Although the pathophysiological mechanism of the relationship between T2 signal and the pathological subtype of GH adenomas is not fully understood, a low T2 signal is associated with high collagen content within tumors.33 In addition, the difference in secreted granules may affect T2 signal, and DG adenomas contain a large number of secretory granules, which may be the main reason for low T2 signal.34
At present, few studies have reported on the contrast enhancement characteristics of GH adenoma subtypes. This study found a significant difference between the 2 subtypes, with DG adenomas enhancing less avidly than SG adenomas. The enhancement degree of most DG adenomas was lower than that of SG adenomas. Histologically, the pituitary has a unique acinar structure composed of hard reticulin. Invasive adenomas may destroy their reticulin wall,35 allowing more contrast to leak into the tumor and thus resulting in more avid enhancement. In addition, the microvessel density of pituitary adenomas is closely related to tumor invasiveness.36,37 The invasiveness of DG adenomas is lower than that of SG adenomas, and the microvessel density of SG adenoma tissue is correspondingly higher. These may lead to a more significant contrast enhancement in SG adenomas.
There were several limitations of this study. First, we calculated rSI value by drawing the region of interest of focal tumor areas, which could introduce sampling bias. Second, the sample size was relatively small. Further study with a large number of GH adenoma patients for elucidating this research question is warranted.
In conclusion, MR characteristics vary between DG and SG GH-secreting pituitary adenoma subtypes. We present a multivariate logistic model based on the enhancement degree and T2 rSI, which offers promise for preoperative GH adenoma subtyping.
Supplementary Material
ACKNOWLEDGMENTS
We would like to thank Dr Xiao-Cheng Wei in GE Healthcare China for providing technical support regarding the appropriate applied MRI sequence. This work was supported by the Science and Technology Innovation Development Foundation of Tangdu Hospital (No. 2017LCYJ004).
Footnotes
C.-X.L. and S.-Z.W. contributed equally to this article.
Our article did not received funding for research from any of the following organizations: National Institutes of Health, Wellcome Trust, and Howard Hughes Medical Institute.
The authors declare no conflict of interest.
Supplemental digital contents are available for this article. Direct URL citations appear in the printed text and are provided in the HTML and PDF versions of this article on the journal’s Web site (www.jcat.org).
Contributor Information
Chen-Xi Liu, Email: 936572562@qq.com.
Sheng-Zhong Wang, Email: 18435831120@163.com.
Li-Jun Heng, Email: henglijunfmmu@163.com.
Yu Han, Email: hanyu0920@163.com.
Yu-Hui Ma, Email: yulinmyh@163.com.
Lin-Feng Yan, Email: ylf8342@163.com.
Ying Yu, Email: yytdfsk@fmmu.edu.cn.
Wen Wang, Email: wangwen@fmmu.edu.cn.
Yu-Chuan Hu, Email: hyc3140@126.com.
REFERENCES
- 1.Colao A Grasso LFS Giustina A, et al. Acromegaly. Nat Rev Dis Primers. 2019;5:20. [DOI] [PubMed] [Google Scholar]
- 2.Mete O, Lopes MB. Overview of the 2017 WHO classification of pituitary tumors. Endocr Pathol. 2017;28:228–243. [DOI] [PubMed] [Google Scholar]
- 3.Molitch ME. Diagnosis and treatment of pituitary adenomas: a review. JAMA. 2017;317:516–524. [DOI] [PubMed] [Google Scholar]
- 4.Buchfelder M, Schlaffer SM. The surgical treatment of acromegaly. Pituitary. 2017;20:76–83. [DOI] [PubMed] [Google Scholar]
- 5.Lopes MBS. The 2017 World Health Organization classification of tumors of the pituitary gland: a summary. Acta Neuropathol. 2017;134:521–535. [DOI] [PubMed] [Google Scholar]
- 6.Inoshita N, Nishioka H. The 2017 WHO classification of pituitary adenoma: overview and comments. Brain Tumor Pathol. 2018;35:51–56. [DOI] [PubMed] [Google Scholar]
- 7.Buchfelder M, Schlaffer S-M. Novel techniques in the surgical treatment of acromegaly: applications and efficacy. Neuroendocrinology. 2016;103:32–41. [DOI] [PubMed] [Google Scholar]
- 8.Nishioka H Fukuhara N Horiguchi K, et al. Aggressive transsphenoidal resection of tumors invading the cavernous sinus in patients with acromegaly: predictive factors, strategies, and outcomes. J Neurosurg. 2014;121:505–510. [DOI] [PubMed] [Google Scholar]
- 9.Heck A Emblem KE Casar-Borota O, et al. Quantitative analyses of T2-weighted MRI as a potential marker for response to somatostatin analogs in newly diagnosed acromegaly. Endocrine. 2015;52:333–343. [DOI] [PubMed] [Google Scholar]
- 10.Potorac I Petrossians P Daly AF, et al. Pituitary MRI characteristics in 297 acromegaly patients based on T2-weighted sequences. Endocr Relat Cancer. 2015;22:169–177. [DOI] [PubMed] [Google Scholar]
- 11.Heck A Emblem KE Casar-Borota O, et al. MRI T2 characteristics in somatotroph adenomas following somatostatin analog treatment in acromegaly. Endocrine. 2015;53:327–330. [DOI] [PubMed] [Google Scholar]
- 12.Potorac I, Beckers A, Bonneville JF. T2-weighted MRI signal intensity as a predictor of hormonal and tumoral responses to somatostatin receptor ligands in acromegaly: a perspective. Pituitary. 2017;20:116–120. [DOI] [PubMed] [Google Scholar]
- 13.Alhambra-Exposito MR Ibanez-Costa A Moreno-Moreno P, et al. Association between radiological parameters and clinical and molecular characteristics in human somatotropinomas. Sci Rep. 2018;8:6173. [DOI] [PMC free article] [PubMed] [Google Scholar]
- 14.Bonneville F Riviere LD Petersenn S, et al. MRI T2 signal intensity and tumor response in patients with GH-secreting pituitary macroadenoma: PRIMARYS post-hoc analysis. Eur J Endocrinol. 2018:EJE-18-0254.R2. [DOI] [PubMed] [Google Scholar]
- 15.Mooney MA Hardesty DA Sheehy JP, et al. Interrater and intrarater reliability of the Knosp scale for pituitary adenoma grading. J Neurosurg. 2017;126:1714–1719. [DOI] [PubMed] [Google Scholar]
- 16.Torres A Sanmillan JL Lau R, et al. Final outcome in growth hormone-secreting adenomas after combination of maximal tumor resection and medical treatment. World Neurosurg. 2021;154:e292–e301. [DOI] [PubMed] [Google Scholar]
- 17.Buchfelder M, Schlaffer SM. Intraoperative magnetic resonance imaging during surgery for pituitary adenomas: pros and cons. Endocrine. 2012;42:483–495. [DOI] [PubMed] [Google Scholar]
- 18.Kiseljak-Vassiliades K Carlson NE Borges MT, et al. Growth hormone tumor histological subtypes predict response to surgical and medical therapy. Endocrine. 2015;49:231–241. [DOI] [PMC free article] [PubMed] [Google Scholar]
- 19.Galm BP Buckless C Swearingen B, et al. MRI texture analysis in acromegaly and its role in predicting response to somatostatin receptor ligands. Pituitary. 2020;23:212–222. [DOI] [PubMed] [Google Scholar]
- 20.Amano T Masumoto T Akutsu H, et al. The utility of dynamic MRI in differentiating the hormone-producing ability of pituitary adenomas. Jpn J Radiol. 2021;39:741–748. [DOI] [PMC free article] [PubMed] [Google Scholar]
- 21.Lavrentaki A Paluzzi A Wass JAH, et al. Epidemiology of acromegaly: review of population studies. Pituitary. 2017;20:4–9. [DOI] [PMC free article] [PubMed] [Google Scholar]
- 22.Samarasinghe S, Emanuele MA, Mazhari A. Neurology of the pituitary. Handb Clin Neurol. 2014;120:685–701. [DOI] [PubMed] [Google Scholar]
- 23.Lopes MBS. Growth hormone-secreting adenomas: pathology and cell biology. Neurosurg Focus. 2010;29:E2. [DOI] [PubMed] [Google Scholar]
- 24.Hayhurst C Taylor PN Lansdown AJ, et al. Current perspectives on recurrent pituitary adenoma: the role and timing of surgery vs adjuvant treatment. Clin Endocrinol (Oxf). 2020;92:89–97. [DOI] [PubMed] [Google Scholar]
- 25.Liu H Zhang Q Hang W, et al. Analysis of correlation between magnetic resonance imaging features and prognosis of invasive pituitary adenoma. Zhonghua Er Bi Yan Hou Tou Jing Wai Ke Za Zhi. 2020;55:926–933. [DOI] [PubMed] [Google Scholar]
- 26.Obari A Sano T Ohyama K, et al. Clinicopathological features of growth hormone-producing pituitary adenomas: difference among various types defined by cytokeratin distribution pattern including a transitional form. Endocr Pathol. 2008;19:82–91. [DOI] [PubMed] [Google Scholar]
- 27.Bonneville F Rivière L-D Petersenn S, et al. PRIMARYS Study Group . MRI T2 signal intensity and tumor response in patients with GH-secreting pituitary macroadenoma: PRIMARYS post-hoc analysis. Eur J Endocrinol. 2019;180:155–164. [DOI] [PubMed] [Google Scholar]
- 28.Tang Y Xie T Wu S, et al. Quantitative proteomics revealed the molecular characteristics of distinct types of granulated somatotroph adenomas. Endocrine. 2021;74:375–386. [DOI] [PubMed] [Google Scholar]
- 29.Park YW Kang Y Ahn SS, et al. Radiomics model predicts granulation pattern in growth hormone-secreting pituitary adenomas. Pituitary. 2020;23:691–700. [DOI] [PubMed] [Google Scholar]
- 30.Coopmans EC Schneiders JJ El-Sayed N, et al. T2-signal intensity, SSTR expression, and somatostatin analogs efficacy predict response to pasireotide in acromegaly. Eur J Endocrinol. 2020;182:595–605. [DOI] [PubMed] [Google Scholar]
- 31.Dogansen SC Yalin GY Tanrikulu S, et al. Clinicopathological significance of baseline T2-weighted signal intensity in functional pituitary adenomas. Pituitary. 2018;21:347–354. [DOI] [PubMed] [Google Scholar]
- 32.Heck A Ringstad G Fougner SL, et al. Intensity of pituitary adenoma on T2-weighted magnetic resonance imaging predicts the response to octreotide treatment in newly diagnosed acromegaly. Clin Endocrinol (Oxf). 2012;77:72–78. [DOI] [PubMed] [Google Scholar]
- 33.Zeynalova A Kocak B Durmaz ES, et al. Preoperative evaluation of tumour consistency in pituitary macroadenomas: a machine learning-based histogram analysis on conventional T2-weighted MRI. Neuroradiology. 2019;61:767–774. [DOI] [PubMed] [Google Scholar]
- 34.Hagiwara A Inoue Y Wakasa K, et al. Comparison of growth hormone–producing and non-growth hormone–producing pituitary adenomas: imaging characteristics and pathologic correlation. Radiology. 2003;228:533–538. [DOI] [PubMed] [Google Scholar]
- 35.Yamamoto J Kakeda S Shimajiri S, et al. Tumor consistency of pituitary macroadenomas: predictive analysis on the basis of imaging features with contrast-enhanced 3D FIESTA at 3T. AJNR Am J Neuroradiol. 2014;35:297–303. [DOI] [PMC free article] [PubMed] [Google Scholar]
- 36.Iordanescu G Brendler C Crawford SE, et al. MRS measured fatty acid composition of periprostatic adipose tissue correlates with pathological measures of prostate cancer aggressiveness. J Magn Reson Imaging. 2015;42:651–657. [DOI] [PubMed] [Google Scholar]
- 37.Ghadir M Khamseh ME Panahi-Shamsabad M, et al. Cell proliferation, apoptosis, and angiogenesis in non-functional pituitary adenoma: association with tumor invasiveness. Endocrine. 2020;69:596–603. [DOI] [PubMed] [Google Scholar]
Associated Data
This section collects any data citations, data availability statements, or supplementary materials included in this article.