

Abstract
Purpose:
To determine the fundus Autofluorescence (FAF) lifetimes and spectral characteristics of individual drusen and hyperpigmentation independent of that of RPE in geographic atrophy (GA) areas in late-stage age-related macular degeneration (AMD).
Methods:
Three consecutive patients with complete retinal pigment epithelium (RPE) and outer retinal atrophy (cRORA) exhibiting drusen that were calcified or associated with hyperpigmentation were investigated with multimodal non-invasive ophthalmic imaging including color fundus photography (CFP), optical coherence tomography (OCT), near infrared reflectance (NIR), blue FAF, and fluorescence lifetime imaging ophthalmoscopy (FLIO). Fluorescence lifetimes were measured in two spectral channels (short wavelength spectral channel (SSC): 500–560 nm, long wavelength spectral channel (LSC): 560–720 nm).
Results:
Drusen lacking RPE coverage, as confirmed by CFP and OCT, had longer FAF-lifetimes than surrounding cRORA by 127±66 ps (SSC) and 113±48 ps (LSC, both p=0.008 in Wilcoxon-test, N=9) and by 209±100 ps (SSC) and 121±56 ps (LSC, p<0.001, N=14) in two patients. Hyperpigmentation in CFP in a third patient shows strong FAF with prolonged lifetimes. In the SSC, persistent FAF was found inside cRORA. A crescent-shaped hyperfluorescence in an area of continuous RPE but lacking outer retina was seen in one eye with a history of anti-VEGF treatment.
Conclusions:
Short-wavelength fluorescence in cRORA points to fluorophores beyond RPE organelles. Fluorescence properties of drusen within cRORA differ from in vivo drusen covered by RPE. These limited findings from three patients give new insight into the sources of FAF that can be further elucidated in larger cohorts.
Keywords: age-related macular degeneration, fundus autofluorescence, fluorescence lifetimes, drusen, hyperpigmentation, macular pigment, complete RPE and outer retinal atrophy
Introduction
State-of-the-art retinal imaging exploits different interactions of light with tissue, such as backscattering in color fundus photography (CFP), coherent reflection in OCT, and autofluorescence. Multimodal imaging combines the advantages of individual techniques, resulting in a comprehensive understanding of retinal pathology. Fundus autofluorescence (FAF) imaging is widely used in the diagnosis and management of age-related macular degeneration (AMD).
Recently, the development of fluorescence lifetime imaging ophthalmoscopy (FLIO) enabled the characterization of signals by their fluorescence lifetimes. FLIO measures the average time (on the order of picoseconds) fluorescent molecules remain in an excited electronic state after excitation by a short laser pulse. Thus, a measured lifetime is characteristic for the molecule and its embedding matrix. However, a variety of fluorophores can contribute signal in clinical FAF imaging, and the measurements rather characterize the state of tissue (Schweitzer et al. 2007). Furthermore, recording fluorescence in two spectral channels allows an estimation of emission spectra. While fluorophore mixtures found in lipofuscin and melano-lipofuscin, organelles of the retinal pigment epithelium (RPE), emit the strongest autofluorescence in the ocular fundus, FLIO also shows and discriminates other fluorophores with potential diagnostic merit (Dysli et al. 2017; Hammer et al. 2018; Hammer et al. 2020). The sources of these additional signals can be studied in the absence or perturbation of RPE. Furthermore, absence of RPE allows independent study of the macular pigment, which has very short fluorescence lifetimes (Sauer et al. 2015). Since lipid trafficking including macular pigment delivery to the retina might be involved in drusen formation (Curcio 2018), visualizing macular pigment via FLIO may enhance understanding of AMD pathology.
FAF lifetimes generally lengthen in AMD patients (Dysli et al. 2017; Sauer et al. 2018). The absence of RPE in complete RPE and outer retinal atrophy (cRORA) (Sadda et al. 2018) considerably lengthens measured lifetimes even further (Dysli et al. 2016; Sauer et al. 2017). Hyperpigmentation in non-neovascular AMD, which corresponds in part to hyperreflective foci in OCT and anteriorly migrated RPE in histology, have extended lifetimes (Dysli et al. 2017) as well as blue-shifted emission spectra compared to RPE in situ (Hammer et al. 2020). Clinical studies showed that drusenoid elevations of the RPE were associated with short emission wavelength (Hammer et al. 2020) but were discordant about their lifetimes (Dysli et al. 2017; Sauer et al. 2018; Hammer et al. 2020). In contrast, histologic studies showed shorter emission wavelengths (Tong et al. 2016) and longer fluorescence lifetimes (Schultz et al. 2020) for drusen content compared to overlying RPE. This discrepancy might result from the fact that RPE covering drusen may contribute variably to total FAF as seen in clinical projection images.
As the RPE is the cellular compartment with highest fluorescence intensity in the fundus, its absence in cRORA allows studying sources of fluorescence attributable to specific features of pathology. This effort is timely due to the recent availability of OCT-defined features important in progression to atrophy and in atrophy itself, from an international clinical consensus group (Jaffe et al. 2020). Thus, in the current investigation we specifically sought autofluorescent structures remaining in areas of cRORA. Identifying their identity by multimodal imaging including CFP, OCT, IR- and FAF imaging and describing their fluorescence properties will help to understand AMD pathology as well as to interpret FLIO images. Further findings, showing fluorescence from non-RPE sources, are described as well.
Methods
We report on three eyes of three AMD patients meeting the criteria of cRORA (Sadda et al. 2018; Jaffe et al. 2020). Patient #1 had non-exudative AMD with no history of choroidal neovascularization. Visual acuity of the eye was 20/20. Patient #2 has a history of neovascular AMD and a dry macula after 15 injections of Aflibercept (last injection 7 months before enrollment in this study); visual acuity was 20/125. Also, patient #3 had a history of treatment with anti-vascular endothelial growth factor (9x Aflibercept, last injection 10 months before enrollment) for neovascular AMD with macular hemorrhage. Visual acuity was 20/400. All investigations adhered to the Declaration of Helsinki, received institutional approval, and were performed after patients gave written consent. Multimodal fundus imaging included CFP, OCT (FF 450 and Cirrus 6000, both Carl Zeiss Meditec AG, Jena, Germany), and FLIO (Heidelberg Engineering GmbH, Heidelberg, Germany). FLIO uses the Spectralis scanner and optics and replaces the OCT capability by fluorescence lifetime measurement (Dysli et al. 2016; Dysli et al. 2017; Sauer et al. 2018; Hammer et al. 2020). FAF is excited with 470 nm wavelength light. Images display mean fluorescence decay times, derived from 3-exponential fitting of fluorescence decays, in two spectral channels (short, SSC: 500–560 nm; long, LSC: 560–720 nm), along with a near infrared reflectance (NIR) image. To characterize fluorescence spectra, the emission spectrum intensity ratio (ESIR, formerly called spectral ratio SR) was calculated (ratio of intensities in SSC vs. LSC). Fluorescence lifetimes and ESIR were averaged over specific structures using the software FLIMX (http://www.flimx.de).
cRORA was assumed from the hypofluorescence in LSC. The absence of RPE and outer retina was confirmed by OCT. Drusen within those areas were considered to be not covered by RPE. Regions of interest (ROI) were outlined manually in the fluorescence intensity images and transferred to the lifetime and ESIR images. To establish local contrasts, an area surrounding each ROI was segmented automatically. This 105-µm-wide area was 35 µm (one FLIO pixel) distant to the ROI.
Results
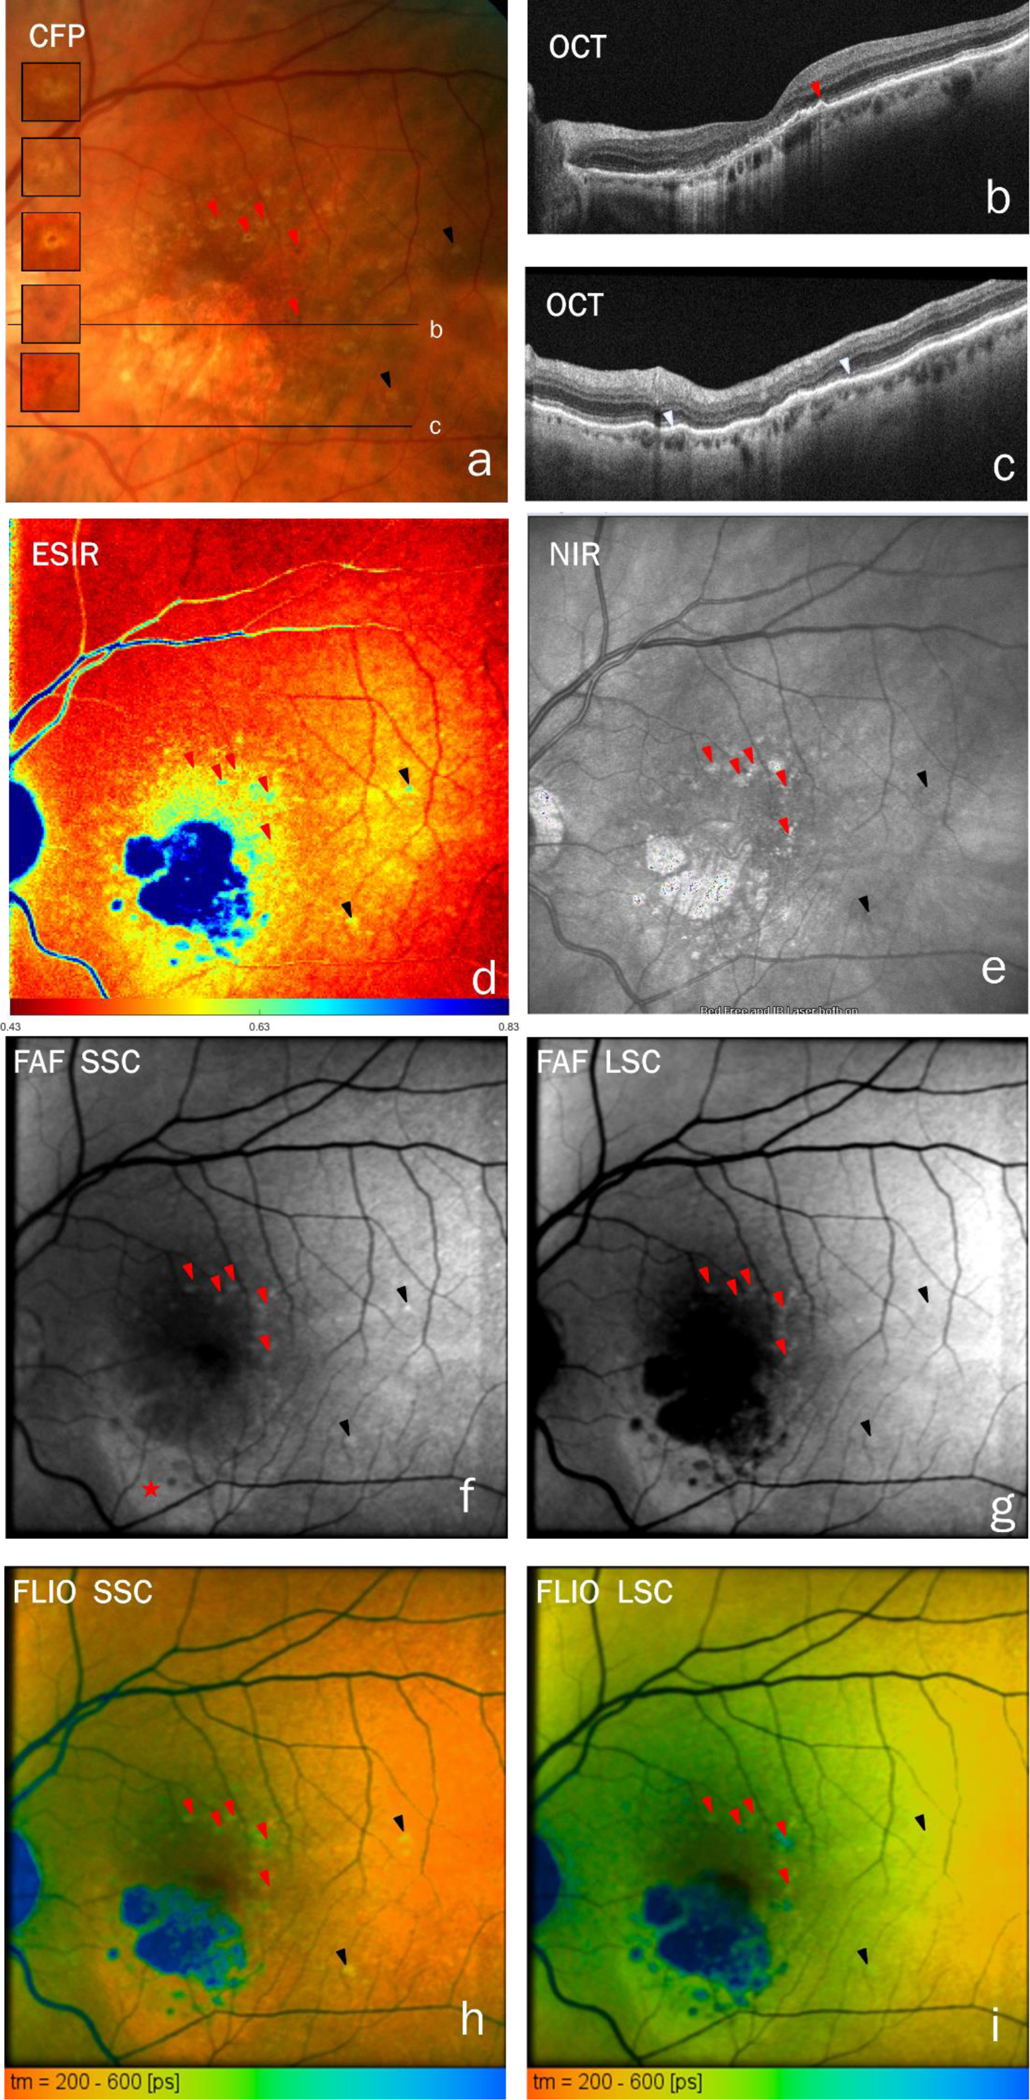
Multi-modal imaging comprising CFP, OCT, NIR, FAF, FLIO, and ESIR-imaging, is shown for three cases in figures 1–3. Figure 1 shows multifocal cRORA related to drusen in an 76-year-old male patient. Drusen inside cRORA are often glistening in CFP (a) as well as refractile in NIR (e) and have a hyporeflective core in OCT (b,c). Atrophic areas are bounded by descents of the external limiting membrane and penetration of light into the choroid (b,c, orange arrowheads). RPE atop drusen is present but appears compromised. Atrophic spots are seen around drusen at long wavelength FAF (LSC, g) but not at short wavelength (SSC, f). Figure 2 shows an 83-year-old female with a large central atrophy surrounded by multiple lobes of cRORA associated with drusen. Atrophic areas are bounded by descents of the external limiting membrane and penetration of light into the choroid in OCT (b,c,e,f orange arrowheads). Multiple drusen within lobes of cRORA appear in OCT as hyperreflective mounds, some with hyporeflective cores, on top of Bruch’s membrane (b, f). These drusen were hyperfluorescent, dominated by short-wavelength emission. A cRORA in an 79-year-old female, not related to drusen, is shown in Figure 3. Besides hyperpigmentation with long FAF lifetimes, a crescent-shaped hyperfluorescent area (asterisk in f) shows lack of outer retina at intact RPE (ORA) in OCT (c, between the two white arrow heads). Whereas cRORA is hyperreflective in NIR, the area of ORA is not (e).
Fig. 1:

Multifocal cRORA related to drusen in an 76-year-old male. a, b, c. Multiple drusen inside cRORA (white arrowheads show drusen from which lifetimes and ESIR were measured) are often glistening in CFP (a) as well as refractile in NIR (e) and have a hyporeflective core in OCT (b,c, scan locations are indicated in a, black arrowheads show additional drusen seen in OCT). Atrophic areas are bounded by descents of the external limiting membrane and penetration of light into the choroid (b,c, orange arrowheads). RPE atop drusen is present but appears compromised. f,g. Atrophic spots are seen around drusen at long wavelength FAF (LSC, g) but not at short wavelength (SSC, f). d. Consequently, ESIR showed short-wavelength emission of those areas. a,d-h. Drusen still covered by RPE but already showing prolongation of lifetimes in SSC and hypsochromic spectral shift (purple arrowheads). Panels h and i show color-coded lifetimes with an overlay of FAF intensity.
Fig. 3:
cRORA, not related to drusen, in an 79-year-old female. a, c-i. Red arrowheads indicate hyperpigmentation (mostly on top of soft drusen). This is hyperreflective in NIR (e) and show prolonged fluorescence lifetimes and shorter emission wavelength than surrounding RPE. c. In OCT (scan locations are indicated in a), a hyperpigmentation shows up as thickening of the RPE+basal lamina band (red arrowhead). The black arrowheads point to strongly hyperfluorescent drusen with overlaying RPE, which show long fluorescence lifetimes. A crescent-shaped hyperfluorescent area (asterisk in f) shows lack of outer retina at intact RPE (ORA) in OCT (c, between the two white arrow heads). Whereas the cRORA is hyperreflective in NIR, the area of ORA is not (e). Panels h and i show color-coded lifetimes with an overlay of FAF intensity.
Fig. 2:

Large central atrophy surrounded by multiple lobes of cRORA associated to drusen in an 83-year-old female. a, b, c, e, f. Atrophic areas are bounded by descents of the external limiting membrane and penetration of light into the choroid in OCT (b,c,e,f orange arrowheads). Multiple drusen (white arrowheads show drusen from which lifetimes and ESIR were measured) within lobes of cRORA appear in OCT as hyperreflective mounds, some with hyporeflective cores, on top of Bruch’s membrane (b, f, OCT scan locations are indicated in a, corresponding drusen in a and f are numbered). d, g, h. These drusen were hyperfluorescent, dominated by short-wavelength emission. The pink arrowhead indicates a druse that was hyperfluorescent in short spectral channel (SSC, g) but hypofluorescent in long spectral channel (LSC, h) and showed a hyporeflective core in OCT (c). i,j. Whereas drusen in cRORA have long lifetimes, short lifetimes persisted in the fovea despite RPE and outer retina atrophy. a, d, g-h. Black arrow heads indicate drusen still covered by RPE. These drusen were variable in FAF lifetime (i,j) and have slightly shorter emission wavelengths than RPE (d). g. Considerable short-wavelength fluorescence remains in the atrophy. Panels i and j show color-coded lifetimes with an overlay of FAF intensity.
In cases 1 and 2, respectively, 9 and 14 drusen were found inside lobes of cRORA (Figures 1–2). These had longer FAF-lifetimes than the surrounding cRORA by 127±66 ps (SSC) and 113±48 ps (LSC, p=0.008 for both in Wilcoxon-test) in case 1 and by 209±100 ps (SSC) and 121±56 ps (LSC, both p<0.001) in case 2. The ESIR was higher in drusen than in their surrounding in case 2 (1.00±0.062 vs 0.85±0.11, p<0.001) but was not distinguishable from that of their surroundings in case 1. Furthermore, we found persisting FAF in SSC inside the atrophy (figures 1f, 2g, and 3f), and remaining short fluorescence lifetimes in the central macula despite cRORA (figures 1–3). The dominance of the SSC fluorescence over that in LSC is shown by high ESIR (blue color in figures 1d, 2d, and 3d). Further findings are long FAF-lifetimes in hyperpigmented areas (Figure 3) and in fluorescence and NIR modalities a crescent-shaped hyperfluorescence in an area of continuous RPE with outer retinal atrophy (ORA, figure 3). FLIO panels in figures 1–3 show FAF lifetimes in an overlay with fluorescence intensity. The same images, in a format that omits the FAF intensity overlay, are presented in the supplemental figure S1.
Discussion
cRORA often initiates over large soft drusen, which may disappear or remain as calcified tombstone lesions after the atrophy of RPE and outer retina (Chen et al. 2020a). Here we present cases of drusen persisting in atrophy at the outer rim of cRORA. These drusen show autofluorescence of long lifetimes at short emission wavelength (case 2), in agreement with histology (Schultz et al. 2020). Fluorescent drusen components may include lipids, proteins, and minerals, and in late stage, avascular fibrosis. Comparable fluorescent components are found in atherosclerotic plaques (Park et al. 2012). Drusen often appeared glistening in CFP and hyporeflective in OCT, consistent with hydroxyapatite nodules (Tan et al. 2018). Nodules might contribute to fluorescence with long lifetimes, which remain unseen under a covering of RPE (Dysli et al. 2017; Sauer et al. 2018; Hammer et al. 2020).
One pathway to cRORA includes the anterior migration of RPE into the retina, clinically visible as hyperpigmented spots in CFP and hyperreflective foci in OCT (Curcio et al. 2017). Hyperpigmentation shows hyperfluorescence at short wavelengths with long lifetimes (Figure 3). Hyperpigmentation can be barely visible in CFP (Figure 3a) yet is clearly distinguishable in FLIO (Figures 3h and i); prolongation of FAF lifetimes indicate biochemical alteration of the fluorophores, the local environment, or both. In case 1, long lifetimes were found in SSC at drusen covered by RPE without signs of atrophy in OCT (data not shown) or FAF (purple arrowheads in Figure 1). FLIO signal might be dominated by the RPE, and the prolongation of lifetimes could be an early sign of cellular stress. Thus, FLIO might be helpful in characterizing RPE at risk.
The absence of the highly fluorescent RPE revealed more findings that are noteworthy: Whereas cRORA in FAF images usually appears almost non-fluorescent, the use of two spectral channels for fluorescence detection was able to demonstrate considerable fluorescence remaining in the atrophic area at 500–560 nm (figures 1f, 2g, and 3f). The origin of this signal is unlikely to be RPE organelles, as the RPE is absent in this area (figure 2e). It might result from basal laminar deposits, i.e., basement membrane-related material that can outlast RPE (Sura et al. 2020). On the other hand, short-wavelength fluorescence also could originate from the retina itself, as shown ex vivo (Hammer et al. 2018). Fluorescence signal can also arise from collagen or elastin in fibrotic scars. All these cellular or extracellular structures emit at shorter wavelengths than RPE (Schweitzer et al. 2007; Hammer et al. 2018; Schultz et al. 2020).
Like others (Dysli et al. 2016; Sauer et al. 2017), we found persistent short FAF lifetimes in central macula despite cRORA (Figure 2i and j). This signal was previously shown to arise from the macular pigment by comparison with reflectometry (Sauer et al. 2015). This finding is relevant to the cellular location of xanthophyll. Since Müller glia remain in the Henle fiber layer after photoreceptors die in cRORA, these cells are affirmed as reservoirs of macular pigment (Curcio 2018).
Another interesting finding is a crescent-shaped hyperfluorescence inferior to the macula that corresponds to outer retinal atrophy in OCT (fig. 3 b, f, and g) in case #3. Hyper-FAF can result from less light being absorbed by photoreceptor outer segments, which are absent, resulting in more light reaching fluorophores in an intact RPE layer. Photoreceptor loss and intact RPE may have arisen from a previous neovascular event, as speculated (Zanzottera et al. 2016) and shown by clinicopathologic correlation recently (Chen et al. 2020b). This macula was asymptomatic at the time of the current investigation; however, prior exudation may have dislodged photoreceptor outer segments (Zanzottera et al. 2016; Chen et al. 2020b). Similar findings of short lifetime are reported from central serous chorioretinopathy (Dysli et al. 2017). However, the origin of the fluorescence is considered to be different here as the chorioretinopathy patients suffer from a serous detachment of the photoreceptors from the RPE and, hence, possible accumulation rather than absence of photopigments.
The major limitation of this study is its restriction to only three eyes. The reason is that drusen disappear quickly after cRORA formation and, thus, such cases are rare. Despite the low number of cases, significantly longer lifetimes and higher ESIR could be demonstrated for drusen compared to their surroundings. However, it has to be stated that this result is based on two eyes only.
In conclusion, multi-modal imaging including CFP, OCT, NIR, and FLIO in cRORA and adjacent areas revealed signal sources for tissue autofluorescence, other than RPE organelles, such as drusen constituents, macular pigment and fluorophores in the retina or sub-RPE structures. These findings give insight into sources of FAF even from this limited number of patients. Thus, they may help establish hypotheses that should be tested in larger cohorts.
Supplementary Material
Acknowledgements:
Dr. Hammer holds patents on FLIO. Dr. Curcio received research support from Heidelberg Engineering GmbH, however not related to this work. None of the other authors have to declare a conflict of interests. No funding was received directly for this work. Collaboration on autofluorescence research was made possible by NIH grant 1R01EY027948 (cac, rts).
References
- Chen L, Messinger JD, Ferrara D, Freund KB & Curcio CA (2020a): Stages of Drusen-Associated Atrophy in Age-Related Macular Degeneration Visible via Histologically Validated Fundus Autofluorescence. Ophthalmology. Retina [DOI] [PMC free article] [PubMed]
- Chen L, Messinger J, Ferrara D, Freund KB & Curcio C (2020b): Fundus autofluorescence in neovascular age-related macular degeneration, a clinicopathologic correlation relevant to macular atrophy. Ophthalmology. Retina accepted. [DOI] [PMC free article] [PubMed]
- Curcio CA (2018): Antecedents of Soft Drusen, the Specific Deposits of Age-Related Macular Degeneration, in the Biology of Human Macula. Invest Ophthalmol Vis Sci 59: AMD182–AMD194. [DOI] [PMC free article] [PubMed] [Google Scholar]
- Curcio CA, Zanzottera EC, Ach T, Balaratnasingam C & Freund KB (2017): Activated Retinal Pigment Epithelium, an Optical Coherence Tomography Biomarker for Progression in Age-Related Macular Degeneration. Invest Ophthalmol Vis Sci 58: BIO211–BIO226. [DOI] [PMC free article] [PubMed] [Google Scholar]
- Dysli C, Berger L, Wolf S & Zinkernagel MS (2017): Fundus Autofluorescence Lifetimes and Central Serous Chorioretinopathy. Retina 37: 2151–2161. [DOI] [PMC free article] [PubMed] [Google Scholar]
- Dysli C, Fink R, Wolf S & Zinkernagel MS (2017): Fluorescence Lifetimes of Drusen in Age-Related Macular Degeneration. Invest Ophthalmol Vis Sci 58: 4856–4862. [DOI] [PubMed] [Google Scholar]
- Dysli C, Wolf S & Zinkernagel MS (2016): Autofluorescence Lifetimes in Geographic Atrophy in Patients With Age-Related Macular Degeneration. Invest Ophthalmol Vis Sci 57: 2479–2487. [DOI] [PubMed] [Google Scholar]
- Hammer M, Sauer L, Klemm M, Peters S, Schultz R & Haueisen J (2018): Fundus autofluorescence beyond lipofuscin: lesson learned from ex vivo fluorescence lifetime imaging in porcine eyes. Biomed Opt Express 9: 3078–3091. [DOI] [PMC free article] [PubMed] [Google Scholar]
- Hammer M, Schultz R, Hasan S, Sauer L, Klemm M, Kreilkamp L, Zweifel L, Augsten R & Meller D (2020): Fundus Autofluorescence Lifetimes and Spectral Features of Soft Drusen and Hyperpigmentation in Age-Related Macular Degeneration. Translational vision science & technology 9: 20. [DOI] [PMC free article] [PubMed] [Google Scholar]
- Jaffe GJ, Chakravarthy U, Freund KB, Guymer RH, Holz FG, Liakopoulos S, Mones JM, Rosenfeld PJ, Sadda SR, Sarraf D, Schmitz-Valckenberg S, Spaide RF, Staurenghi G, Tufail A & Curcio CA (2020): Imaging Features Associated with Progression to Geographic Atrophy in Age-Related Macular Degeneration: CAM Report 5. Ophthalmology. Retina [DOI] [PubMed]
- Park J, Pande P, Shrestha S, Clubb F, Applegate BE & Jo JA (2012): Biochemical characterization of atherosclerotic plaques by endogenous multispectral fluorescence lifetime imaging microscopy. Atherosclerosis 220: 394–401. [DOI] [PMC free article] [PubMed] [Google Scholar]
- Sadda SR, Guymer R, Holz FG, Schmitz-Valckenberg S, Curcio CA, Bird AC, Blodi BA, Bottoni F, Chakravarthy U, Chew EY, Csaky K, Danis RP, Fleckenstein M, Freund KB, Grunwald J, Hoyng CB, Jaffe GJ, Liakopoulos S, Mones JM, Pauleikhoff D, Rosenfeld PJ, Sarraf D, Spaide RF, Tadayoni R, Tufail A, Wolf S & Staurenghi G (2018): Consensus Definition for Atrophy Associated with Age-Related Macular Degeneration on OCT: Classification of Atrophy Report 3. Ophthalmology 125: 537–548. [DOI] [PMC free article] [PubMed] [Google Scholar]
- Sauer L, Gensure RH, Andersen KM, Kreilkamp L, Hageman GS, Hammer M & Bernstein PS (2018): Patterns of Fundus Autofluorescence Lifetimes In Eyes of Individuals With Nonexudative Age-Related Macular Degeneration. Invest Ophthalmol Vis Sci 59: AMD65–AMD77. [DOI] [PMC free article] [PubMed] [Google Scholar]
- Sauer L, Klemm M, Peters S, Schweitzer D, Schmidt J, Kreilkamp L, Ramm L, Meller D & Hammer M (2017): Monitoring foveal sparing in geographic atrophy with fluorescence lifetime imaging ophthalmoscopy - a novel approach. Acta Ophthalmol [DOI] [PubMed]
- Sauer L, Schweitzer D, Ramm L, Augsten R, Hammer M & Peters S (2015): Impact of Macular Pigment on Fundus Autofluorescence Lifetimes. Invest Ophthalmol Vis Sci 56: 4668–4679. [DOI] [PubMed] [Google Scholar]
- Schultz R, Gamage KCLK, Messinger JD, Curcio CA & Hammer M (2020): Fluorescence Lifetimes and Spectra of RPE and Sub-RPE Deposits in Histology of Control and AMD Eyes. Investigative Ophthalmology & Visual Science 61: 9. [DOI] [PMC free article] [PubMed] [Google Scholar]
- Schweitzer D, Schenke S, Hammer M, Schweitzer F, Jentsch S, Birckner E, Becker W & Bergmann A (2007): Towards metabolic mapping of the human retina. Microsc Res Tech 70: 410–419. [DOI] [PubMed] [Google Scholar]
- Sura AA, Chen L, Messinger JD, Swain TA, McGwin G Jr., Freund KB & Curcio CA (2020): Measuring the Contributions of Basal Laminar Deposit and Bruch’s Membrane in Age-Related Macular Degeneration. Invest Ophthalmol Vis Sci 61: 19. [DOI] [PMC free article] [PubMed] [Google Scholar]
- Tan ACS, Pilgrim MG, Fearn S, Bertazzo S, Tsolaki E, Morrell AP, Li M, Messinger JD, Dolz-Marco R, Lei J, Nittala MG, Sadda SR, Lengyel I, Freund KB & Curcio CA (2018): Calcified nodules in retinal drusen are associated with disease progression in age-related macular degeneration. Science translational medicine 10. [DOI] [PMC free article] [PubMed] [Google Scholar]
- Tong Y, Ben Ami T, Hong S, Heintzmann R, Gerig G, Ablonczy Z, Curcio CA, Ach T & Smith RT (2016): Hyperspectral Autofluorescence Imaging of Drusen and Retinal Pigment Epithelium in Donor Eyes with Age-Related Macular Degeneration. Retina 36 Suppl 1: S127–S136. [DOI] [PMC free article] [PubMed] [Google Scholar]
- Zanzottera EC, Ach T, Huisingh C, Messinger JD, Freund KB & Curcio CA (2016): Visualizing Retinal Pigment Epithelium Phenotypes in the Transition to Atrophy in Neovascular Age-Related Macular Degeneration. Retina-J Ret Vit Dis 36: S26–S39. [DOI] [PMC free article] [PubMed] [Google Scholar]
Associated Data
This section collects any data citations, data availability statements, or supplementary materials included in this article.