

Abstract
Objective
To present a comprehensive review of the association between measures of body weight, waist, and fat, and different ratios of these measures, and the risk of type 2 diabetes.
Design
Systematic review and dose-response meta-analysis of cohort studies.
Data sources
PubMed, Scopus, and Web of Science up to 1 May 2021.
Review methods
Cohort studies looking at the association between general or central adiposity and body fat content and the risk of type 2 diabetes in the general adult population were included. Two of the authors extracted the data in duplicate. Random effects dose-response meta-analyses were performed to estimate the degree of the associations. Curvilinear associations were modelled with a one stage weighted mixed effects meta-analysis.
Results
216 cohort studies with 2.3 million individuals with type 2 diabetes among 26 million participants were identified. Relative risks were 1.72 (95% confidence interval 1.65 to 1.81; n=182 studies) for an increase in body mass index of 5 units, 1.61 (1.52 to 1.70; n=78) for a 10 cm larger waist circumference, 1.63 (1.50 to 1.78; n=34) for an increase in waist-to-hip ratio of 0.1 units, 1.73 (1.51 to 1.98; n=25) for an increase in waist-to-height ratio of 0.1 units, 1.42 (1.27 to 1.58; n=9) for an increase in visceral adiposity index of 1 unit, 2.05 (1.41 to 2.98; n=6) for a 10% higher percentage body fat, 1.09 (1.05 to 1.13, n=5) for an increase in body shape index of 0.005 units, 2.55 (1.59 to 4.10, n=4) for a 10% higher body adiposity index, and 1.11 (0.98 to 1.27; n=14) for a 10 cm larger hip circumference. A strong positive linear association was found between body mass index and the risk of type 2 diabetes. Positive linear or monotonic associations were also found in all regions and ethnicities, without marked deviation from linearity at a specific cut-off value. Indices of central fatness, independent of overall adiposity, also had positive linear or monotonic associations with the risk of type 2 diabetes. Positive linear or monotonic associations were also found for total and visceral fat mass, although the number of studies was small.
Conclusions
A higher body mass index was associated with a greater risk of developing type 2 diabetes. A larger waist circumference, independent of overall adiposity, was strongly and linearly associated with the risk of type 2 diabetes.
Systematic review registration
PROSPERO CRD42021255338.
Introduction
Diabetes is one of the major causes of death and disability globally. Currently, about 460 million adults aged 20-79 years live with diabetes, accounting for 10% of global health expenditure.1 Type 2 diabetes is the main form of diabetes in 90-95% of individuals with diabetes, with a rising trend over the past several decades.2 Individuals with type 2 diabetes have a two to threefold higher risk of premature death.3
Worldwide, the obesity epidemic has continued to increase for three decades.1 Adiposity has become a global public health concern and is accompanied by a large financial burden on healthcare systems.4 People with adiposity are at greater risk of cardiovascular disease,5 site specific cancers,6 and premature death.7 Individuals with obesity are also at greater risk of developing type 2 diabetes throughout their lifetime.8 A previous meta-analysis of 18 prospective cohort studies suggested that people with obesity, defined as a body mass index ≥30, are at sevenfold greater risk of developing type 2 diabetes than normal weight adults.9
Although adiposity is an established risk for type 2 diabetes,2 no comprehensive systematic review or meta-analysis of epidemiological studies has summarised the evidence for the degree and shape of the association between general and central adiposity and the risk of type 2 diabetes. Only a limited number of meta-analyses of observational studies have investigated the association between measures of adiposity and the risk of type 2 diabetes.9 10 11 Published systematic reviews did not include a large number of prospective and retrospective cohort studies, however, and have not evaluated the shape of the dose-response associations. A dose-response meta-analysis can present valuable information about the shape of the association between measures of adiposity and the risk of type 2 diabetes, and can help summarise the best evidence needed for decision making. Also, associations between measures of adiposity and type 2 diabetes specific to regions and ethnicities have not been evaluated.12
We aimed to perform a comprehensive systematic review and dose-response meta-analysis of cohort studies to evaluate the degree and shape of the association between measures of body weight, waist, and fat, and different ratios of these measures, and the risk of type 2 diabetes in the general population.
Methods
We followed the instructions outlined in the Cochrane Handbook for Systematic Reviews to conduct our systematic review.13 We also followed the Preferred Reporting Items for Systematic Reviews and Meta-Analyses (PRISMA) for reporting this systematic review.14
Search strategy
We systematically searched PubMed (Medline), Scopus, and Web of Science from inception up to 1 May 2021. We developed and performed the literature search (AJ), and two reviewers (AJ and AE) screened the titles and abstracts. The same two reviewers independently assessed the full text of the articles for eligibility. Differences were resolved by discussion. We also screened the reference lists of all published meta-analyses of observational studies on the association between adiposity and the risk of type 2 diabetes. We limited the search to articles in the English language. Table S1 provides the complete search strategy used to find articles of original research for inclusion in our systematic review.
Eligibility and study selection
Two of the authors (AJ and AE) screened the title and abstract of all studies found in the systematic search to identify studies that met our criteria for inclusion in the meta-analysis. We selected studies that had a cohort design (prospective and retrospective cohort studies); that were conducted in general adult populations (>18 years); that measured body mass index, hip circumference, waist circumference, thigh circumference, waist-to-hip ratio, waist-to-thigh ratio, waist-to-height ratio, body adiposity index, body shape index, percentage body fat, fat mass, and visceral adipose tissue as the exposure and across two or more quantitative categories; that considered the incidence of type 2 diabetes as the outcome; and that reported the number of participants or person years and the number of individuals with diabetes, and adjusted effect estimates (relative risk, hazard ratio, or odds ratio) with 95% confidence intervals for type 2 diabetes across categories of measures of adiposity. Studies that reported effect estimates for a specific unit increase in measures of adiposity (eg, an increase in body mass index of 1 unit) were also eligible. For duplicate publications from the same cohort, those with more complete information for dose-response meta-analyses (eg, those that expressed exposures as categories and reported sufficient information across categories) were selected. Otherwise, publications that included the largest number of participants were selected. Excluded were cross sectional and case-control studies, studies conducted in patients with diseases, inpatient populations, or elderly patients in institutions, and studies that used self-reported anthropometric measures as exposures. To be included in our review, studies had to have an explicit statement about measuring anthropometric indicators. For cohort studies with incomplete information about the method of measuring anthropometric indices, we read other publications from that cohort or cohort protocol to obtain accurate information about the measurement method. Also, studies that used specific body fat content as the exposure, such as abdominal or leg fat mass, were excluded.
Data extraction and assessment for study quality
After the study selection process, two reviewers (AJ and SS) independently extracted data from the original cohort studies. The characteristics extracted from each cohort were: the last name of the first author, year of publication, study name, location of the study (country), sex, sample size and number of individuals with type 2 diabetes, age range, length of follow-up, method for identifying outcome, and variables that were entered into the multivariable analyses in primary cohorts.
We also extracted data for performing the analyses: range of exposures, number of individuals with type 2 diabetes and participants or person years, and reported effect estimates with 95% confidence intervals in each category for measures of anthropometric indicators. For studies that did not report sufficient data for the analyses, we contacted the authors by email. Disagreements were resolved by consensus between the two reviewers. We evaluated the quality of the cohort studies with the ROBINS-I tool (Risk Of Bias In Non-randomised Studies-of Interventions).15 This tool was developed by Cochrane to assess the quality of non-randomised studies of interventions and is recommended to evaluate the potential biases associated with observational studies.16 Quality assessments were conducted in duplicate by two independent reviewers (AJ and SS-B). Disagreements were resolved by consensus.
Protocol amendment
In our registered protocol in PROSPERO (CRD42021255338), we planned to evaluate the quality of the primary studies with the Newcastle-Ottawa scale.17 Because of the limitations of this tool,18 however, we decided to use the ROBINS-I tool. The ROBINS-I tool is increasingly used for assessing the risk of bias of observational studies. The tool includes seven domains and considers potential biases resulting from confounding, selection of participants, assessing the exposure, misclassification during follow-up, missing data, measuring the outcome, and selective reporting of the outcome.15
Data synthesis and statistical analysis
We selected the relative risk and 95% confidence interval as the effect size for reporting the results of our meta-analysis. We considered hazard ratios equal to relative risk.19 For studies that reported effect estimates as odds ratios, we converted them to relative risk according to the method of Zhang et al.20 We used the random effects model (DerSimonian and Laired method) to generate summary relative risks and 95% confidence intervals.21
For the linear dose-response meta-analyses, we estimated summary relative risks and 95% 95% confidence intervals for an increase in body mass index of 5 units, 10 cm larger waist and hip circumferences, 5 cm larger thigh circumference, increase in waist-to-hip ratio and waist-to-height ratio of 0.1 units, 10% higher percentage body fat, 10% higher body adiposity index, increase in body shape index of 0.005 units, and increase in visceral adiposity index of 1 unit in each primary prospective cohort study according to the methods of Crippa et al.22 We then used random effects models to pool the individual study results.
For the analyses, the median of each category, number of individuals with type 2 diabetes and participants or person years, and adjusted effect estimates across at least two categories of exposures were extracted from each primary cohort study. For studies reporting exposures as a range in each category, the midpoint of the lower and upper bounds was used as a proxy for the median. The widths of the open ended categories were considered equal to the adjacent categories. We pooled relative risks for men and women within each study with a fixed effects model if studies only reported effect sizes specific for sex. For studies that reported the effect estimates graphically, a web plot digitiser (www://plotdigitizer.sourceforge.net/) was used to estimate effect estimates from the graphs. We checked the accuracy of these tools in our previous meta-analysis of central fatness and mortality, which indicated precise estimations by these tools.7 For studies that reported a category other than the lowest one as a reference, we recalculated the relative risks assuming the lowest category as the reference, according to the method of Hamling et al.23
After a comment from referees, we performed a sensitivity analysis after exclusion of studies that reported odds ratios as the effect size to ensure the robustness of the findings. Prespecified subgroup analyses were done according to location of the population, age, sex, number of individuals with type 2 diabetes, length of follow-up, and adjustment for confounders, including intake of alcohol, smoking status, physical activity, and family history of diabetes, and for the intermediate variables blood pressure and blood glucose. We also performed post hoc subgroup analyses by the method of case ascertainment (ie, method of identifying individuals with type 2 diabetes). P values for differences between subgroups were calculated by meta-regression analyses. We also performed sensitivity analyses in healthy participants. For the analyses of healthy individuals, any definition of healthy individuals used in primary cohorts, including those without cardiovascular disease, non-communicable chronic diseases, or cardiometabolic abnormalities, were acceptable (because primary cohorts used a wide range of definitions for healthy individuals). Publication bias was assessed when at least 10 studies were available.13 The potential for publication bias was tested with Egger’s test,24 Begg’s test,25 and by inspection of funnel plots. To differentiate asymmetry caused by publication bias from that caused by other factors,26 we applied contour enhanced funnel plots.27
Curvilinear dose-response associations were modelled with a one stage weighted mixed effects meta-analysis.22 We modelled the exposures by using restricted cubic splines with three knots, according to Harrell’s recommended centiles (10%, 50%, and 90%) of the distribution.28 The correlation within each category of published relative risks was taken into account and the estimates specific to each study were combined in a one stage weighted mixed effects meta-analysis.22 29 This method estimates the slope lines specific to each study and combines them to obtain an overall average slope in one stage.30 31 For the analyses of body mass index, we considered the nadir of the curve of the association between body mass index and mortality (body mass index of 23) as the reference.32 For other anthropometric measures, we selected the median of the baseline values of the exposures of the included studies as a reference, and so we avoided self-selection bias in choosing the baseline for the curve and used a data driven approach. For all anthropometric measures, we first performed a main analysis including all eligible cohorts. Then, separate analyses were conducted according to sex, age, geographical region, ethnicity, and in healthy individuals. We applied the best fitting second order fractional polynomial to model curvilinear associations when restricted cubic splines could not be calculated because of the limited number of studies (n≤2) included in the analyses.22 We used the Wald test to evaluate deviation of the data from linearity.
To compare the associations across different measures, we performed another analysis to estimate the summary relative risk for an increase of one standard deviation in each measure. For this analysis, we estimated the relative risk for each increase in standard deviation in each measure in each study. Then, the results for each study were pooled with a random effects model. For studies that reported the effect size for an increase of one standard deviation in exposure, the effect size was included in the meta-analysis as reported. For studies that reported the effect size for a specific amount of increase in measures, we exponentiated the log (relative risk) times the standard deviation of the anthropometric measure for each study to obtain the relative risk for an increase of one standard deviation in the level of the measures. Similar to a linear dose-response meta-analysis, for studies that reported exposures across quantiles, we estimated the relative risks for an increase of one standard deviation with Crippa et al’s method.22 Statistical analyses were conducted with STATA software, version 16.0. P<0.05 was considered significant.
Grading the evidence
We applied the updated Grading of Recommendations, Assessment, Development, and Evaluations (GRADE) approach to rate the overall certainty of the evidence for each association.33 34 The authors (AJ and SS-B) independently performed GRADE assessments. GRADE rates the certainty of evidence as high, moderate, low, or very low. Text S1 provides detailed descriptions about the domains of the GRADE tool and how to judge each domain.
Patient and public involvement
No patients were involved in setting the research question or the outcome measures, nor were they involved in developing plans for design or implementation of the study because of lack of resources to allow their participation.
Results
The initial search of the databases and reference lists identified 119 246 records (fig S1). After excluding 24 128 duplicates and 94 109 irrelevant articles based on screening of the title and abstract, 1102 full text articles were reviewed in detail for eligibility. Overall, 212 articles provided sufficient information and were considered eligible to be included in this dose-response meta-analysis. Four cohort studies reported data from two separate cohort studies, and thus 216 cohort studies with 25 999 148 participants and 2 310 697 individuals with type 2 diabetes were included in the analyses. All included studies were original studies published between 1991 and 2021. All studies were population based cohort studies conducted in the general population of adults, and patients with a history of diabetes at baseline were excluded.
In brief, 56 studies (54 publications) were conducted in Europe, including the UK, Scandinavia (Finland, Norway, Denmark, and Sweden), west and central Europe (Germany, Netherlands, Switzerland, and France), and south Europe (Italy and Spain), 32 studies were conducted in North America (US and Canada), five in South America, eight in Australia, one in Africa, 93 (91 publications) in the Far East (China, Japan, South Korea, and Taiwan), four in South Asia (India and Bangladesh), four in South East Asia (Thailand and Singapore), and 14 in the Middle East. Twenty one studies were conducted in men, eight in women, and the rest in both sexes.
Of the 216 studies included in the meta-analysis, 190 (88%) were prospective cohort studies and 26 (12%) were retrospective cohort studies. All studies used measured anthropometry as the exposure. Fifty six studies (26%) performed repeated measurements during the follow-up period and the other 160 studies (74%) performed baseline measurements only. For method of case ascertainment, 56 studies (26%) performed direct blood glucose measurements, 15 studies (7%) used self-reported methods, 15 (7%) used medical registries, and the other 130 studies (60%) used mixed methods, including a combination of two or more of these methods.
All studies reported multivariable effect estimates. Forty nine studies (23%) excluded participants with a history of non-communicable chronic diseases (mainly cardiovascular disease) at baseline, 207 cohorts (96%) controlled for age in their multivariable analyses, 197 studies (91%) for sex, 149 (69%) for smoking status, 114 (53%) for alcohol drinking, 100 (46%) for physical activity, 87 (40%) for a family history of type 2 diabetes, and 39 (18%) controlled for all of these confounders. For intermediate variables, 95 studies (44%) controlled for blood pressure or hypertension, 84 (39%) for blood glucose, and 24 (11%) for both intermediate variables. Twenty four studies (11%) controlled for all of the confounders and intermediate variables. Based on the ROBINS-I tool, 55 studies (25%) were rated as having a serious risk of bias and 161 studies (75%) a moderate risk of bias. Table S2 provides a list of studies excluded after assessment of the full text, with reasons for exclusions. Table S3 shows the general characteristics of the studies included in this review. Table S4 presents the quality of the studies, assessed by the ROBINS-I tool.
Body mass index
We identified 182 cohort studies (178 publications) with 228 695 individuals with type 2 diabetes among 5 585 850 participants for the analysis of body mass index and type 2 diabetes. Each increase in body mass index by 5 units was linked to a 72% higher risk of type 2 diabetes (relative risk 1.72, 95% confidence interval 1.65 to 1.81, I2=99%, table 1).
Table 1.
Subgroup analysis of body mass index (for an increase of 5 units) and risk of type 2 diabetes
| n | Relative risk (95% CI) | I2 (%), Pheterogeneity* | τ2 | Pbetween† | |
|---|---|---|---|---|---|
| Unadjusted analysis | |||||
| All studies | 182 | 1.72 (1.65 to 1.81) | 99, <0.001 | 0.0823 | - |
| Sex: | 0.83 | ||||
| Men | 43 | 1.75 (1.64 to 1.86) | 98, <0.001 | 0.1042 | |
| Women | 64 | 1.69 (1.61 to 1.79) | 97, <0.001 | 0.0813 | |
| Age: | 0.001 | ||||
| <30 years | 6 | 1.65 (1.42 to 1.92) | 84, <0.001 | 0.1021 | |
| >60 years | 9 | 1.26 (1.06 to 1.49) | 93, <0.001 | 0.0446 | |
| Region: | <0.001 | ||||
| North America | 31 | 1.54 (1.43 to 1.64) | 99, <0.001 | 0.0259 | |
| Europe | 51 | 2.19 (1.94 to 2.46) | 98, <0.001 | 0.1615 | |
| Far East | 75 | 1.59 (1.49 to 1.71) | 99, <0.001 | 0.0802 | |
| South Asia | 4 | 1.42 (1.11 to 1.82) | 97, <0.001 | 0.0554 | |
| South East Asia | 5 | 1.43 (1.12 to 1.83) | 92, <0.001 | 0.0604 | |
| Middle East | 7 | 1.83 (1.50 to 2.22) | 83, <0.001 | 0.0479 | |
| Australia | 5 | 1.51 (1.19 to 1.90) | 81, <0.001 | 0.0434 | |
| South America | 3 | 1.36 (0.96 to 1.91) | 85, <0.001 | 0.0719 | |
| Africa | 1 | 1.41 (1.27 to 1.57) | - | - | |
| Race: | 0.01 | ||||
| White | 5 | 1.59 (1.45 to 1.73) | 80, <0.001 | 0.0101 | |
| Black | 7 | 1.43 (1.24 to 1.60) | 96, <0.001 | 0.0251 | |
| Latin | 3 | 1.49 (1.22 to 1.83) | 62, 0.07 | 0.0204 | |
| No of individuals with type 2 diabetes: | 0.43 | ||||
| <500 | 127 | 1.70 (1.63 to 1.78) | 97, <0.001 | 0.0420 | |
| 500-1000 | 23 | 1.80 (1.55 to 2.10) | 99, <0.001 | 0.1246 | |
| 1000-5000 | 24 | 1.71 (1.50 to 1.94) | 99, <0.001 | 0.1017 | |
| >5000 | 8 | 1.50 (1.29 to 1.74) | 98, <0.001 | 0.0469 | |
| Length of follow-up (years): | <0.001 | ||||
| <5 | 43 | 1.46 (1.36 to 1.58) | 97, <0.001 | 0.0360 | |
| 5-10 | 72 | 1.64 (1.52 to 1.77) | 99, <0.001 | 0.0936 | |
| 10-15 | 36 | 1.75 (1.61 to 1.91) | 98, <0.001 | 0.0602 | |
| 15-20 | 14 | 2.27 (1.95 to 2.63) | 92, <0.001 | 0.0576 | |
| >20 | 17 | 2.33 (1.89 to 2.88) | 98, <0.001 | 0.1771 | |
| Risk of bias: | 0.63 | ||||
| Low | - | - | - | - | |
| Moderate | 135 | 1.72 (1.65 to 1.81) | 99, <0.001 | 0.0282 | |
| Serious | 47 | 1.75 (1.57 to 1.96) | 99, <0.001 | 0.0781 | |
| Study design: | 0.11 | ||||
| Prospective cohort | 160 | 1.76 (1.67 to 1.85) | 99, <0.001 | 0.0862 | |
| Retrospective cohort | 22 | 1.65 (1.40 to 1.89) | 98, <0.001 | 0.0450 | |
| Exposure assessment | 0.08 | ||||
| Baseline assessment | 135 | 1.77 (1.67 to 1.87) | 99, <0.001 | 0.0825 | |
| Repeated measurement | 47 | 1.61 (1.49 to 1.73) | 98, <0.001 | 0.0548 | |
| Case ascertainment: | <0.001 | ||||
| Blood measurement | 47 | 1.63 (1.51 to 1.76) | 98, <0.001 | 0.0571 | |
| Self-reported | 16 | 1.88 (1.58 to 2.23) | 99, <0.001 | 0.0992 | |
| Registries | 13 | 2.26 (1.80 to 2.83) | 99, <0.001 | 0.1673 | |
| Mixed methods | 106 | 1.68 (1.57 to 1.79) | 99, <0.001 | 0.0993 | |
| Exclusion of pre-existing non-communicable chronic diseases: | 0.81 | ||||
| Yes | 41 | 1.77 (1.63 to 1.91) | 98, <0.001 | 0.0708 | |
| No | 141 | 1.70 (1.62 to 1.79) | 99, <0.001 | 0.0540 | |
| Adjustments for confounders | |||||
| Age: | 0.67 | ||||
| Yes | 174 | 1.72 (1.64 to 1.80) | 99, <0.001 | 0.0814 | |
| No | 8 | 1.77 (1.38 to 2.78) | 98, <0.001 | 0.1079 | |
| Sex: | 0.50 | ||||
| Yes | 166 | 1.71 (1.63 to 1.80) | 99, <0.001 | 0.0827 | |
| No | 16 | 1.84 (1.56 to 2.17) | 95, <0.001 | 0.0815 | |
| Smoking status: | 0.74 | ||||
| Yes | 125 | 1.70 (1.60 to 1.79) | 99, <0.001 | 0.0824 | |
| No | 57 | 1.78 (1.65 to 1.92) | 98, <0.001 | 0.0720 | |
| Alcohol drinking: | 0.59 | ||||
| Yes | 96 | 1.69 (1.59 to 1.79) | 99, <0.001 | 0.0685 | |
| No | 86 | 1.74 (1.65 to 1.84) | 99, <0.001 | 0.0550 | |
| Physical activity: | 0.72 | ||||
| Yes | 84 | 1.71 (1.61 to 1.82) | 99, <0.001 | 0.0722 | |
| No | 98 | 1.72 (1.62 to 1.81) | 98, <0.001 | 0.0552 | |
| Family history of diabetes: | 0.31 | ||||
| Yes | 73 | 1.66 (1.54 to 1.78) | 99, <0.001 | 0.0786 | |
| No | 109 | 1.78 (1.66 to 1.90) | 98, <0.001 | 0.1009 | |
| All confounders: | 0.67 | ||||
| Yes | 33 | 1.63 (1.49 to 1.79) | 99, <0.001 | 0.0585 | |
| No | 149 | 1.75 (1.66 to 1.84) | 99, <0.001 | 0.0855 | |
| Adjustments for intermediate variables | |||||
| Blood glucose: | 0.002 | ||||
| Yes | 71 | 1.56 (1.49 to 1.64) | 97, <0.001 | 0.0311 | |
| No | 111 | 1.80 (1.69 to 1.92) | 99, <0.001 | 0.0957 | |
| Blood pressure: | 0.92 | ||||
| Yes | 80 | 1.69 (1.59 to 1.79) | 98, 0.0570 | 0.0570 | |
| No | 102 | 1.74 (1.63 to 1.84) | 99, <0.001 | 0.0759 | |
| Blood glucose and blood pressure: | 0.98 | ||||
| Yes | 20 | 1.67 (1.42 to 1.96) | 97, <0.001 | 0.1211 | |
| No | 162 | 1.73 (1.65 to 1.82) | 99, <0.001 | 0.0813 | |
| Adjustment for all confounders and intermediate variables | 0.98 | ||||
| Yes | 20 | 1.67 (1.42 to 1.96) | 97, <0.001 | 0.1211 | |
| No | 162 | 1.73 (1.65 to 1.82) | 99, <0.001 | 0.0813 | |
P for heterogeneity within each subgroup.
P for heterogeneity between subgroups with meta-regression analyses.
A sensitivity analysis after excluding studies that reported odds ratio as the effect size indicated the same results as the main findings (relative risk 1.69, 95% confidence interval 1.60 to 1.78, I2=99%, n=137). The relative risk was 1.75 (1.64 to 1.86; n=43) in men and 1.69 (1.61 to 1.79; n=64) in women (P for subgroup difference=0.71, table 1). The association was significant (P<0.001) in all subgroups defined by participants and study characteristics, and across all ethnicities and regions. The association was stronger in studies with a longer follow-up and in those that performed baseline rather than repeated anthropometric measurements, and significantly weaker in studies that performed blood glucose measurements for case ascertainment compared with self-reported methods and medical registries (P for subgroup difference <0.001, table 1). In the subgroup analysis by region, we saw a stronger association in studies conducted in Europe (table 1). The association was weaker in adults older than 60 years (relative risk 1.26, 95% confidence interval 1.06 to 1.49; I2=93%, n=9), and was significant after controlling for all confounders and intermediate variables, including age, sex, physical activity, smoking status, alcohol drinking, family history of type 2 diabetes, blood pressure, and plasma glucose (1.67, 1.42 to 1.96, P<0.001, I2=97%, n=20). We found evidence of publication bias with Egger’s test (P=0.01) but not with Begg’s test (P=0.21), however, the contour enhanced funnel plot suggested evidence of asymmetry in the funnel plot owning to publication bias (figs S2-3).
Of the cohort studies, 121 provided sufficient information for the non-linear dose-response meta-analysis. We found a strong linear association between body mass index and risk of type 2 diabetes in the main analysis (Pnon-linearity=0.06, Pdose-response<0.001; R2=0.74, fig 1), with no indication of change from linearity at a specific cut-off value. These same results were seen in men (Pnon-linearity=0.23, n=46), women (Pnon-linearity=0.54, n=43), and in healthy individuals (Pnon-linearity=0.57, n=21). We found some indications of non-linearity in the analysis of younger adults (Pnon-linearity=0.03, n=6) and adults older than 60 years (Pnon-linearity=0.009, n=8), with a steep upward curve at a body mass index of >25, especially in younger adults (fig 1).
Fig 1.

Dose-response association between body mass index and the risk of type 2 diabetes in all studies (Pnon-linearity=0.06, n=121), healthy adults (Pnon-linearity=0.57, n=21), men (Pnon-linearity=0.23, n=46), women (Pnon-linearity=0.54, n=43), young adults (Pnon-linearity=0.03, n=6), and older adults (Pnon-linearity=0.009, n=8). The solid line represents the non-linear dose response and the dotted lines the 95% confidence interval. The circles represent the relative risk point estimates for adiposity categories from each study with the size of the circle proportional to the inverse of the standard error
Figures S4-S7 show the associations between body mass index and type 2 diabetes specific to ethnicity and region. Figure 2 provides a summary of the associations between body mass index and type 2 diabetes for all regions and ethnicities. Dose-response meta-analyses indicated similar positive linear or monotonic associations in different regions and ethnicities. Non-linear dose-response meta-analyses indicated a steep upward curve for the US, Scandinavian countries, and in countries located in west and central Europe.
Fig 2.
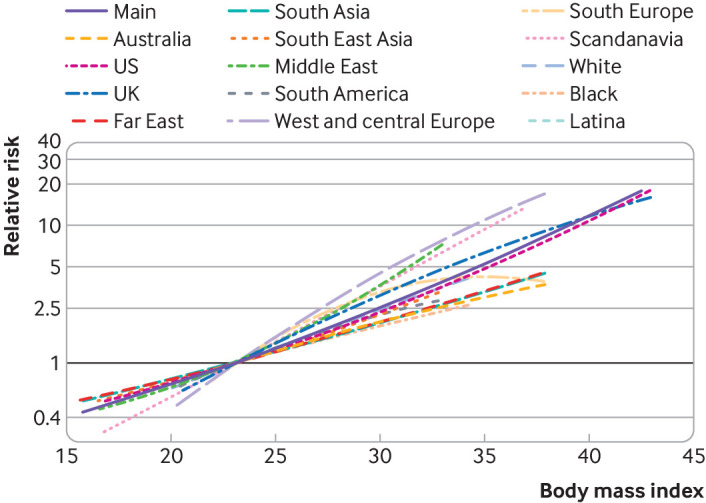
Dose-response association between body mass index and the risk of type 2 diabetes for all regions and ethnicities
Waist circumference
We identified 78 cohort studies (74 publications) with 21 459 955 participants and 2 006 648 individuals with type 2 diabetes for the association between waist circumference and type 2 diabetes. Each 10 cm increase in waist circumference was related to a 61% higher risk of type 2 diabetes (relative risk 1.61, 95% confidence interval 1.52 to 1.70, I2=99%, table S5).
A sensitivity analysis after excluding studies that reported odds ratio as the effect size indicated the same results as the main findings (relative risk 1.62, 95% confidence interval 1.53 to 1.72, I2=98%, n=57). The relative risk was 1.68 (1.54 to 1.82, I2=95%, n=38) in men and 1.68 (1.56 to 1.81, I2=98%, n=38) in women (P for subgroup difference=0.90). The positive association persisted in all subgroups, with stronger associations in Europe (2.00, 1.79 to 2.45, I2=93%, n=17) and North America (1.69, 1.48 to 1.93, I2=99%, n=14) (table S5). We found significant differences between subgroups; studies with longer follow-up periods reported stronger associations (P for subgroup difference <0.001), and studies that used blood glucose measurements reported weaker associations compared with those that used medical registries and self-reported methods for case ascertainment (P for subgroup difference=0.01). The relative risk was 1.68 (1.38 to 2.04, I2=91%, n=11) in studies which controlled for all confounders and intermediate variables. We found evidence of publication bias with Egger’s test (P=0.01), but not with Begg’s test (P=0.18). Asymmetry in the funnel plot was found (fig S8), and the contour enhanced funnel plot was also asymmetric owning to publication bias (fig S9).
The systematic search identified 43 cohorts for the non-linear dose-response meta-analyses. We found a strong positive linear association in the main analysis (Pnon-linearity=0.10, Pdose-response<0.001; R2=0.80, n=43), in studies that adjusted for body mass index (Pnon-linearity=0.95, n=4), and also in healthy individuals (Pnon-linearity=0.51, n=8), older adults (Pnon-linearity=0.46, n=1), men (Pnon-linearity=0.38, n=22), and women (Pnon-linearity=0.40, n=21) (fig 3).
Fig 3.

Dose-response association between waist circumference and the risk of type 2 diabetes in all individuals (Pnon-linearity=0.10, n=43), in studies which controlled for body mass index (Pnon-linearity=0.95, n=4), in healthy individuals (Pnon-linearity=0.51, n=8) older adults (Pnon-linearity=0.46, n=1), men (Pnon-linearity=0.38, n=22), and women (Pnon-linearity=0.40, n=21). The solid line represents the non-linear dose-response and the dotted lines the 95% confidence interval. The circles represent the relative risk point estimates for adiposity categories from each study with the size of the circle proportional to the inverse of the standard error
Figure S10 shows the association between waist circumference and the risk of type 2 diabetes by region and figure S11 shows the association by ethnicity. The strong linear association persisted in the US (Pnon-linearity=0.83, n=4), Europe (Pnon-linearity=0.18, n=10), and Asia (Pnon-linearity=0.10, n=28) (fig S10), and in white (Pnon-linearity=0.92, n=2) and black (Pnon-linearity=0.32, n=2) individuals (fig S11).
Hip circumference
We identified 14 cohort studies (13 publications) with 9623 individuals with type 2 diabetes among 231 410 participants that reported data for the relation between hip circumference and type 2 diabetes. A 10 cm larger hip circumference was not linked to the risk of type 2 diabetes in the main analysis (relative risk 1.11, 95% confidence 0.98 to 1.27; I2=98%) (fig S12).
A subgroup analysis by adjustment for waist circumference, however, indicated a positive association in studies that did not take waist circumference into account in their multivariable analyses (relative risk 1.35, 95% confidence interval 1.14 to 1.60; I2=97%, n=8). In contrast, we found an inverse association in studies that considered waist circumference as a confounder in their multivariable analyses (0.89, 0.82 to 0.96, I2=91%, n=7) (fig S12). We did not find evidence of publication bias with Egger’s test (P=0.24), Begg’s test (P=0.68), or with the funnel plot (fig S13).
Three cohorts in the US and Europe were eligible for the non-linear dose-response meta-analysis. We found a non-linear inverse association between hip circumference and type 2 diabetes (Pnon-linearity<0.001, Pdose-response<0.001; R2=0.37, n=3) (fig S14), with the lowest risk at a hip circumference of 107 cm (relative risk107cm 0.81, 95% confidence interval 0.74 to 0.87) and with a slight upward curve at higher values. The association was significant in women (Pnon-linearity<0.001, n=2) but not in men (Pnon-linearity<0.001, n=2).
Waist-to-hip ratio
Thirty four cohort studies with 46 763 individuals with type 2 diabetes among 934 589 participants were identified for the relation between waist-to-hip ratio and risk of type 2 diabetes. Each increase in waist-to-hip ratio by 0.1 units was linked to a 63% higher risk of type 2 diabetes (relative risk 1.63, 95% confidence interval 1.50 to 1.78, I2=99%) (fig S15). The association was unchanged after excluding studies that reported odds ratio as the effect size (1.61, 1.46 to 1.76, I2=98%, n=24). Similar to the analyses of body mass index and waist circumference, the positive association persisted in all subgroups defined by region, ethnicity, race, length of follow-up, sample size, and in studies that controlled for all confounders and intermediate variables (2.41, 1.96 to 2.96, I2=0%, n=2) (table S6). The association was stronger in Europe and weaker in South America and the Middle East. We found some indications of publication bias with Egger’s test (P=0.02), but not with Begg’s test (P=0.21). The contour enhanced funnel plot was also asymmetric owing to publication bias towards a stronger effect size (figs S16-17).
The non-linear dose-response meta-analysis indicated a positive linear association in the main analysis (Pnon-linearity=0.17, Pdose-response<0.001; R2=0.82, n=19) (fig 4), which was also seen in healthy individuals (Pnon-linearity=0.55, n=4), older adults (Pnon-linearity=0.16, n=2), men (Pnon-linearity<0.001, n=8), women (Pnon-linearity=0.10, n=10), and in one study which controlled for body mass index (Pnon-linearity=0.40, n=1) (fig 4). We found a similar positive linear or monotonic association for region (US, Europe, and Asia, fig 4). Figure S18 presents the associations specific to race, and the associations in the Far East and the Middle East, indicating similar positive monotonic associations, except for the Middle East where a modest increase in risk was found across the whole range of waist-to-hip ratios.
Fig 4.

Dose-response association between waist-to-hip ratio and the risk of type 2 diabetes in all individuals (Pnon-linearity=0.17, n=19), healthy individuals (Pnon-linearity=0.55, n=4), in studies which controlled for body mass index (Pnon-linearity=0.40, n=1), in older adults (Pnon-linearity=0.16, n=2), men (Pnon-linearity<0.001, n=8), and women (Pnon-linearity=0.10, n=10), and in the US (Pnon-linearity=0.52; n=3), Europe (Pnon-linearity<0.001, n=5), and Asian countries (Pnon-linearity=0.19, n=11). The solid line represents the non-linear dose-response and the dotted lines the 95% confidence interval. The circles represent the relative risk point estimates for adiposity categories from each study with the size of the circle proportional to the inverse of the standard error
Waist-to-height ratio
We identified 25 cohort studies with 210 053 participants and 12 352 individuals with type 2 diabetes for the link between waist-to-height ratio and the risk of type 2 diabetes. Each increase in waist-to-height ratio by 0.1 units was associated with a 73% higher risk of type 2 diabetes (relative risk 1.73, 95% confidence interval 1.51 to 1.98, I2=97%, n=25) (fig S19). The result was the same after excluding studies that reported odds ratio as the effect size (1.74, 1.47 to 2.06, I2=98%, n=16). Table S7 presents the results across different subgroups. All studies used measured data for the analysis. The effect size was relatively the same in men (1.74, 1.62 to 1.90, I2=82%, n=16) and women (1.72, 1.61 to 1.86, I2=86%, n=15) (P for subgroup difference=0.86). The association was stronger in the US (1.79, 1.39 to 2.31, I2=96%, n=4) and Europe (2.42, 2.21 to 2.64, I2=0%, n=2), and remained significant after adjustment for all confounders and intermediate variables (1.77, 1.61 to 1.94, P<0.001, I2=0%, n=4) (table S7). We found evidence of publication bias with Egger’s test (P=0.01) and Begg’s test (P=0.08), and the funnel plot indicated some evidence of asymmetry towards a stronger effect size (fig S20).
Fourteen cohort studies were eligible for the non-linear dose-response meta-analysis. We found a positive monotonic association in the main analysis (Pnon-linearity<0.001, Pdose-response<0.001; R2=0.69, n=14), and in the analysis of older adults (Pnon-linearity<0.001, n=2). A positive linear association was seen in healthy individuals (Pnon-linearity=0.29, n=3), in men (Pnon-linearity=0.24, n=8), women (Pnon-linearity=0.56, n=7), and in one study which controlled for body mass index (Pnon-linearity=0.57, n=1) (fig S21). Figure S22 shows the associations by region, indicating similar positive linear or monotonic associations.
Visceral adiposity index
Nine cohort studies (eight publications) were identified for the link between visceral adiposity index and risk of type 2 diabetes. Each increase in higher visceral adiposity index by 1 unit was linked with a 42% higher risk of type 2 diabetes (relative risk 1.42, 95% confidence interval 1.27 to 1.58, I2=84%) (fig S23). In a sensitivity analysis, the association did not change substantially after excluding studies that reported odds ratio as the effect size (1.39, 1.29 to 1.49, I2=83%, n=5). Table S8 presents the results across different subgroups. The positive association persisted in all subgroups, especially after adjustment for all confounders (1.43, 1.25 to 1.63, I2=78%, n=3) and intermediate variables (1.53, 1.24 to 1.88, I2=83%, n=4). Analysis of five cohorts indicated a positive monotonic association between visceral adiposity index and the risk of type 2 diabetes (Pnon-linearity<0.001, Pdose-response<0.001; R2=0.61, n=5) (fig 5).
Fig 5.
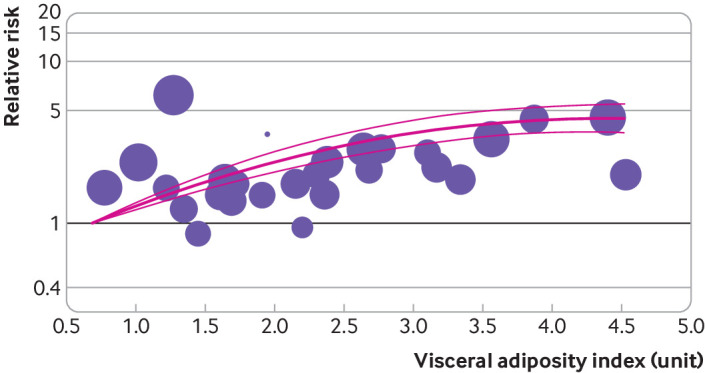
Dose-response association between visceral adiposity index (Pnon-linearity<0.001, n=5) and the risk of type 2 diabetes. The solid line represents the non-linear dose-response and the dotted lines the 95% confidence interval. The circles represent the relative risk point estimates for adiposity categories from each study with the size of the circle proportional to the inverse of the standard error
Body fat percentage
Six cohort studies with 44 593 participants and 2558 individuals with type 2 diabetes evaluated the association between percentage body fat and the risk of type 2 diabetes. The relative risk for a 10% higher percentage body fat was 2.05 (95% confidence interval 1.41 to 2.98, I2=91%) (fig S24). We did not perform subgroup analyses or non-linear dose-response meta-analyses because of insufficient data.
Thigh circumference
Two cohort studies with 454 individuals with type 2 diabetes among 2971 participants evaluated the association between thigh circumference and risk of type 2 diabetes. We found no association between thigh circumference and type 2 diabetes in the main analysis (relative risk 1.11, 95% confidence interval 0.86 to 1.42; I2=85%) (fig S25).
Body shape index
Five cohort studies with 481 870 participants and 26 364 individuals with type 2 diabetes were identified for the analysis of body shape index. Each increase in the body shape index by 0.005 units was linked to a 9% higher risk of type 2 diabetes (relative risk 1.09, 95% confidence interval 1.05 to 1.13, I2=71%) (fig S26). We found a positive linear association in the non-linear dose-response meta-analysis (Pnon-linearity=0.05, Pdose-response=0.03; R2=0.51, n=4; fig 6).
Fig 6.
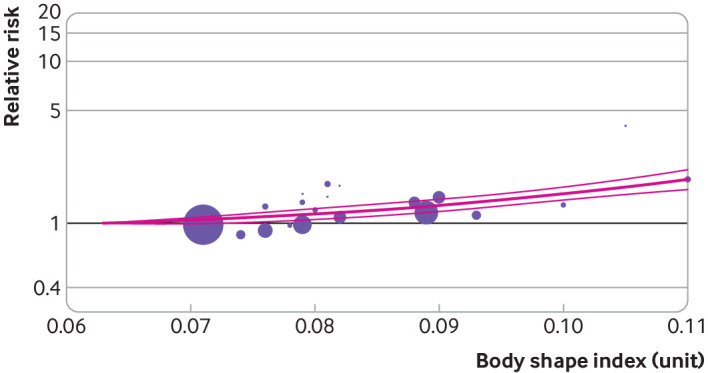
Dose-response association between body shape index (Pnon-linearity=0.05, n=4) and the risk of type 2 diabetes. The solid line represents the non-linear dose-response and the dotted lines the 95% confidence interval. The circles represent the relative risk point estimates for adiposity categories from each study with the size of the circle proportional to the inverse of the standard error
Body adiposity index
Four cohorts (three publication) with 60 790 participants and 3576 individuals with type 2 diabetes reported data for body adiposity index. The relative risk for each 10% increase in body adiposity index was 2.55 (95% confidence interval 1.59 to 4.10, I2=98%) (fig S27).
Comparison of associations across different measures
To compare the associations across different measures of fatness, we estimated the summary relative risks for an increase of one standard deviation in each measure. In this analysis, the number of studies might differ from the number of studies included in the main analyses because we could not calculate standard deviation values in some studies. The results indicated that body adiposity index and percentage body fat had the strongest associations with the risk of type 2 diabetes (table 2). Among traditional measures, waist-to-height ratio was superior to waist circumference, waist-to-hip ratio, and body mass index in predicting the risk of type 2 diabetes.
Table 2.
Summary relative risks of type 2 diabetes for an increase of one standard deviation for measures of adiposity
| Anthropometric measures | SD values (average) | No of studies | Relative risk (95% CI) | Heterogeneity (I2, %) |
|---|---|---|---|---|
| Thigh circumference (cm) | 5.25 | 2 | 1.11 (0.86 to 1.45) | 85 |
| Hip circumference (cm) | 8.40 | 12 | 1.11 (0.97 to 1.26) | 98 |
| Body shape index (unit) | 0.0065 | 5 | 1.12 (1.07 to 1.17) | 71 |
| Visceral adiposity index (unit) | 1.03 | 9 | 1.41 (1.29 to 1.54) | 71 |
| Waist-to-hip ratio (unit) | 0.080 | 27 | 1.53 (1.40 to 1.65) | 96 |
| Body mass index | 3.63 | 167 | 1.54 (1.49 to 1.60) | 99 |
| Waist circumference (cm) | 10.02 | 64 | 1.63 (1.52 to 1.72) | 98 |
| Waist-to-height ratio (unit) | 0.073 | 19 | 1.68 (1.52 to 1.84) | 96 |
| Percentage body fat (%) | 9.77 | 6 | 2.05 (1.41 to 2.98) | 91 |
| Body adiposity index (unit) | 8 | 4 | 2.15 (1.30 to 3.34) | 98 |
SD=standard deviation.
Certainty of evidence
The certainty of evidence was rated by the GRADE approach. The certainty of evidence was rated strong for body mass index, waist circumference, waist-to-hip ratio, waist-to-height ratio, visceral adiposity index, percentage body fat, body shape index, and body adiposity index because of various downgrades for risk of bias, inconsistency, and publication bias, and upgrades for dose-response gradient and large (relative risk >2.00) to very large (relative risk >5.00) effect sizes (table S9). The evidence was upgraded to two levels because of the very large effect size (relative risk >5.00)35 in the non-linear dose-response meta-analyses of body mass index, waist circumference, and waist-to-hip ratio. The certainty of evidence was graded low and very low for hip and thigh circumferences, respectively.
Discussion
Principal findings
Our comprehensive dose-response meta-analysis evaluated the association between different measures of body weight, waist, and body fat content, and different ratios of these measures, and the risk of type 2 diabetes in the general population. The analyses indicated a strong positive linear association between body mass index and the risk of type 2 diabetes. Similar linear associations, with no evidence of deviation from linearity at a specific cut-off value, were seen in different region, race, and ethnicity subgroups. Indices of central obesity also showed similar linear (waist circumference) or monotonic (waist-to-hip ratio and waist-to-height ratio) associations with type 2 diabetes. These positive linear or monotonic associations were confirmed by the analyses of more objective measures of body fat content, such as percentage body fat and visceral adiposity index. These associations were consistently stronger in European countries. A larger hip circumference was linked to a lower risk of type 2 diabetes.
Comparison with other pairwise meta-analyses
A limited number of systematic reviews and meta-analyses of cohort studies have been undertaken of the association between measures of adiposity and the risk of type 2 diabetes. A meta-analysis of 18 prospective cohorts indicated that individuals with overweight (body mass index 25-29.9) and obesity (body mass index ≥30) had a 292% and 728% increased risk of type 2 diabetes, respectively.9 Another meta-analysis of 15 cohort studies found that an increase of one standard deviation for body mass index, waist circumference, waist-to-hip ratio, and waist-to-height ratio was associated with an increased risk of type 2 diabetes of 55%, 63%, 52%, and 62%, respectively.11 A meta-analysis of 31 cohort studies showed a relatively linear association between body mass index and type 2 diabetes,10 but previous meta-analyses did not include a large number of primary cohort studies in their analyses.
In the analysis of body mass index, we found a strong positive linear association with type 2 diabetes, which was confirmed in the analyses for almost all regions and ethnicities. Although there was a non-linear association in some subgroups, no marked deviation from linearity was seen at a specific cut-off value. Our previous meta-analysis also indicated a similar strong positive linear association between body mass index and hypertension.36
A recent large cohort study including >1.4 million adults older than 18 years in the UK suggested that, based on the risk of type 2 diabetes, different ethnicities have specific cut-off values to define obesity.12 The study suggested that cut-off values that were equivalent in risk to a body mass index of 30 in white individuals were 23.9 in South Asian populations, 26.9 in populations in the Far East, and 28.9 in black populations. Our findings indicated positive linear or monotonic associations between body mass index and the risk of type 2 diabetes in all regions, ethnicities, and races. These findings were from different studies (75 cohorts from the Far East v seven cohorts from the Middle East), however, with different sample sizes and lengths of follow-up, and different degrees of statistical control for confounders, and thus should be interpreted with caution.
Analyses of indices of central adiposity also indicated similar positive linear or monotonic associations with the risk of type 2 diabetes, with no marked deviation from linearity at a specific cut-off value. Analyses of different regions and ethnicities indicated similar findings. The results became stronger after adjustment for body mass index, suggesting that deposition of fat in this area of the body, independent of overall fatness, was related to a higher risk.7
Analyses of general and abdominal adiposity were confirmed by more objective measures of fatness. Analyses of the visceral adiposity index, representing deposits of fat in the visceral compartment, showed strong positive associations. Only five cohort studies were available for the non-linear dose-response meta-analysis of visceral fat, however, and thus more research might be needed to reach more confident conclusions.
Analyses of hip circumference confirmed our previous finding about the inverse association of hip circumference and risk of all cause mortality,7 suggesting that deposits of fat in the gluteofemoral compartment could have a protective effect. We also found that the analyses of hip circumference should be controlled for waist circumference to show these protective effects.
In the analyses of body mass index, waist circumference, and waist-to-height ratio, a subgroup analysis by length of follow-up indicated substantial stronger associations in studies with a longer follow-up. A previous meta-analysis of cohort studies of body mass index and all cause mortality indicated similar stronger associations in studies with longer follow-up periods,37 suggesting a weaker potential for bias owing to weight loss from pre-existing disease in studies with a longer follow-up. Also, studies indicated that length of adiposity was positively associated with the risk of type 2 diabetes.38 39
In the analyses of body mass index and waist circumference, a stratified analysis based on the method of case ascertainment indicated significant differences between subgroups, where studies that performed blood glucose measurements reported weaker associations than those that used self-reported methods or medical registries (P for subgroup difference=0.01 and <0.001 for waist circumference and body mass index, respectively). Direct blood glucose measurement is probably a more reliable method for case ascertainment, but this method is difficult to perform in large scale population based cohort studies. About 60% of the studies included in the analyses of body mass index and waist circumference used a combination of methods for case ascertainment, and the main findings were close to those reported in these subgroups (1.72 v 1.68 for body mass index and 1.61 v 1.57 for waist circumference).
Studies suggested evidence of a substantial effect modification by age in the association between adiposity and morbidity and mortality.40 41 In general, the harmful effects of adiposity are more evident in young adults, and excess mortality associated with obesity decreases along with the increase in age across levels of obesity, in a way that older adults might benefit from being overweight.32 42 Our results also indicated that the association between body mass index and type 2 diabetes was significantly stronger in adults younger than 30 years than in those older than 60 years (P for subgroup difference <0.001. Although originally planned in our protocol, we could not perform more efficient subgroup analyses by age.
In the analysis of body mass index, heterogeneity existed when we stratified studies based on how frequently the exposure was assessed, where studies with repeated assessments during follow-up indicated weaker associations compared with studies that performed one baseline measurement. One baseline measurement of exposures did not consider potential changes in the level of exposure over time and is one of the main limitations of epidemiological studies that could result in measurement errors and non-differential misclassification.43 Repeated measurements can probably provide more reliable measurements and thus can give a more precise estimation of the associations, but we did not find significant differences between subgroups in the analyses of other measures.
We performed an additional meta-analysis to compare the associations across different measures. The results indicated that body adiposity index, an alternative calculation representing an indirect estimate of body fat content, had a stronger association with the risk of type 2 diabetes compared with other measures. Body adiposity index integrates height and hip circumference to estimate the amount of body fat.44 We also found a strong association for percentage body fat. Of the six studies included in the analysis of percentage body fat, four used bioelectrical impedance analysis, one used hydrodensitometry (alternative method representing an indirect estimate of body fat content), and one study used dual energy x ray absorptiometry (the gold standard for measuring body composition) to predict percentage body fat.
Among conventional measures, we found a stronger association for waist-to-height ratio than waist circumference, waist-to-hip ratio, and body mass index. This finding was consistent with previous reviews indicating that waist-to-height ratio is better at predicting the risk of all cause mortality7 and levels of cardiometabolic risk factors45 than body mass index, waist circumference, and waist-to-hip ratio. Marked differences existed across measures in terms of the number of studies included in each analysis, geographical location, study population, length of follow-up, and degree of statistical control, however, and thus our conclusions on the superiority of some measures should be interpreted cautiously and allowing for these limitations.
Clinical and public health implications
Ours was a comprehensive study of the association between adiposity and the risk of type 2 diabetes across the world. Our findings indicated a strong positive linear association between body mass index and type 2 diabetes. Current recommendations from the World Health Organization suggest a threshold of 27.5 for body mass index to define obesity and start lifestyle interventions in populations in the Far East and Chinese populations,46 which was equivalent in risk to a body mass index of 30 in white individuals. Using a rigorous analytical method and performing a large meta-analysis of cohort studies, we found a strong positive linear association between body mass index and type 2 diabetes across the whole range of body mass index values.
We included several measures representing regional distribution of body fat. The results indicated a strong positive linear association across the whole range of waist circumference values in different regions, ethnicities, and in both sexes. We also included more objective measures of body fat content that confirmed current knowledge about the harmful effects of adiposity on human health. Allowing for limitations, such as different populations and different numbers of studies, our analysis compared the associations across different anthropometric indicators.
We considered the proposed limitations of conventional anthropometric measures, including body mass index (inability to distinguish lean mass from fat mass), waist circumference (strong correlation with body mass index), and waist-to-hip ratio (difficulty in measuring hip circumference) in presenting our comprehensive perspective of the association between important anthropometric indicators and the risk of type 2 diabetes. We also excluded cohort studies that used self-reported anthropometric measures as exposures. Systematic errors in self-reported weight and height have been reported,47 leading to misclassification and thus an upward bias in the magnitude of the effect estimates.48 49 By using cohort studies that measured anthropometric data, we presented a more accurate estimation of the associations.
Heterogeneity
For almost all exposures, we found high heterogeneity in the data. We performed several predefined and post hoc subgroup analyses to present the results across subgroups and find the sources of heterogeneity, but extreme heterogeneity persisted in the subgroups. We present several explanations for the large heterogeneity in the data.
Firstly, we included a large number of studies in the analyses, especially for body mass index and waist circumference. In such cases, high heterogeneity is inevitable, and even a small difference in effect estimates can lead to high heterogeneity in the data.50 Secondly, all studies included in our review were consistent in terms of the PICOS (population, intervention or exposure, comparator, outcome, and study design) framework.51 Therefore, the heterogeneity seen in the data was statistical heterogeneity rather than clinical or methodological heterogeneity.
Thirdly, the large heterogeneity in the data was mainly because of the difference in the magnitude (weak, moderate, or strong) of the effect sizes rather than a difference in the direction (positive or inverse) of the associations. Of 182 studies included in the analysis of body mass index, 178 reported positive associations. Of 78 studies included in the analysis of waist circumference, all reported positive associations. This consistency in the results was also reported for waist-to-hip ratio, waist-to-height ratio, and visceral adiposity index. Consistency was strong across the studies in terms of the direction of the associations. According to the GRADE approach, reviewers should differentiate between situations where the large inconsistency across studies is caused by differences in the magnitude of the associations rather than differences in the direction of the associations.52 Because individual studies were in the same direction, performing meta-analyses is still thought to be appropriate.53 54
We performed several prespecified and post hoc subgroup analyses to find the potential sources of the heterogeneity. Because of the large number of studies, however, large variations in participant and study characteristics within each subgroup persisted.
Publication bias
We found evidence of publication bias in the analyses of body mass index, waist circumference, waist-to-hip ratio, and waist-to-height ratio. Contour enhanced funnel plots suggested that the asymmetry in the funnel plots was a result of publication bias.26 27 Also, considering that the association between body mass index and type 2 diabetes is thought to be specific to ethnicity,12 the asymmetry in the funnel plots might also be a result of heterogeneity owing to differences in the characteristics of the populations.26 Because of the large asymmetry in the funnel plots, however, our results could have been overestimated for these measures and thus the magnitude of the effect estimates should be interpreted cautiously.
Strengths and limitations of this study
The major limitation of our study was that although we performed several comparisons across different regions, ethnicities, and races, the results were obtained from different cohorts with different sample sizes, follow-up periods, and statistical controls. An individual participant data meta-analysis of cohort studies might provide more accurate information about the shape of the associations. Secondly, we had insufficient data for the analysis of healthy individuals. Primary cohort studies used different definitions to specify healthy individuals and thus more research might be required in healthy individuals. We also had insufficient data for never smokers and for some subgroups, such as South America, Africa, and black individuals. Thirdly, studies published in non-English journals were not included because of resource constraints, which might cause selection bias. Given the large number of studies included in the analyses, especially for body mass index and waist circumference, however, inclusion of studies in non-English journals would probably not have changed the results substantially. Fourthly, of 216 studies included in the analyses, only a quarter performed repeated anthropometric measurements during the follow-up period. Analysis of body mass index indicated a weaker association in studies that performed repeated versus baseline anthropometric measurements. This finding should be considered in future studies evaluating the associations between obesity and morbidity. Fifthly, we did not include fat mass in specific regions, such as liver, muscle, and abdominal fat mass, in our review. Future research should evaluate the association between body fat content in specific regions and the risk of diabetes risk in more detail. Finally, because of the observational design of the studies, residual confounding cannot be excluded and should be considered when interpreting the results. Recent mendelian randomisation studies, however, suggested a casual effect of general and central adiposity on the risk of type 2 diabetes.55 56
Conclusions
Our comprehensive dose-response meta-analysis of 216 cohort studies suggested evidence of a strong positive linear association between body mass index and the risk of type 2 diabetes across almost all regions and ethnicities. We found no marked deviation from linearity at a specific cut-off value. For hip circumference, the direction of the association depended on adjustment for waist circumference, where studies that controlled for waist circumference reported an inverse association and studies that did not control for waist circumference reported a positive association. For some measures, such as body shape index, body adiposity index, and visceral fat mass, only a small number of studies were available.
What is already known on this topic
General and central adiposity are associated with the risk of type 2 diabetes
The shapes of the dose-response associations between general and central adiposity and the risk of type 2 diabetes have not been determined
Associations specific to region, race, and ethnicity have not been evaluated
What this study adds
Body mass index had a strong positive linear association with the risk of type 2 diabetes, confirmed in analyses of almost all regions and ethnicities
A larger waist circumference was strongly and linearly associated with a higher risk of type 2 diabetes
For hip circumference, studies that controlled for waist circumference reported an inverse association, and studies that did not control for waist circumference reported a positive association
Web extra.
Extra material supplied by authors
Web appendix: Supplementary materials
Contributors: AJ and SS-B conceived and designed the study. AJ and AE conducted the systematic search, screened articles, and read the full texts for eligibility. AJ and SS extracted data from the original cohort studies and evaluated the cohorts for risk of bias. AJ performed the analyses. AJ, SS, AE, SZM, HS, and HM contributed to the interpretation of the results and wrote the first draft of the manuscript. SS-B contributed to the interpretation of the results and critically revised the manuscript. All authors acknowledge full responsibility for the analyses and interpretation of the report. All authors have read and approved the final manuscript. SS-B is the guarantor. The corresponding author attests that all listed authors meet authorship criteria and that no others meeting the criteria have been omitted.
Funding: None.
Competing interests: All authors have completed the ICMJE uniform disclosure form at www.icmje.org/disclosure-of-interest/ and declare: no support from any organisation for the submitted work; no financial relationships with any organisations that might have an interest in the submitted work in the previous three years; no other relationships or activities that could appear to have influenced the submitted work.
The lead author (the manuscript’s guarantor) affirms that the manuscript is an honest, accurate, and transparent account of the study being reported; that no important aspects of the study have been omitted; and that any discrepancies from the study as planned have been explained.
Dissemination to participants and related patient and public communities: We plan to disseminate the results to clinicians, patient advocacy groups, and patient organisations, and also through social media.
Provenance and peer review statement: Not commissioned; externally peer reviewed.
Ethics statements
Ethical approval
Not required.
Data availability statement
No additional data available.
References
- 1. Abarca-Gómez L, Abdeen ZA, Hamid ZA, et al. NCD Risk Factor Collaboration (NCD-RisC) . Worldwide trends in body-mass index, underweight, overweight, and obesity from 1975 to 2016: a pooled analysis of 2416 population-based measurement studies in 128·9 million children, adolescents, and adults. Lancet 2017;390:2627-42. 10.1016/S0140-6736(17)32129-3 [DOI] [PMC free article] [PubMed] [Google Scholar]
- 2. Zheng Y, Ley SH, Hu FB. Global aetiology and epidemiology of type 2 diabetes mellitus and its complications. Nat Rev Endocrinol 2018;14:88-98. 10.1038/nrendo.2017.151 [DOI] [PubMed] [Google Scholar]
- 3. Yang JJ, Yu D, Wen W, et al. Association of diabetes with all-cause and cause-specific mortality in Asia: a pooled analysis of more than 1 million participants. JAMA Netw Open 2019;2:e192696-96. 10.1001/jamanetworkopen.2019.2696 [DOI] [PMC free article] [PubMed] [Google Scholar]
- 4. Tremmel M, Gerdtham U-G, Nilsson PM, Saha S. Economic burden of obesity: a systematic literature review. Int J Environ Res Public Health 2017;14:435. 10.3390/ijerph14040435 [DOI] [PMC free article] [PubMed] [Google Scholar]
- 5. Jayedi A, Rashidy-Pour A, Soltani S, Zargar MS, Emadi A, Shab-Bidar S. Adult weight gain and the risk of cardiovascular disease: a systematic review and dose-response meta-analysis of prospective cohort studies. Eur J Clin Nutr 2020;74:1263-75. 10.1038/s41430-020-0610-y [DOI] [PubMed] [Google Scholar]
- 6. Kyrgiou M, Kalliala I, Markozannes G, et al. Adiposity and cancer at major anatomical sites: umbrella review of the literature. BMJ 2017;356:j477. 10.1136/bmj.j477 [DOI] [PMC free article] [PubMed] [Google Scholar]
- 7. Jayedi A, Soltani S, Zargar MS, Khan TA, Shab-Bidar S. Central fatness and risk of all cause mortality: systematic review and dose-response meta-analysis of 72 prospective cohort studies. BMJ 2020;370:m3324. [DOI] [PMC free article] [PubMed] [Google Scholar]
- 8. Felber JP, Golay A. Pathways from obesity to diabetes. Int J Obes Relat Metab Disord 2002;26(Suppl 2):S39-45. 10.1038/sj.ijo.0802126 [DOI] [PubMed] [Google Scholar]
- 9. Abdullah A, Peeters A, de Courten M, Stoelwinder J. The magnitude of association between overweight and obesity and the risk of diabetes: a meta-analysis of prospective cohort studies. Diabetes Res Clin Pract 2010;89:309-19. 10.1016/j.diabres.2010.04.012 [DOI] [PubMed] [Google Scholar]
- 10. Hartemink N, Boshuizen HC, Nagelkerke NJ, Jacobs MA, van Houwelingen HC. Combining risk estimates from observational studies with different exposure cutpoints: a meta-analysis on body mass index and diabetes type 2. Am J Epidemiol 2006;163:1042-52. 10.1093/aje/kwj141 [DOI] [PubMed] [Google Scholar]
- 11. Kodama S, Horikawa C, Fujihara K, et al. Comparisons of the strength of associations with future type 2 diabetes risk among anthropometric obesity indicators, including waist-to-height ratio: a meta-analysis. Am J Epidemiol 2012;176:959-69. 10.1093/aje/kws172 [DOI] [PubMed] [Google Scholar]
- 12. Caleyachetty R, Barber TM, Mohammed NI, et al. Ethnicity-specific BMI cutoffs for obesity based on type 2 diabetes risk in England: a population-based cohort study. Lancet Diabetes Endocrinol 2021;9:419-26. 10.1016/S2213-8587(21)00088-7 [DOI] [PMC free article] [PubMed] [Google Scholar]
- 13. Higgins JP, Thomas J, Chandler J, et al. Cochrane Handbook for Systematic Reviews of Interventions. John Wiley & Sons, 2019. 10.1002/9781119536604. [DOI] [Google Scholar]
- 14. Page MJ, McKenzie JE, Bossuyt PM, et al. The PRISMA 2020 statement: an updated guideline for reporting systematic reviews. BMJ 2021;372:n71. 10.1136/bmj.n71 [DOI] [PMC free article] [PubMed] [Google Scholar]
- 15. Sterne JA, Hernán MA, Reeves BC, et al. ROBINS-I: a tool for assessing risk of bias in non-randomised studies of interventions. BMJ 2016;355:i4919. [DOI] [PMC free article] [PubMed] [Google Scholar]
- 16. Sterne J, Hernán M, McAleenan A, et al. Chapter 25: Assessing risk of bias in a non-randomized study. Cochrane Handbook for Systematic Reviews of Interventions. John Wiley & Sons, 2019. [Google Scholar]
- 17.Wells GA, Shea B, O’Connell D, et al. The Newcastle-Ottawa Scale (NOS) for assessing the quality of nonrandomised studies in meta-analyses: Oxford, 2000. www.ohri.ca/programs/clinical_epidemiology/oxford.asp
- 18. Stang A. Critical evaluation of the Newcastle-Ottawa scale for the assessment of the quality of nonrandomized studies in meta-analyses. Eur J Epidemiol 2010;25:603-5. 10.1007/s10654-010-9491-z [DOI] [PubMed] [Google Scholar]
- 19. Symons MJ, Moore DT. Hazard rate ratio and prospective epidemiological studies. J Clin Epidemiol 2002;55:893-9. 10.1016/S0895-4356(02)00443-2 [DOI] [PubMed] [Google Scholar]
- 20. Zhang J, Yu KF. What’s the relative risk? A method of correcting the odds ratio in cohort studies of common outcomes. JAMA 1998;280:1690-1. 10.1001/jama.280.19.1690 [DOI] [PubMed] [Google Scholar]
- 21. DerSimonian R, Laird N. Meta-analysis in clinical trials. Control Clin Trials 1986;7:177-88. 10.1016/0197-2456(86)90046-2 [DOI] [PubMed] [Google Scholar]
- 22. Crippa A, Discacciati A, Bottai M, Spiegelman D, Orsini N. One-stage dose-response meta-analysis for aggregated data. Stat Methods Med Res 2019;28:1579-96. 10.1177/0962280218773122 [DOI] [PubMed] [Google Scholar]
- 23. Hamling J, Lee P, Weitkunat R, Ambühl M. Facilitating meta-analyses by deriving relative effect and precision estimates for alternative comparisons from a set of estimates presented by exposure level or disease category. Stat Med 2008;27:954-70. 10.1002/sim.3013 [DOI] [PubMed] [Google Scholar]
- 24. Egger M, Davey Smith G, Schneider M, Minder C. Bias in meta-analysis detected by a simple, graphical test. BMJ 1997;315:629-34. 10.1136/bmj.315.7109.629 [DOI] [PMC free article] [PubMed] [Google Scholar]
- 25. Begg CB, Mazumdar M. Operating characteristics of a rank correlation test for publication bias. Biometrics 1994;50:1088-101. 10.2307/2533446 [DOI] [PubMed] [Google Scholar]
- 26. Sterne JA, Sutton AJ, Ioannidis JP, et al. Recommendations for examining and interpreting funnel plot asymmetry in meta-analyses of randomised controlled trials. BMJ 2011;343:d4002. 10.1136/bmj.d4002 [DOI] [PubMed] [Google Scholar]
- 27. Peters JL, Sutton AJ, Jones DR, Abrams KR, Rushton L. Contour-enhanced meta-analysis funnel plots help distinguish publication bias from other causes of asymmetry. J Clin Epidemiol 2008;61:991-6. 10.1016/j.jclinepi.2007.11.010 [DOI] [PubMed] [Google Scholar]
- 28. Harrell FE. Regression modeling strategies: with applications to linear models, logistic and ordinal regression, and survival analysis. Springer, 2015. 10.1007/978-3-319-19425-7. [DOI] [Google Scholar]
- 29. Orsini N. Weighted mixed-effects dose–response models for tables of correlated contrasts. Stata J 2021;21:320-47 10.1177/1536867X211025798. [DOI] [Google Scholar]
- 30. Greenland S, Longnecker MP. Methods for trend estimation from summarized dose-response data, with applications to meta-analysis. Am J Epidemiol 1992;135:1301-9. 10.1093/oxfordjournals.aje.a116237 [DOI] [PubMed] [Google Scholar]
- 31. Orsini N, Li R, Wolk A, Khudyakov P, Spiegelman D. Meta-analysis for linear and nonlinear dose-response relations: examples, an evaluation of approximations, and software. Am J Epidemiol 2012;175:66-73. 10.1093/aje/kwr265 [DOI] [PMC free article] [PubMed] [Google Scholar]
- 32. Di Angelantonio E, Bhupathiraju ShN, Wormser D, et al. Global BMI Mortality Collaboration . Body-mass index and all-cause mortality: individual-participant-data meta-analysis of 239 prospective studies in four continents. Lancet 2016;388:776-86. 10.1016/S0140-6736(16)30175-1 [DOI] [PMC free article] [PubMed] [Google Scholar]
- 33. Schünemann HJ, Cuello C, Akl EA, et al. GRADE Working Group . GRADE guidelines: 18. How ROBINS-I and other tools to assess risk of bias in nonrandomized studies should be used to rate the certainty of a body of evidence. J Clin Epidemiol 2019;111:105-14. 10.1016/j.jclinepi.2018.01.012 [DOI] [PMC free article] [PubMed] [Google Scholar]
- 34. Neuenschwander M, Barbaresko J, Pischke CR, et al. Intake of dietary fats and fatty acids and the incidence of type 2 diabetes: A systematic review and dose-response meta-analysis of prospective observational studies. PLoS Med 2020;17:e1003347. 10.1371/journal.pmed.1003347 [DOI] [PMC free article] [PubMed] [Google Scholar]
- 35.Schünemann H, Brożek J, Guyatt G, Oxman A. Grade Handbook. Handbook for grading the quality of evidence and the strength of recommendations using the GRADE approach. Updated October, 2013. https://gdt.gradepro.org/app/handbook/handbook.html. [Google Scholar]
- 36. Jayedi A, Rashidy-Pour A, Khorshidi M, Shab-Bidar S. Body mass index, abdominal adiposity, weight gain and risk of developing hypertension: a systematic review and dose-response meta-analysis of more than 2.3 million participants. Obes Rev 2018;19:654-67. 10.1111/obr.12656 [DOI] [PubMed] [Google Scholar]
- 37. Aune D, Sen A, Prasad M, et al. BMI and all cause mortality: systematic review and non-linear dose-response meta-analysis of 230 cohort studies with 3.74 million deaths among 30.3 million participants. BMJ 2016;353:i2156. [DOI] [PMC free article] [PubMed] [Google Scholar]
- 38. Hu Y, Bhupathiraju SN, de Koning L, Hu FB. Duration of obesity and overweight and risk of type 2 diabetes among US women. Obesity (Silver Spring) 2014;22:2267-73. 10.1002/oby.20851 [DOI] [PMC free article] [PubMed] [Google Scholar]
- 39. Wannamethee SG, Shaper AG. Weight change and duration of overweight and obesity in the incidence of type 2 diabetes. Diabetes Care 1999;22:1266-72. 10.2337/diacare.22.8.1266 [DOI] [PubMed] [Google Scholar]
- 40. Andres R, Elahi D, Tobin JD, Muller DC, Brant L. Impact of age on weight goals. Ann Intern Med 1985;103:1030-3. 10.7326/0003-4819-103-6-1030 [DOI] [PubMed] [Google Scholar]
- 41. Stevens J, Cai J, Pamuk ER, Williamson DF, Thun MJ, Wood JL. The effect of age on the association between body-mass index and mortality. N Engl J Med 1998;338:1-7. 10.1056/NEJM199801013380101 [DOI] [PubMed] [Google Scholar]
- 42. Bender R, Jöckel K-H, Trautner C, Spraul M, Berger M. Effect of age on excess mortality in obesity. JAMA 1999;281:1498-504. 10.1001/jama.281.16.1498 [DOI] [PubMed] [Google Scholar]
- 43. Willett W. Nutritional epidemiology. Oxford University Press, 2012. 10.1093/acprof:oso/9780199754038.001.0001. [DOI] [Google Scholar]
- 44. Bergman RN, Stefanovski D, Buchanan TA, et al. A better index of body adiposity. Obesity (Silver Spring) 2011;19:1083-9. 10.1038/oby.2011.38 [DOI] [PMC free article] [PubMed] [Google Scholar]
- 45. Ashwell M, Gunn P, Gibson S. Waist-to-height ratio is a better screening tool than waist circumference and BMI for adult cardiometabolic risk factors: systematic review and meta-analysis. Obes Rev 2012;13:275-86. 10.1111/j.1467-789X.2011.00952.x [DOI] [PubMed] [Google Scholar]
- 46. Consultation WE, WHO Expert Consultation . Appropriate body-mass index for Asian populations and its implications for policy and intervention strategies. Lancet 2004;363:157-63. 10.1016/S0140-6736(03)15268-3 [DOI] [PubMed] [Google Scholar]
- 47. Maukonen M, Männistö S, Tolonen H. A comparison of measured versus self-reported anthropometrics for assessing obesity in adults: a literature review. Scand J Public Health 2018;46:565-79. 10.1177/1403494818761971 [DOI] [PubMed] [Google Scholar]
- 48. Cawley J, Maclean JC, Hammer M, Wintfeld N. Reporting error in weight and its implications for bias in economic models. Econ Hum Biol 2015;19:27-44. 10.1016/j.ehb.2015.07.001 [DOI] [PubMed] [Google Scholar]
- 49. Chiolero A, Peytremann-Bridevaux I, Paccaud F. Associations between obesity and health conditions may be overestimated if self-reported body mass index is used. Obes Rev 2007;8:373-4. 10.1111/j.1467-789X.2007.00375.x [DOI] [PubMed] [Google Scholar]
- 50. Rücker G, Schwarzer G, Carpenter JR, Schumacher M. Undue reliance on I(2) in assessing heterogeneity may mislead. BMC Med Res Methodol 2008;8:79. 10.1186/1471-2288-8-79 [DOI] [PMC free article] [PubMed] [Google Scholar]
- 51. Brown P, Brunnhuber K, Chalkidou K, et al. How to formulate research recommendations. BMJ 2006;333:804-6. 10.1136/bmj.38987.492014.94 [DOI] [PMC free article] [PubMed] [Google Scholar]
- 52. Guyatt GH, Oxman AD, Kunz R, et al. GRADE Working Group . GRADE guidelines: 7. Rating the quality of evidence--inconsistency. J Clin Epidemiol 2011;64:1294-302. 10.1016/j.jclinepi.2011.03.017 [DOI] [PubMed] [Google Scholar]
- 53. Higgins JP. Commentary: Heterogeneity in meta-analysis should be expected and appropriately quantified. Int J Epidemiol 2008;37:1158-60. 10.1093/ije/dyn204 [DOI] [PubMed] [Google Scholar]
- 54. Ioannidis JP, Patsopoulos NA, Rothstein HR. Reasons or excuses for avoiding meta-analysis in forest plots. BMJ 2008;336:1413-5. 10.1136/bmj.a117 [DOI] [PMC free article] [PubMed] [Google Scholar]
- 55. Cheng L, Zhuang H, Ju H, et al. Exposing the causal effect of body mass index on the risk of type 2 diabetes mellitus: a mendelian randomization study. Front Genet 2019;10:94. 10.3389/fgene.2019.00094 [DOI] [PMC free article] [PubMed] [Google Scholar]
- 56. Xu H, Jin C, Guan Q. Causal effects of overall and abdominal obesity on insulin resistance and the risk of type 2 diabetes mellitus: A two-sample Mendelian randomization study. Front Genet 2020;11:603. 10.3389/fgene.2020.00603 [DOI] [PMC free article] [PubMed] [Google Scholar]
Associated Data
This section collects any data citations, data availability statements, or supplementary materials included in this article.
Supplementary Materials
Web appendix: Supplementary materials
Data Availability Statement
No additional data available.