

Abstract
Introduction
Findings regarding the association between mitochondrial DNA (mtDNA) variants and Alzheimer's disease (AD) are inconsistent.
Methods
We developed a pipeline for accurate assembly and variant calling in mitochondrial genomes embedded within whole exome sequences (WES) from 10,831 participants from the Alzheimer's Disease Sequencing Project (ADSP). Association of AD risk was evaluated with each mtDNA variant and variants located in 1158 nuclear genes related to mitochondrial function using the SCORE test. Gene‐based tests were performed using SKAT‐O.
Results
Analysis of 4220 mtDNA variants revealed study‐wide significant association of AD with a rare MT‐ND4L variant (rs28709356 C>T; minor allele frequency = 0.002; P = 7.3 × 10⁻⁵) as well as with MT‐ND4L in a gene‐based test (P = 6.71 × 10⁻⁵). Significant association was also observed with a MT‐related nuclear gene, TAMM41, in a gene‐based test (P = 2.7 × 10⁻⁵). The expression of TAMM41 was lower in AD cases than controls (P = .00046) or mild cognitive impairment cases (P = .03).
Discussion
Significant findings in MT‐ND4L and TAMM41 provide evidence for a role of mitochondria in AD.
Keywords: Alzheimer's disease, genetic association, mitochondrial haplogroup, mitochondrial variant calling, whole exome sequencing
1. INTRODUCTION
Alzheimer's disease (AD) is a progressive neurodegenerative disorder characterized by memory loss and dementia. 1 The common form of late‐onset AD among persons ages 65 years and older has a substantial genetic component with an estimated heritability of 58% to 79%. 2 Genome‐wide association studies (GWAS) of common and rare variants have identified > 40 susceptibility loci in the nuclear genome, 3 , 4 , 5 , 6 , 7 , 8 , 9 , 10 but a large proportion of the remaining heritability of AD is still unexplained.
Mitochondria are intracellular organelles essential for cell viability by generating energy via the oxidative phosphorylation (OXPHOS) pathway. Mitochondria contain a distinct circular haploid genome of 16,569 bases. Mitochondrial (MT) function decreases with age and its dysfunction is correlated with several age‐related diseases including AD. 11 Recent genetic studies have identified association of a variant in the autosomal gene encoding a subunit of mitochondrial ATP synthase, ATP5PD, with risk of AD and cerebral small vessel disease. 12 , 13 ATP5H, which is embedded within a larger DNA sequence that encodes KCTD2, has an important function in mitochondrial energy production and neuronal hyperpolarization during cellular stress conditions, such as hypoxia or glucose deprivation. However, associations of AD with mtDNA variants are inconsistent, due in part to the limited number of mtDNA variants included in genotyping arrays and lack of systematic variant calling and analysis pipelines. 14 A recent study of MT haploid genomes assembled from whole genome sequences (WGS) of 809 Alzheimer Disease Neuroimaging Initiative (ADNI) cohort participants did not find any significant associations of AD risk or AD‐related endophenotypes with mtDNA single nucleotide variants (SNVs) or MT haplogroups, 15 probably due to a small sample size.
Because the mitochondrial genome lacks introns and intergenic regions, except for the 1124 bp D‐loop/control region, which is noncoding and contains the origin of replication and origin of transcription, we hypothesized that mtDNA genotypes can be deduced from whole‐exome sequencing (WES) data with accuracy comparable to genotypes called from WGS data. Here, we report the development of a pipeline for calling mtDNA‐variant genotypes and MT haplogroups from WES data obtained from nearly 11,000 subjects in the Alzheimer's Disease Sequencing Project (ADSP) Discovery Phase cohort and testing association of these variants and haplogroups, as well as with variants in nuclear genes that encode proteins involved in mitochondrial function, with AD risk.
RESEARCH IN CONTEXT
Systematic review: The authors are members of the Alzheimer's Disease Sequencing Project and therefore are familiar with emerging pertinent literature. PubMed searches were conducted to identify other relevant publications. References that support the significance of the identified risk loci are cited.
Interpretation: Although both common and rare variants in nuclear genome in > 30 late‐onset Alzheimer's disease (LOAD) risk genes have been identified from genome‐wide association and whole exome sequencing (WES) studies, this report first demonstrated that accurate mtDNA variants can be derived from a WES platform. Study‐wide significant associations of AD with an MT gene (MT‐ND4L) and an MT‐related nuclear gene (TAMM41) were identified, providing further evidence for the role of mitochondria in AD.
Future directions: A better understanding of the molecular mechanisms underlying these associations will require functional experiment studies of the connections of genetic variants to mitochondrial dysfunction and further to AD‐related neuropathogenesis. Further studies are also needed to determine whether MT‐ND4L and TAMM41 are suitable targets for development of novel therapies.
2. METHODS
2.1. Participants
The ADSP performed WES of DNA specimens obtained from 5778 AD cases and 5136 controls, including 5519 AD cases and 4917 cognitively normal elderly controls of European ancestry (EA) and 218 AD cases and 177 controls of Caribbean Hispanic (CH) heritage. Notably, the proportion of AD cases with a known positive family history of dementia is much higher in the CH sample (78.9%) than the EA sample (9.2%). Detailed descriptions of the ADSP WES discovery phase study design and sequencing protocol have been published elsewhere. 16 After performing a series of filtering steps to identify duplicate samples and subjects with low genotype call rates, 10,436 EA and 395 CH individuals remained for further study. Subject characteristics are shown in Table 1 and described in detail elsewhere. 9
TABLE 1.
Participant characteristics
| AD cases (N = 5737) | Cognitively normal controls (N = 5094) | |||||||||
|---|---|---|---|---|---|---|---|---|---|---|
| Ethnic group | Total N | N | N (%) enriched* | Mean Age | Female Sex (%) | APOE ɛ4 carrier (%) | N | Age (mean) | Female Sex (%) | APOE ɛ4 carrier (%) |
| European ancestry | 10,436 | 5519 | 507 (9.2) | 76.0 | 56.5 | 41.0 | 4917 | 86.5 | 59.1 | 12.8 |
| Caribbean Hispanic | 395 | 218 | 172 (78.9) | 74.8 | 63.8 | 36.7 | 177 | 73.9 | 60.5 | 35.6 |
Abbreviation: APOE, apolipoprotein E.
2.2. Whole exome sequencing, mitochondrial variant calling, and quality control
Details of library preparation, sequencing protocols, and autosomal nuclear variant calling pipelines were described previously. 9 In brief, 100 bp paired‐end reads derived from cram files were mapped to the human revised Cambridge Reference Sequence (rCRS) for human mitochondrial DNA (GenBank NCBI accession number: NC_012920/hg19) 17 using the Burrows‐Wheeler Aligner (BWA). 18 The haploid mode implemented in the GATK 3.7 HaplotypeCaller package 19 , 20 , 21 was used to call mtDNA biallelic SNVs. We adapted the quality control (QC) protocols developed by the ADSP QC Working Group 22 to mtDNA SNVs to generate a high‐quality variant call set. Because the Mitochondrial Chromosome (chrM) was not a WES capture target, the off‐target read coverage in WES data of the MT genome is much less than that for the autosomal genome. This off‐target mtDNA was still adequate due to the relatively high level of mtDNA relative to autosomal DNA. Therefore, we developed a pipeline for calling mtDNA variants and defined a QC metric based on comparative analysis with mtDNA variants called from WGS data for ADNI participants 15 and WGS data from the 1000 Genomes (1000G) reference panel. 23 Specifically, 4220 SNVs and small indels remained after excluding low‐quality, multi‐allelic, and monomorphic SNVs using filters of GQ < 20 and DP < 3 and a missing rate > 20%. After removing 182 subjects with missing values for all 4220 mtDNA variants, 10,610 subjects remained for haplogroup calling, downstream comparisons, and association analyses. Characteristics of these subjects are presented in Table 1. mtDNA variants were annotated using Gencode v24 (chrM.gencode.v24.annotation.gff3) and the Mitomaster sequence analysis tool within the MITOMAP human mitochondrial genome database. 24
2.3. Mitochondrial variant validation and comparison
To validate mtDNA variants called from the ADSP WES data, we applied the same calling pipeline to the ADNI WGS data (n = 809) and the 1000G WGS data (n = 2534). After calling and QC, we compared our mtDNA variants called from the WES data to that called from the WGS data from ADNI and 1000G. In addition, we compared our MT variants to known variants deposited in the MITOMAP database 24 and with 226 mtDNA variants genotyped in 4883 subjects in the Alzheimer's Disease Genetic Consortium (ADGC) using the Illumina Human Exome microarray. 25 Among 226 mtDNA variants in the exome chip, 174 were also called in the ADSP WES data. We verified the concordance of reference and alternative alleles for each of these mtDNA variants in 4883 subjects who were common to the ADGC and ADSP datasets.
2.4. Mitochondrial haplogroup classification
HaploGrep2 software 26 was used to call phylogenetic clusters (haplogroups) from the filtered 4220 MT variants in the 10,610 subjects. The mtDNA haplogroups were classified with PhyloTree, Build 17, which comprises nearly 5500 haplogroups. 27
2.5. Association analysis methods
2.5.1. Single mtDNA variant association analyses
Association of AD with each mtDNA variant having a minor allele count (MAC) ≥10 and call rate ≥ 0.8 was tested in each ethnic population (number of variants = 802 in EA and 135 in CH) using the Score test in seqMeta 28 with two additive logistic regression models as previously described. 9 Model 1 included covariates for sequencing center and principal components (PCs) of ancestry (the first 10 PCs for EA and the 3 PCs for CH with P < .1 with association with AD) to identify variants whose effects on AD risk are confounded by age and sex in light of the unique ascertainment scheme for the WES sample. 9 Model 2 included these covariates and terms for age and sex. Results from analyses of 84 variants that were successfully called and passed criteria for single‐variant analysis in the EA and CH data sets were combined using an inverse variance–weighted meta‐analysis approach implemented in seqMeta. Bonferroni‐corrected thresholds were applied to define study‐wide significance (SWS) in each group (EA: P < 6.20 × 10⁻⁵, CH: P < 3.70 × 10⁻⁴, and meta P < 5.90 × 10⁻⁴).
2.5.2. Gene‐based association analysis
SNVs were annotated using a scheme developed by the ADSP Annotation Working Group and the HmtDB resource, 29 which hosts a database of human mitochondrial genome sequences from individuals with healthy and disease phenotypes 29 to discriminate variants predicted to have high or pathogenic functional impact on the protein product (i.e., HmtDB_Pathogenicity = “pathogenic”). Association was tested for genes with ≥ 2 variants and a cumulative MAC (cMAC) ≥ 10 after excluding variants with a minor allele frequency (MAF) ≥ 0.05 using the same models as in the individual variant analyses and the SKAT‐O program in seqMeta. 28 Separate analyses were performed for the EA (16 genes) and CH (12 genes) groups. The ethnic‐specific gene‐based results were combined by meta‐analysis of Z‐scores weighted by the number of subjects using seqMeta, assuming the same direction of effect in both populations. Significance thresholds for each analysis were determined based on the number of genes tested in each group (EA: P < 3.13 × 10⁻³, CH: P < 4.17 × 10⁻³, and total: P < 3.57 × 10⁻³).
2.5.3. mtDNA haplogroups association analysis
Association of AD with mtDNA haplogroups was tested separately in each ethnic group using a logistic regression model with covariates for age and sex.
2.5.4. Gene‐based association analysis of nuclear‐encoded genes related to mitochondrial function
In light of evidence suggesting that nuclear genes involved in mitochondrial function are also associated with AD, 30 we tested the association of AD with 1158 nuclear‐encoded genes with evidence of mitochondrial protein localization and protein distribution across 14 tissues identified from a public database MitoCarta2.0. 31 Because prior investigations of individual variants in these genes in the discovery dataset studied here 9 and in much larger samples 3 , 6 did not detect significant associations, we hypothesized that functional rare variants may contribute to AD risk and there is an increased chance to detect association with them using a burden test. Variants with predicted functional impact were selected and classified using the Ensembl Variant Effect Predictor (VEP) 32 and SnpEff 33 software. Variants annotated as splice acceptor, splice donor, stop gained, frameshift, stop lost, start lost, or transcript amplification were classified as high impact. These variants plus variants annotated as in‐frame insertion, in‐frame deletion, missense variant, or protein altering were classified as high or moderate impact. Association was tested for each gene using the approach described in Section 2.5.2. Significance thresholds for each analysis were determined based on the number of genes tested in each group (high impact variants—EA: P < 2.30 × 10⁻⁴, CH: P < 5.56 × 10⁻³, and total sample: P < 3.30 × 10⁻⁴; high or moderate impact variants—EA: P < 5.03 × 10⁻⁵, CH: P < 7.49 × 10⁻⁵, and total sample: P < 5.48 × 10⁻⁵).
2.6. Bioinformatics analysis methods
Differential gene expression (DGE) and network analyses were performed for 1171 protein‐coding genes (13 MT and 1158 autosomal) related to mitochondrial function using RNAseq data derived from the dorsolateral prefrontal cortex (DLPFC) of 634 participants (210 controls, 167 mild cognitive impairment [MCI] cases, and 257 AD cases) of the Religious Orders Study and Rush Memory and Aging Project (ROSMAP). RNAseq data were obtained from the AMP‐AD Knowledge Portal (Synapse: syn3388564). Reads were mapped to the human reference sequencing (hg38) using STAR v2.4.2a 34 and expression of protein‐coding genes was quantified using RESM v1.2.29 35 with Gencode 28 (Ensembl 92) gene annotation. After filtering out genes with low expression level determined as the average of log (counts per million reads) > 1, differential expression was evaluated for 13,650 protein‐coding genes using Deseq2. 36 The association of differential gene expression with clinical outcome was evaluated in pairwise comparisons of AD, MCI, and control subjects using regression models including covariates for age, sex, and post mortem interval (PMI). Gene coexpression networks were constructed using weighted gene coexpression network analysis (WGCNA) 37 across all 635 samples, and the 13 MT genes and 1158 nuclear genes involved in MT served as input for these analyses. Association of significant modules identified by WGCNA with AD status and several AD‐related endophenotypes including Braak stage and neuritic plaque density was evaluated by eigenvalues derived from each module.
2.7. Polygenic risk scores
Polygenic risk scores (PRS) for AD were calculated using summary results for single nucleotide polymorphisms (SNPs) with a P‐value less than 1.0 × 10⁻⁵ obtained from a recent large AD GWAS. 6 Linkage disequilibrium (LD) pruning was performed to exclude SNPs that were correlated (r 2 > 0.5) with another variant with smaller P‐value within a 250 kb window. SNPs were weighted by their effect sizes (beta value) in the GWAS. A total of 226 LD‐pruned SNPs was included in the calculation of the PRS for 221 ROSMAP subjects having both GWAS and RNA‐seq expression data. The PRS was tested for association with the eigenvalue derived from each significant module.
3. RESULTS
3.1. MT DNA variant calling, validation, and comparison
We identified 4220 high‐quality mtDNA SNVs in the ADSP WES dataset (GQ > 20, DP > 3, call rate ≥ 0.8). Using the same calling and QC pipeline, 1851 mtDNA variants were called in the ADNI WGS dataset 15 and 3892 mtDNA variants were called in the 1000G WGS dataset. 23 The mtDNA variants identified in the WES dataset included 84% (1548/1851) of the total found in the ADNI dataset. Of the 1548 variants common to both datasets, 1332 (86%) also matched at allele level (i.e., reference and alternate alleles). Similarly, the set of mtDNA variants identified in the WES dataset included about 68% (2628/3892) of the total variants present in the 1000G dataset and 83% of the variants common to both datasets (2169/2628) also matched allele level. In addition, the WES dataset contained 3620 of the 3855 (94%) of biallelic mtDNA variants in the MitoMap database. 24 To further validate the accuracy of our mtDNA variant calling pipeline, we compared genotypes for 174 mtDNA variants determined for 4883 subjects to both WES and Exome Chip data. The concordance for the reference allele was 99.65% to 99.98% for 20 variants and 100% for the remaining 154 variants (Table S1 in supporting information). One alternate allele that was observed in one subject in the exome chip dataset was not called in the WES dataset. The concordance of minor alleles was 50% to 86% for 10 variants, 90% to 99% for 12 variants, 99.0% to 99.9% for 20 variants, and 100% for 112 variants. An additional 19 variants were monomorphic in both datasets.
A total of 16 major MT haplogroups were called by HaploGrep2 using the same human MT reference genome sequence (NC_012920; Table S2 in supporting information). Among EAs, Haplogroup I was nominally associated with AD (odds ratio [OR] = 1.37, P = .02), but this result was not significant after adjusting for the number of haplogroup tests. The MT haplogroup frequencies differ between the CH and EA samples, reflecting the ancestral admixture of African, European, and Native American populations of Caribbean populations. L, which is the most common haplogroup in the CH sample (frequency = 0.5), is the African ancestral MT haplogroup. While there is a modest association of AD with the two ancestral Native American haplogroups (B and C, P < .04) in the CH sample, these results are not significant after multiple‐test correction (Table S3 in supporting information).
3.2. Association of AD with MT variants and genes
In the combined EA and CH sample, AD was significantly associated with missense mutation rs28357675 (Asn119Ser) in MT‐ND6 (P = 5.3 × 10⁻⁴) and synonymous variant rs193302991 in MT‐CYB (P = 5.14 × 10⁻⁴) after adjusting for age and sex (Table 2). These results were more significant in the relatively small CH sample, an observation that may be explained by the higher min or allele count for each of these variants in that group. A near study‐wide significant result (OR = 7.52; P = 7.3 × 10⁻⁵) was observed in EAs with a rare MT‐ND4L variant (rs28709356 C>T, MAF = 0.002). [Correction added on August 10, 2021 after first online publication: The preceding sentence was revised from, “... was observed in EAs with the MT‐ND4L Asp88Glu missense mutation (rs28709356 MAF=0.002). This mutation is predicted to be deleterious (SIFT score=0.004).”] ND4L is highly expressed in multiple brain regions (Figure S1 in supporting information). Gene‐based tests focused on pathogenic/high‐impact variants revealed that MT‐ND4L was SWS in EA (P = 9.36 × 10⁻⁵) and in the total sample (meta P = 6.71 × 10⁻⁵) under Model 2 (Table 3). The association with MT‐ND5 was also SWS in the total sample (meta P = 3.3 × 10⁻³). None of the 16 MT haplogroups identified in the sample were associated with AD after multiple test correction (Table S2).
TABLE 2.
MT single variant results
| European ancestry | Caribbean Hispanic | Total | |||||||||||||
|---|---|---|---|---|---|---|---|---|---|---|---|---|---|---|---|
| Top SNV | rsID | Function | Gene | Model | MAF (%) | MAC | β (se) | P value | MAF (%) | MAC | β (se) | P value | MAC | β (se) | P value |
| 26:10733:C:T | rs28709356 | Synonymous | MT‐ND4L | M1 | 0.30 | 26 | 0.96 (0.39) | .01 | 0 | NA | NA | NA | NA | NA | NA |
| M2 | 0.30 | 26 | 2.02 (0.51) | 7.30 × 10⁻⁵ | 0 | NA | NA | NA | NA | NA | NA | ||||
| 26:14318:T:C | rs28357675 | Missense Asn119Ser | MT‐ND6 | M1 | 0.24 | 12 | 1.07 (0.59) | .07 | 4.42 | 17 | 1.59 (0.52) | 2.50 × 10⁻³ | 29 | 1.36 (0.39) | 5.25 × 10⁻⁴ |
| M2 | 0.24 | 12 | 0.94 (0.77) | .23 | 4.42 | 17 | 1.59 (0.53) | 2.50 × 10⁻³ | 29 | 1.38 (0.44) | 1.48 × 10⁻³ | ||||
| 26:15301:G:A | rs193302991 | Synonymous | MT‐CYB | M1 | 1.20 | 109 | 0.46 (0.19) | .02 | 44.9 | 162 | 0.59 (0.23) | .01 | 271 | 0.52 (0.15) | 5.98 × 10⁻⁴ |
| M2 | 1.20 | 109 | 0.55 (0.25) | .02 | 44.9 | 162 | 0.62 (0.23) | 7.86 × 10⁻³ | 271 | 0.59 (0.17) | 5.14 × 10⁻⁴ | ||||
Model 1 (M1) = AD ∼ Center + PCs + SNV; Model 2 (M2): AD ∼ Center + PCs + age + sex.
Study‐wide significance threshold was defined by 0.05/the number of variants tested. EA: P < 6.2 × 10⁻⁵, CH: P < 3.7 × 10⁻⁴, total: P < 5.9 × 10⁻⁴.
Abbreviations: AD, Alzheimer's disease; EA, European ancestry; CH, Caribbean Hispanic; MT, mitochondrial; PCs, principal components; SNV, single nucleotide variants.
[Correction added on August 10, 2021 after first online publication: The first value under the “Function” column was revised from “Missense Asp88Glu”.] .
TABLE 3.
Mitochondrial gene‐based results
| Gene | Model | European ancestry | Caribbean Hispanic | Total | ||||||
|---|---|---|---|---|---|---|---|---|---|---|
| # SNPs | cMAC | P‐value | # SNPs | cMAC | P‐value | # SNPs | cMAC | P‐value | ||
| MT‐ND4L | M1 | 14 | 89 | .04 | 3 | 5 | NC | 14 | 94 | .06 |
| M2 | 14 | 89 | 9.36 × 10⁻⁵ | 3 | 5 | NC | 14 | 94 | 6.71 × 10⁻⁵ | |
| MT‐ND2 | M1 | 49 | 460 | .08 | 14 | 101 | 8.0 × 10⁻³ | 53 | 561 | .02 |
| M2 | 49 | 460 | .32 | 14 | 101 | 8.3 × 10⁻³ | 53 | 561 | .09 | |
| MT‐ND5 | M1 | 159 | 2741 | .02 | 25 | 387 | .47 | 165 | 3128 | 3.30 × 10⁻³ |
| M2 | 159 | 2741 | .37 | 25 | 387 | .41 | 165 | 3128 | .06 | |
Model 1 (M1) = AD ∼ Center + PCs + Gene; Model 2 (M2): AD ∼ Center + PCs + Gene + age + sex.
Study‐wide significance threshold was defined by 0.05/the number of genes tested: EA: P < 3.13 × 10⁻³, CH: P < 4.17 × 10⁻³, total: P < 3.57 × 10⁻³.
Abbreviations: AD, Alzheimer's disease; CH, Caribbean Hispanic; cMAC, cumulative minor allele count; EA, European ancestry; MT, mitochondrial; NC, not calculated because of an insufficient number of minor alleles; PCs, principal components; SNPs, single nucleotide polymorphisms.
3.3. Association results of nuclear‐encoded mitochondrial genes
Of the 1158 nuclear genes encoding proteins related to mitochondrial function, 217 genes in EAs and nine genes in the CH group contained multiple high‐impact variants. None of the tests with these genes were SWS; however, in the model without adjustment for age and sex (Model 1), GPD2 approached the SWS threshold in the EA sample (P = 2.7 × 10⁻⁴) and combined EA+CH groups (P = 3.7 × 10⁻⁴, Table 4A). In analyses that included high‐ and moderate‐impact variants, SWS association was observed with TAMM41 (P = 2.7 × 10⁻⁵) in the EA group for the model adjusting for age and sex (Table 4B). None of the gene‐based tests were SWS in the CH group, probably because of the small sample size.
TABLE 4.
Gene‐based results for nuclear‐encoded genes related to mitochondrial function
| European ancestry | Caribbean Hispanic | Total | ||||||
|---|---|---|---|---|---|---|---|---|
| Variant impact | Gene | Model | # SNPs | P‐value | # SNPs | P‐value | # SNPs | P‐value |
| High | GPD2 | M1 | 5 | 2.70 × 10⁻⁴ | NA | NA | 5 | 3.70 × 10⁻⁴ |
| M2 | 5 | .005 | NA | NA | 5 | .0062 | ||
| High/moderate | TAMM41 | M1 | 30 | .0025 | 6 | .95 | 34 | .0075 |
| M2 | 30 | 2.70 × 10⁻⁵ | 6 | .91 | 34 | 4.60 × 10⁻⁴ | ||
| GPT2 | M1 | 35 | .27 | 4 | 4.00 × 10⁻³ | 38 | .05 | |
| M2 | 35 | .51 | 4 | 3.90 × 10⁻³ | 38 | .06 | ||
Model 1 (M1) = AD ∼ Center + PCs + Gene; Model 2 (M2): AD ∼ Center + PCs + Gene + age + sex.
Study‐wide significance threshold was defined by 0.05/the number of genes tested.
High impact variants: EA: P < 2.3 × 10⁻⁴, CH: P < 5.56 × 10⁻³, total: P < 3.30 × 10⁻⁴.
High/moderate impact variants: EA: P < 5.03 × 10⁻⁵, CH: P < 7.49 × 10⁻⁵, total: P < 5.48 × 10⁻⁵.
Abbreviation: SNPs, single nucleotide polymorphisms.
3.4. Functional analysis results
Analysis of the ROSMAP RNAseq data derived from the DLPFC region showed that expression of TAMM41 is lower in AD cases than controls (P = .00046) or MCI cases (P = .03), but not different between MCI cases and controls (P = .25). The expression of GPT2 is higher in AD cases than controls (P = .00047), but not different from MCI cases (P = .10) and between MCI cases and controls (P = .14, Table 5). None of the MT genes are differentially expressed between AD cases and controls; however, trends of increased expression of three of these genes (MT‐ND5, MT‐ATP8, and MT‐CO1) in AD cases approach nominal significance (P < .06, Table S4 in supporting information).
TABLE 5.
Differential expression of TAMM41 and GPT2 in dorsolateral prefrontal cortex of 634 ROSMAP subjects
| TAMM41 | GPT2 | |||||
|---|---|---|---|---|---|---|
| Comparison Groups* | Base mean | Log2 fold change | P‐value | Base mean | Log2 fold change | P‐value |
| AD vs. Normal | 134 | −0.11 | .00046 | 2419 | 0.18 | .00047 |
| AD vs. MCI | 131 | −0.07 | .03 | 2477 | 0.09 | .10 |
| MCI vs. Normal | 134 | −0.04 | .25 | 2419 | 0.08 | .14 |
Abbreviations: AD, Alzheimer disease; MCI, mild cognitive impairment.
Sample sizes: AD = 257; MCI = 167, normal = 210.
Co‐expression network analysis of 13 MT‐encoded and 1158 nuclear‐encoded mitochondrial genes revealed four co‐expression modules (Figure 1). Three of these modules were also significantly associated with the CERAD neuritic plaque score, particularly Module 1 (P = 7.0 × 10⁻⁴) and Module 3 (P = 9.0 × 10⁻⁴). Module 1 is also associated with Braak stage (P = .007), clinical and neuropathological AD status (P = .006), and Mini‐Mental State Examination score (P = 6.0 × 10⁻⁴). Gene Ontology (GO) analysis of these four modules revealed significant enrichment in Module 1 of 168 MT‐related genes as expected of genes involved in mitochondrial functions, as well as for genes with roles in several neurodegenerative disorders including AD (P < 1.95 × 10⁻¹⁰, Table 6). The PRS for AD was significantly associated with Module 1 (P = .01) and module 3 (P = .03, Figure 1).
FIGURE 1.
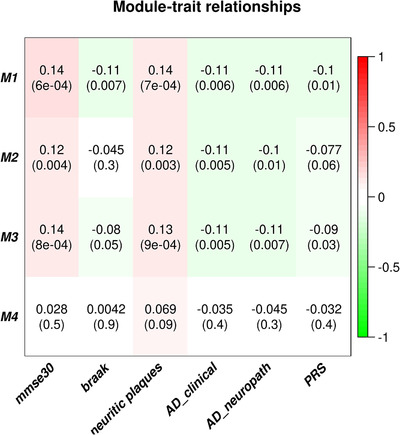
Heatmap of module‐trait relationships depicting correlations between module eigengenes and clinical/pathological Alzheimer's disease (AD) status and AD‐related endophenotypes traits. Numbers in the table correspond to the coefficient and P‐value (in parentheses) for the pairwise correlations. The degree of correlation is illustrated with the color legend. Note that increasing Mini‐Mental State Examination (MMSE) and plaque scores, and decreasing values for Braak stage and AD status, are in the direction of normal
TABLE 6.
Gene Ontology enrichment analysis results using 168 MT‐related genes in Module 1
| Term | Count | % | P‐value | Genes | Adjusted P‐value |
|---|---|---|---|---|---|
| GO:0070125∼mitochondrial translational elongation | 18 | 10.98 | 1.20E‐18 | MRPL53, MRPL52, MRPS26, MRPS16, MRPS34, MRPL4, MRPL41, AURKAIP1, MRPS12, MRPS24, MRPL20, GADD45GIP1, MRPL12, MRPL28, MRPL54, MRPL55, MRPL38, MRPL34 | 6.70E‐16 |
| GO:0070126∼mitochondrial translational termination | 18 | 10.98 | 1.49E‐18 | MRPL53, MRPL52, MRPS26, MRPS16, MRPS34, MRPL4, MRPL41, AURKAIP1, MRPS12, MRPS24, MRPL20, GADD45GIP1, MRPL12, MRPL28, MRPL54, MRPL55, MRPL38, MRPL34 | 8.28E‐16 |
| GO:0032981∼mitochondrial respiratory chain complex I assembly | 15 | 9.15 | 3.05E‐16 | NDUFV3, NDUFS7, NDUFS6, NDUFB11, NDUFA3, NDUFB10, NDUFAF8, NDUFB7, NDUFV1, NDUFS8, NDUFA13, ECSIT, NDUFB1, NDUFA11, NDUFAF3 | 1.86E‐13 |
| GO:0003735∼structural constituent of ribosome | 22 | 13.41 | 4.32E‐16 | MRPL52, MRPS16, MRPL4, MRPS34, MRPL41, SLC25A6, MRPS12, MRPS24, MRPL20, SLC25A11, MRPL12, MRPL28, SLC25A10, SLC25A22, MRPL55, SLC25A1, MRPL57, SLC25A45, SLC25A39, SLC25A42, MRPL34, SLC25A41 | 1.09E‐13 |
| GO:0006412∼translation | 21 | 12.80 | 1.24E‐13 | MRPL52, MRPS16, MRPL4, MRPL41, PDF, SLC25A6, MRPS12, MRPS24, MRPL20, SLC25A11, MRPL28, SLC25A10, SLC25A22, MRPL55, SLC25A1, MRPL57, SLC25A45, SLC25A39, SLC25A42, MRPL34, SLC25A41 | 6.90E‐11 |
| hsa05012: Parkinson's disease | 17 | 10.37 | 1.64E‐13 | NDUFB11, NDUFB10, NDUFA3, NDUFB7, SLC25A6, COX8A, CYC1, NDUFA13, COX5B, NDUFB1, NDUFA11, NDUFV3, NDUFS7, NDUFS6, UQCR11, NDUFV1, NDUFS8 | 1.38E‐11 |
| GO:0006120∼mitochondrial electron transport, NADH to ubiquinone | 12 | 7.32 | 4.67E‐13 | NDUFV3, NDUFS7, NDUFS6, NDUFB11, NDUFB10, NDUFA3, NDUFB7, NDUFV1, NDUFS8, NDUFA13, NDUFB1, NDUFA11 | 2.60E‐10 |
| hsa00190: Oxidative phosphorylation | 16 | 9.76 | 1.03E‐12 | NDUFB11, NDUFB10, NDUFA3, NDUFB7, COX8A, CYC1, NDUFA13, COX5B, NDUFB1, NDUFA11, NDUFS7, NDUFV3, NDUFS6, UQCR11, NDUFV1, NDUFS8 | 8.67E‐11 |
| hsa05010: Alzheimer's disease | 17 | 10.37 | 2.32E‐12 | NDUFB11, NDUFB10, NDUFA3, NDUFB7, COX8A, CYC1, NDUFA13, BAD, COX5B, NDUFB1, NDUFA11, NDUFS7, NDUFV3, NDUFS6, UQCR11, NDUFV1, NDUFS8 | 1.95E‐10 |
| hsa04932: Non‐alcoholic fatty liver disease (NAFLD) | 16 | 9.76 | 6.75E‐12 | NDUFB11, NDUFB10, NDUFA3, NDUFB7, COX8A, CYC1, NDUFA13, COX5B, NDUFB1, NDUFA11, NDUFS7, NDUFV3, NDUFS6, UQCR11, NDUFV1, NDUFS8 | 5.67E‐10 |
| hsa05016: Huntington's disease | 17 | 10.37 | 1.83E‐11 | NDUFB11, NDUFB10, NDUFA3, NDUFB7, SLC25A6, COX8A, CYC1, NDUFA13, COX5B, NDUFB1, NDUFA11, NDUFV3, NDUFS7, NDUFS6, UQCR11, NDUFV1, NDUFS8 | 1.54E‐09 |
| GO:0008137∼NADH dehydrogenase (ubiquinone) activity | 10 | 6.10 | 3.00E‐10 | NDUFV3, NDUFS7, NDUFS6, NDUFB10, NDUFA3, NDUFB7, NDUFV1, NDUFS8, NDUFA13, NDUFB1 | 7.36E‐08 |
| hsa01100: Metabolic pathways | 33 | 20.12 | 8.63E‐09 | PTGES2, BCAT2, NDUFB7, CYC1, AGMAT, COX5B, NDUFB1, NDUFS7, NDUFS6, UQCR11, NT5M, NDUFS8, DHODH, FASN, NT5C, NDUFB11, NDUFA3, NDUFB10, ACADS, COX8A, MCAT, NDUFA13, NDUFA11, NDUFV3, TST, NME4, PYCR2, NME3, NDUFV1, FPGS, GUK1, DCXR, MPST | 7.25E‐07 |
| IPR018108: Mitochondrial substrate/solute carrier | 9 | 5.49 | 1.34E‐08 | SLC25A11, SLC25A10, SLC25A6, SLC25A22, SLC25A1, SLC25A39, SLC25A45, SLC25A42, SLC25A41 | 4.98E‐06 |
| IPR023395: Mitochondrial carrier domain | 9 | 5.49 | 1.34E‐08 | SLC25A11, SLC25A10, SLC25A6, SLC25A22, SLC25A1, SLC25A39, SLC25A45, SLC25A42, SLC25A41 | 4.98E‐06 |
| IPR002067: Mitochondrial carrier protein | 7 | 4.27 | 8.19E‐08 | SLC25A6, SLC25A22, SLC25A1, SLC25A39, SLC25A45, SLC25A42, SLC25A41 | 3.05E‐05 |
| GO:0003954∼NADH dehydrogenase activity | 5 | 3.05 | 3.86E‐07 | NDUFS7, NDUFV1, NDUFS8, NDUFA13, NDUFB1 | 9.47E‐05 |
| GO:0032543∼mitochondrial translation | 6 | 3.66 | 1.66E‐05 | MRPS16, MRPS34, PTRH1, MRPS12, MRPS24, MRPL57 | 0.0092 |
| GO:0003824∼catalytic activity | 10 | 6.10 | 4.22E‐05 | ECI1, D2HGDH, BCAT2, DHODH, FASN, GCAT, ISOC2, PMPCA, NTHL1, ACSF3 | 0.010 |
4. DISCUSSION
Numerous studies indicate that mitochondrial dysfunction may portend AD‐related brain pathology, 38 and mitochondrial genes are altered in blood in early‐stage AD. 39 Emerging evidence suggests a role for mitochondria in synaptic transmission and neurodegeneration, and the ability of dysfunctional mitochondria to trigger apoptosis. 40 A recent study demonstrated that healthy mitochondria can halt amyloid beta (Aβ) proteotoxic diseases, such as AD, as increasing mitochondrial proteostasis reduces amyloid aggregation in cells, worms, and in transgenic mouse models of AD. 41
To determine whether mtDNA mutations may influence the pathogenesis of AD, we developed a pipeline for identifying mtDNA variants in WES data and assessing the quality of MT genotype calls. To validate our pipeline and mtDNA variants called, we compared genotypes in the ADSP WES dataset to those derived from ADNI and 1000G reference panel WGS datasets and genotypes for the ADGC dataset obtained using an exome microarray chip. The mtDNA genotypes obtained from these various sources were very similar, suggesting that mitochondrial variants and haplogroups can be reliably derived from WES data. Using this pipeline, we derived a set of high‐confidence mtDNA genotypes and haplogroups from a WES dataset comprised of 5737 AD cases and 5094 controls from the ADSP.
Analysis of these data revealed in the relatively large EA portion of the sample association of AD with a rare synonymous mutation (rs28709356, Asp88Asp) in MT‐ND4L as well as with an aggregate of 14 MT‐ND4L SNVs in a gene‐based test. [Correction added on August 10, 2021 after first online publication: The preceding sentence was revised from, “... with a rare missense deleterious mutation (rs28709356, Asp88Glu) in MT‐ND4L...”.] In the total sample, we found association with rare variants in MT‐ND6 and MT‐CYB, results accounted for primarily by the much smaller CH sample. A SWS association was also detected by gene‐based testing with MT‐ND5 in the total sample. In contrast, few previous reports of association of mitochondrial haplogroups and SNPs with AD risk and cognitive function in datasets much smaller than this study have been replicated. 42 , 43 , 44 There is some evidence suggesting that interactions between mitochondrial genetic variation and apolipoprotein E (APOE) genotype influences AD risk. 45 , 46 We also showed that a PRS for AD derived from nuclear SNP results obtained by a large AD GWAS was associated with an AD‐related gene coexpression module enriched for MT genes, thus providing insights about the joint contributions of variation in mitochondrial genes and nuclear‐encoded genes related to mitochondrial function to AD. This observation is consistent with a recent ADNI study which found association of AD with interactions of particular mitochondrial DNA haplogroups and a PRS derived from nuclear‐encoded mitochondrial genes. 47
MT‐ND4L, MT‐ND6, MTND2, and MT‐ND5 encode subunits of complex I (NADH dehydrogenase), and are active in metabolic pathways and oxidative phosphorylation. There is some evidence suggesting that impairments in complex I enzyme activities and subunit assembly are involved in AD. 43 , 48 , 49 Aβ peptide alters the enzyme activity of complex I, and mitochondrial functions can be negatively affected by Aβ. 50 A recent multivariate meta‐analysis concluded that complex I and IV enzymes are deficient in AD. 51 MT‐ND4L encodes the mitochondrial NADH dehydrogenase subunit 4L involved in ubiquinone activity and oxidoreductase activity. Rare MT‐ND4L SNVs have been associated with bipolar disorder, major depression, and Leber's optic atrophy. 52 , 53 , 54 MT‐ND2 was previously been associated with AD 55 and a MT‐ND6 variant was associated with a significant decline in cognitive function. 43 MT‐CYB, which encodes a complex III subunit, has not been previously linked to AD.
We also tested association of AD with functional variants in 1158 nuclear genes that encode proteins involved in mitochondrial function. Although no significant findings were identified with any individual variants in these genes, SWS association was observed with a collective group of SNVs in TAMM41 in a gene‐based test. In addition, we showed that expression of TAMM41 was higher in brains from AD cases than MCI cases, suggesting a stage‐dependent indicator for conversion to AD. The gene product of TAMM41, mitochondrial translocator assembly and maintenance protein 41 homolog, is a mitochondrial membrane maintenance protein and is required for the biosynthesis of phospholipid, CDP‐diacylglycerol, cardiolipin, and phosphatidylinositol (PI). 56 It has been shown that selectively inhibiting Aβ‐induced PI‐4,5‐bisphosphate (PIP2) hydrolysis in the CA3 region of the hippocampus strongly prevents oligomeric Aβ‐induced suppression of prion protein at the SC‐CA1 synapse and rescues synaptic and spatial learning and memory deficits in APP/PS1 mice. 57
Several strengths and limitations of our study warrant discussion. To our knowledge, this is the first large study of rare MT genetic variants in a sample of carefully clinically and genetically characterized AD cases and elderly cognitively healthy controls. One limitation of the study is that the sample included a comparatively small number of CH participants (N = 396) and thus there was little power to detect associations with rare variants in this group. In addition, our study did not evaluate association of AD with individual variants in nuclear‐encoded mitochondrial genes because these tests have already been performed in this dataset 9 and for common variants in much larger GWAS datasets that include subjects in this study 3 , 6 without any significant results. Instead, we evaluated the effects of aggregated rare variants in and differential expression between AD cases and controls in these genes. This strategy yielded significant associations with three genes (GPD2, TAMM41, and GPT2), and two of them (TAMM41 and GPT2) showed significant differential expression. We also recognize that our findings should be replicated in independent AD WES or WGS samples that are sufficiently large to detect associations with rare variants, noting that approximately one‐half of our significant results were observed only in or primarily due to the CH dataset. Finally, due to the low abundance of reads mapping to the MT genome in WES data, it is challenging to estimate accurately MT heteroplasmy and MT copy number (i.e., the number of copies of the MT genome within a cell). Because both have been linked to aging 30 and several neurodegenerative diseases, 58 , 59 future research should focus on quantifying MT heteroplasmy and MT copy number variation, and testing their association with AD risk using high coverage whole genome sequence data (i.e., > 30X) from multi‐ethnic cohorts.
In summary, we called mtDNA variants in a large WES dataset from the ADSP with a level of confidence comparable to that for variants called from WGS data or genotyped directly on SNP arrays. We identified significant association of AD risk with individual and aggregated rare mtDNA variants in MT‐ND4L and a nuclear‐encoded MT gene, TAMM41, suggesting variants in MT or nuclear genes leading to mitochondrial dysfunction may be related to AD risk. Findings from our work and other relevant studies 60 , 61 indicate that a better understanding of the molecular mechanisms underlying these associations will require functional experiments and in silico studies of the connections of MT genetic variants to gene expression, processing of AD‐related proteins, and mtDNA epigenetic modulation in human brain.
ALZHEIMER'S DISEASE SEQUENCING PROJECT MEMBERS
Baylor College of Medicine: Michelle Bellair, Huyen Dinh, Harsha Doddapeneni, Shannon Dugan‐Perez, Adam English, Richard A. Gibbs, Yi Han, Jianhong Hu, Joy Jayaseelan, Divya Kalra, Ziad Khan, Viktoriya Korchina, Sandra Lee, Yue Liu, Xiuping Liu, Donna Muzny, Waleed Nasser, William Salerno, Jireh Santibanez, Evette Skinner, Simon White, Kim Worley, Yiming Zhu
Boston University: Alexa Beiser, Yuning Chen, Jaeyoon Chung, L. Adrienne Cupples, Anita DeStefano, Josee Dupuis, John Farrell, Lindsay Farrer, Daniel Lancour, Honghuang Lin, Ching Ti Liu, Kathy Lunetta, Yiyi Ma, Devanshi Patel, Chloe Sarnowski, Claudia Satizabal, Sudha Seshadri, Fangui Jenny Sun, Tong Tong, Xiaoling Zhang
Broad Institute: Seung Hoan Choi, Eric Banks, Stacey Gabriel, Namrata Gupta
Case Western Reserve University: William Bush, Mariusz Butkiewicz, Jonathan Haines, Sandra Smieszek, Yeunjoo Song
Columbia University: Sandra Barral, Phillip L De Jager, Richard Mayeux, Christiane Reitz, Dolly Reyes, Giuseppe Tosto, Badri Vardarajan
Erasmus Medical University: Shahzad Amad, Najaf Amin, M Afran Ikram, Sven van der Lee, Cornelia van Duijn, Ashley Vanderspek
Medical University Graz: Helena Schmidt, Reinhold Schmidt
Mount Sinai School of Medicine: Alison Goate, Manav Kapoor, Edoardo Marcora, Alan Renton
Indiana University: Kelley Faber, Tatiana Foroud
National Center Biotechnology Information: Michael Feolo,Adam Stine
National Institute on Aging: Lenore J. Launer
Rush University: David A Bennett
Stanford University: Li Charlie Xia
University of Miami: Gary Beecham, Kara Hamilton‐Nelson, James Jaworski, Brian Kunkle, Eden Martin, Margaret Pericak‐Vance, Farid Rajabli, Michael Schmidt
University of Mississippi: Thomas H. Mosley
University of Pennsylvania: Laura Cantwell, Micah Childress, Yi‐Fan Chou, Rebecca Cweibel, Prabhakaran Gangadharan, Amanda Kuzma, Yuk Yee Leung, Han‐Jen Lin, John Malamon, Elisabeth Mlynarski, Adam Naj, Liming Qu, Gerard Schellenberg, Otto Valladares, Li‐San Wang, Weixin Wang, Nancy Zhang
University of Texas Houston: Jennifer E. Below, Eric Boerwinkle, Jan Bressler, Myriam Fornage, Xueqiu Jian, Xiaoming Liu
University of Washington: Joshua C. Bis, Elizabeth Blue, Lisa Brown, Tyler Day, Michael Dorschner, Andrea R Horimoto, Rafael Nafikov, Alejandro Q. Nato Jr., Pat Navas, Hiep Nguyen, Bruce Psaty, Kenneth Rice, Mohamad Saad, Harkirat Sohi, Timothy Thornton, Debby Tsuang, Bowen Wang, Ellen Wijsman, Daniela Witten
Washington University: Lucinda Antonacci‐Fulton, Elizabeth Appelbaum, Carlos Cruchaga, Robert S. Fulton, Daniel C. Koboldt, David E. Larson, Jason Waligorski, Richard K. Wilson
Supporting information
Supporting Information
ACKNOWLEDGMENTS
The Alzheimer's Disease Sequencing Project (ADSP) is comprised of two Alzheimer's Disease (AD) genetics consortia and three National Human Genome Research Institute (NHGRI) funded Large Scale Sequencing and Analysis Centers (LSAC). The two AD genetics consortia are the Alzheimer's Disease Genetics Consortium (ADGC) funded by NIA (U01 AG032984), and the Cohorts for Heart and Aging Research in Genomic Epidemiology (CHARGE) funded by NIA (R01 AG033193), the National Heart, Lung, and Blood Institute (NHLBI), other National Institute of Health (NIH) institutes and other foreign governmental and non‐governmental organizations. The Discovery Phase analysis of sequence data is supported through UF1AG047133 (to Drs. Schellenberg, Farrer, Pericak‐Vance, Mayeux, and Haines); U01AG049505 to Dr. Seshadri; U01AG049506 to Dr. Boerwinkle; U01AG049507 to Dr. Wijsman; and U01AG049508 to Dr. Goate and the Discovery Extension Phase analysis is supported through U01AG052411 to Dr. Goate, U01AG052410 to Dr. Pericak‐Vance and U01 AG052409 to Drs. Seshadri and Fornage. Data generation and harmonization in the Follow‐up Phases is supported by U54AG052427 (to Drs. Schellenberg and Wang). This work was also supported by NIA grants R01‐AG048927 (to Dr. Farrer), RF1‐AG057519 (to Drs. Farrer and Jun), U19‐AG068753 (to Drs. Farrer and Au), U54‐AG052427 (to Drs. Schellenberg and Wang), U01‐AG058654 (to Drs. Bush, Farrer, Haines, Martin and Pericak‐Vance), and U01‐AG062602 (to Dr. Farrer).
The ADGC cohorts include Adult Changes in Thought (ACT), the Alzheimer's Disease Centers (ADC), the Chicago Health and Aging Project (CHAP), the Memory and Aging Project (MAP), Mayo Clinic (MAYO), Mayo Parkinson's Disease controls, University of Miami, the Multi‐Institutional Research in Alzheimer's Genetic Epidemiology Study (MIRAGE), the National Cell Repository for Alzheimer's Disease (NCRAD), the National Institute on Aging Late Onset Alzheimer's Disease Family Study (NIA‐LOAD), the Religious Orders Study (ROS), the Texas Alzheimer's Research and Care Consortium (TARC), Vanderbilt University/Case Western Reserve University (VAN/CWRU), the Washington Heights‐Inwood Columbia Aging Project (WHICAP) and the Washington University Sequencing Project (WUSP), the Columbia University Hispanic‐Estudio Familiar de Influencia Genetica de Alzheimer (EFIGA), the University of Toronto (UT), and Genetic Differences (GD).
The CHARGE cohorts are supported in part by National Heart, Lung, and Blood Institute (NHLBI) infrastructure grant HL105756 (Psaty), RC2HL102419 (Boerwinkle), and the neurology working group is supported by the National Institute on Aging (NIA) R01 grant AG033193. The CHARGE cohorts participating in the ADSP include the following: Austrian Stroke Prevention Study (ASPS), ASPS‐Family study, and the Prospective Dementia Registry‐Austria (ASPS/PRODEM‐Aus), the Atherosclerosis Risk in Communities (ARIC) Study, the Cardiovascular Health Study (CHS), the Erasmus Rucphen Family Study (ERF), the Framingham Heart Study (FHS), and the Rotterdam Study (RS). ASPS is funded by the Austrian Science Fond (FWF) grant number P20545‐P05 and P13180 and the Medical University of Graz. The ASPS‐Fam is funded by the Austrian Science Fund (FWF) project I904), the EU Joint Programme‐Neurodegenerative Disease Research (JPND) in frame of the BRIDGET project (Austria, Ministry of Science) and the Medical University of Graz and the Steiermärkische Krankenanstalten Gesellschaft. PRODEM‐Austria is supported by the Austrian Research Promotion agency (FFG) (Project No. 827462) and by the Austrian National Bank (Anniversary Fund, project 15435. ARIC research is carried out as a collaborative study supported by NHLBI contracts (HHSN268201100005C, HHSN268201100006C, HHSN268201100007C, HHSN268201100008C, HHSN268201100009C, HHSN268201100010C, HHSN268201100011C, and HHSN268201100012C). Neurocognitive data in ARIC is collected by U01 2U01HL096812, 2U01HL096814, 2U01HL096899, 2U01HL096902, 2U01HL096917 from the NIH (NHLBI, NINDS, NIA, and NIDCD), and with previous brain MRI examinations funded by R01‐HL70825 from the NHLBI. CHS research was supported by contracts HHSN268201200036C, HHSN268200800007C, N01HC55222, N01HC85079, N01HC85080, N01HC85081, N01HC85082, N01HC85083, N01HC85086, and grants U01HL080295 and U01HL130114 from the NHLBI with additional contribution from the National Institute of Neurological Disorders and Stroke (NINDS). Additional support was provided by R01AG023629, R01AG15928, and R01AG20098 from the NIA. FHS research is supported by NHLBI contracts N01‐HC‐25195 and HHSN268201500001I. This study was also supported by additional grants from the NIA (R01s AG054076, AG049607 and AG033040 and NINDS (R01 NS017950). The ERF study as a part of EUROSPAN (European Special Populations Research Network) was supported by European Commission FP6 STRP grant number 018947 (LSHG‐CT‐2006‐01947) and also received funding from the European Community's Seventh Framework Programme (FP7/2007‐2013)/grant agreement HEALTH‐F4‐2007‐201413 by the European Commission under the programme “Quality of Life and Management of the Living Resources” of 5th Framework Programme (no. QLG2‐CT‐2002‐01254). High‐throughput analysis of the ERF data was supported by a joint grant from the Netherlands Organization for Scientific Research and the Russian Foundation for Basic Research (NWO‐RFBR 047.017.043). The Rotterdam Study is funded by Erasmus Medical Center and Erasmus University, Rotterdam, the Netherlands Organization for Health Research and Development (ZonMw), the Research Institute for Diseases in the Elderly (RIDE), the Ministry of Education, Culture and Science, the Ministry for Health, Welfare and Sports, the European Commission (DG XII), and the municipality of Rotterdam. Genetic data sets are also supported by the Netherlands Organization of Scientific Research NWO Investments (175.010.2005.011, 911‐03‐012), the Genetic Laboratory of the Department of Internal Medicine, Erasmus MC, the Research Institute for Diseases in the Elderly (014‐93‐015; RIDE2), and the Netherlands Genomics Initiative (NGI)/Netherlands Organization for Scientific Research (NWO) Netherlands Consortium for Healthy Aging (NCHA), project 050‐060‐810. All studies are grateful to their participants, faculty, and staff. The content of these manuscripts is solely the responsibility of the authors and does not necessarily represent the official views of the National Institutes of Health or the U.S. Department of Health and Human Services.
The four LSACs are the Human Genome Sequencing Center at the Baylor College of Medicine (U54 HG003273), the Broad Institute Genome Center (U54HG003067), The American Genome Center at the Uniformed Services University of the Health Sciences (U01AG057659), and the Washington University Genome Institute (U54HG003079).
Biological samples and associated phenotypic data used in primary data analyses were stored at Study Investigators institutions, and at the National Cell Repository for Alzheimer's Disease (NCRAD, U24AG021886) at Indiana University funded by NIA. Associated Phenotypic Data used in primary and secondary data analyses were provided by Study Investigators, the NIA funded Alzheimer's Disease Centers (ADCs), and the National Alzheimer's Coordinating Center (NACC, U01AG016976) and the National Institute on Aging Genetics of Alzheimer's Disease Data Storage Site (NIAGADS, U24AG041689) at the University of Pennsylvania, funded by NIA, and at the Database for Genotypes and Phenotypes (dbGaP) funded by NIH. This research was supported in part by the Intramural Research Program of the National Institutes of health, National Library of Medicine. Contributors to the Genetic Analysis Data included Study Investigators on projects that were individually funded by NIA, and other NIH institutes, and by private U.S. organizations, or foreign governmental or nongovernmental organizations.
We thank the investigators who assembled and characterized participants of cohorts included in this study:
Adult Changes in Thought: James D. Bowen, Paul K. Crane, Gail P. Jarvik, C. Dirk Keene, Eric B. Larson, W. William Lee, Wayne C. McCormick, Susan M. McCurry, Shubhabrata Mukherjee, Katie Rose Richmire
Atherosclerosis Risk in Communities Study: Rebecca Gottesman, David Knopman, Thomas H. Mosley, B. Gwen Windham
Austrian Stroke Prevention Study: Thomas Benke, Peter Dal‐Bianco, Edith Hofer, Gerhard Ransmayr, Yasaman Saba
Cardiovascular Health Study: James T. Becker, Joshua C. Bis, Annette L. Fitzpatrick, M. Ilyas Kamboh, Lewis H. Kuller, WT Longstreth, Jr, Oscar L. Lopez, Bruce M. Psaty, Jerome I. Rotter,
Chicago Health and Aging Project: Philip L. De Jager, Denis A. Evans
Erasmus Rucphen Family Study: Hieab H. Adams, Hata Comic, Albert Hofman, Peter J. Koudstaal, Fernando Rivadeneira, Andre G. Uitterlinden, Dina Voijnovic
Estudio Familiar de la Influencia Genetica en Alzheimer: Sandra Barral, Rafael Lantigua, Richard Mayeux, Martin Medrano, Dolly Reyes‐Dumeyer, Badri Vardarajan
Framingham Heart Study: Alexa S. Beiser, Vincent Chouraki, Jayanadra J. Himali, Charles C. White
Genetic Differences: Duane Beekly, James Bowen, Walter A. Kukull, Eric B. Larson, Wayne McCormick, Gerard D. Schellenberg, Linda Teri
Mayo Clinic: Minerva M. Carrasquillo, Dennis W. Dickson, Nilufer Ertekin‐Taner, Neill R. Graff‐Radford, Joseph E. Parisi, Ronald C. Petersen, Steven G. Younkin
Mayo PD: Gary W. Beecham, Dennis W. Dickson, Ranjan Duara, Nilufer Ertekin‐Taner, Tatiana M. Foroud, Neill R. Graff‐Radford, Richard B. Lipton, Joseph E. Parisi, Ronald C. Petersen, Bill Scott, Jeffery M. Vance
Memory and Aging Project: David A. Bennett, Philip L. De Jager
Multi‐Institutional Research in Alzheimer's Genetic Epidemiology Study: Sanford Auerbach, Helan Chui, Jaeyoon Chung, L. Adrienne Cupples, Charles DeCarli, Ranjan Duara, Martin Farlow, Lindsay A. Farrer, Robert Friedland, Rodney C.P. Go, Robert C. Green, Patrick Griffith, John Growdon, Gyungah R. Jun, Walter Kukull, Alexander Kurz, Mark Logue, Kathryn L. Lunetta, Thomas Obisesan, Helen Petrovitch, Marwan Sabbagh, A. Dessa Sadovnick, Magda Tsolaki
National Cell Repository for Alzheimer's Disease: Kelley M. Faber, Tatiana M. Foroud
National Institute on Aging (NIA) Late Onset Alzheimer's Disease Family Study: David A. Bennett, Sarah Bertelsen, Thomas D. Bird, Bradley F. Boeve, Carlos Cruchaga, Kelley Faber, Martin Farlow, Tatiana M Foroud, Alison M Goate, Neill R. Graff‐Radford, Richard Mayeux, Ruth Ottman, Dolly Reyes‐Dumeyer, Roger Rosenberg, Daniel Schaid, Robert A Sweet, Giuseppe Tosto, Debby Tsuang, Badri Vardarajan
NIA Alzheimer Disease Centers: Erin Abner, Marilyn S. Albert, Roger L. Albin, Liana G. Apostolova, Sanjay Asthana, Craig S. Atwood, Lisa L. Barnes, Thomas G. Beach, David A. Bennett, Eileen H. Bigio, Thomas D. Bird, Deborah Blacker, Adam Boxer, James B. Brewer, James R. Burke, Jeffrey M. Burns, Joseph D. Buxbaum, Nigel J. Cairns, Chuanhai Cao, Cynthia M. Carlsson, Richard J. Caselli, Helena C. Chui, Carlos Cruchaga, Mony de Leon, Charles DeCarli, Malcolm Dick, Dennis W. Dickson, Nilufer Ertekin‐Taner, David W. Fardo, Martin R. Farlow, Lindsay A. Farrer, Steven Ferris, Tatiana M. Foroud, Matthew P. Frosch, Douglas R. Galasko, Marla Gearing, David S. Geldmacher, Daniel H. Geschwind, Bernardino Ghetti, Carey Gleason, Alison M. Goate, Teresa Gomez‐Isla, Thomas Grabowski, Neill R. Graff‐Radford, John H. Growdon, Lawrence S. Honig, Ryan M. Huebinger, Matthew J. Huentelman, Christine M. Hulette, Bradley T. Hyman, Suman Jayadev, Lee‐Way Jin, Sterling Johnson, M. Ilyas Kamboh, Anna Karydas, Jeffrey A. Kaye, C. Dirk Keene, Ronald Kim, Neil W Kowall, Joel H. Kramer, Frank M. LaFerla, James J. Lah, Allan I. Levey, Ge Li, Andrew P. Lieberman, Oscar L. Lopez, Constantine G. Lyketsos, Daniel C. Marson, Ann C. McKee, Marsel Mesulam, Jesse Mez, Bruce L. Miller, Carol A. Miller, Abhay Moghekar, John C. Morris, John M. Olichney, Joseph E. Parisi, Henry L. Paulson, Elaine Peskind, Ronald C. Petersen, Aimee Pierce, Wayne W. Poon, Luigi Puglielli, Joseph F. Quinn, Ashok Raj, Murray Raskind, Eric M. Reiman, Barry Reisberg, Robert A. Rissman, Erik D. Roberson, Howard J. Rosen, Roger N. Rosenberg, Martin Sadowski, Mark A. Sager, David P. Salmon, Mary Sano, Andrew J. Saykin, Julie A. Schneider, Lon S. Schneider, William W. Seeley, Scott Small, Amanda G. Smith, Robert A. Stern, Russell H. Swerdlow, Rudolph E. Tanzi, Sarah E Tomaszewski Farias, John Q. Trojanowski, Juan C. Troncoso, Debby W. Tsuang, Vivianna M. Van Deerlin, Linda J. Van Eldik, Harry V. Vinters, Jean Paul Vonsattel, Jen Chyong Wang, Sandra Weintraub, Kathleen A. Welsh‐Bohmer, Shawn Westaway, Thomas S. Wingo, Thomas Wisniewski, David A. Wolk, Randall L. Woltjer, Steven G. Younkin, Lei Yu, Chang‐En Yu
Religious Orders Study: David A. Bennett, Philip L. De Jager
Rotterdam Study: Kamran Ikram, Frank J Wolters
Texas Alzheimer's Research and Care Consortium: Perrie Adams, Alyssa Aguirre, Lisa Alvarez, Gayle Ayres, Robert C. Barber, John Bertelson, Sarah Brisebois, Scott Chasse, Munro Culum, Eveleen Darby, John C. DeToledo, Thomas J. Fairchild, James R. Hall, John Hart, Michelle Hernandez, Ryan Huebinger, Leigh Johnson, Kim Johnson, Aisha Khaleeq, Janice Knebl, Laura J. Lacritz, Douglas Mains, Paul Massman, Trung Nguyen, Sid O'Bryant, Marcia Ory, Raymond Palmer, Valory Pavlik, David Paydarfar, Victoria Perez, Marsha Polk, Mary Quiceno, Joan S. Reisch, Monica Rodriguear, Roger Rosenberg, Donald R. Royall, Janet Smith, Alan Stevens, Jeffrey L. Tilson, April Wiechmann, Kirk C. Wilhelmsen, Benjamin Williams, Henrick Wilms, Martin Woon
University of Miami: Larry D Adams, Gary W. Beecham, Regina M Carney, Katrina Celis, Michael L Cuccaro, Kara L. Hamilton‐Nelson, James Jaworski, Brian W. Kunkle, Eden R. Martin, Margaret A. Pericak‐Vance, Farid Rajabli, Michael Schmidt, Jeffery M Vance
University of Toronto: Ekaterina Rogaeva, Peter St. George‐Hyslop
University of Washington Families: Thomas D. Bird, Olena Korvatska, Wendy Raskind, Chang‐En Yu
Vanderbilt University: John H. Dougherty, Harry E. Gwirtsman, Jonathan L. Haines
Washington Heights‐Inwood Columbia Aging Project: Adam Brickman, Rafael Lantigua, Jennifer Manly, Richard Mayeux, Christiane Reitz, Nicole Schupf, Yaakov Stern, Giuseppe Tosto, Badri Vardarajan
Zhang X , Farrell JJ , Tong T, et al. Association of mitochondrial variants and haplogroups identified by whole exome sequencing with Alzheimer's disease. Alzheimer's Dement. 2022;18:294–306. 10.1002/alz.12396
[Correction added on August 10, 2021 after first online publication: The Results section of the Abstract was revised.]
REFERENCES
- 1. Hebert LE, Weuve J, Scherr PA, Evans DA. Alzheimer disease in the United States (2010‐2050) estimated using the 2010 census. Neurology. 2013;80:1778‐1783. [DOI] [PMC free article] [PubMed] [Google Scholar]
- 2. Gatz M, Reynolds CA, Fratiglioni L, et al. Role of genes and environments for explaining Alzheimer disease. Arch Gen Psychiatry. 2006;63:168‐174. [DOI] [PubMed] [Google Scholar]
- 3. Lambert J‐C, Ibrahim‐Verbaas CA, Harold D, et al. Meta‐analysis of 74,046 individuals identifies 11 new susceptibility loci for Alzheimer's disease. Nat Genet. 2013;45:1452‐1458. [DOI] [PMC free article] [PubMed] [Google Scholar]
- 4. Jun G, Ibrahim‐Verbaas CA, Vronskaya M, et al. A novel Alzheimer disease locus located near the gene encoding tau protein. Mol Psychiatry. 2016;21:108‐117. [DOI] [PMC free article] [PubMed] [Google Scholar]
- 5. Jun G, Asai H, Zeldich E, et al. PLXNA4 is associated with Alzheimer disease and modulates tau phosphorylation. Ann Neurol. 2014;76:379‐392. [DOI] [PMC free article] [PubMed] [Google Scholar]
- 6. Kunkle BW, Grenier‐Boley B, Sims R, et al. Genetic meta‐analysis of diagnosed Alzheimer's disease identifies new risk loci and implicates Abeta, tau, immunity and lipid processing. Nat Genet. 2019;51:414‐430. [DOI] [PMC free article] [PubMed] [Google Scholar]
- 7. Zhang X, Zhu C, Beecham G, et al. A rare missense variant of CASP7 is associated with familial late‐onset Alzheimer's disease. Alzheimers Dement. 2019;15:441‐452. [DOI] [PMC free article] [PubMed] [Google Scholar]
- 8. Marioni RE, Harris SE, Zhang Q, et al. GWAS on family history of Alzheimer's disease. Transl Psychiatry. 2018;8:99. [DOI] [PMC free article] [PubMed] [Google Scholar]
- 9. Bis JC, Jian X, Kunkle BW, et al. Whole exome sequencing study identifies novel rare and common Alzheimer's‐associated variants involved in immune response and transcriptional regulation. Mol Psychiatry. 2018. [DOI] [PMC free article] [PubMed] [Google Scholar]
- 10. Ma Y, Jun GR, Zhang X, et al. Analysis of whole‐exome sequencing data for Alzheimer disease stratified by APOE genotype. JAMA Neurol. 2019:1099. [DOI] [PMC free article] [PubMed] [Google Scholar]
- 11. Swerdlow RH, Burns JM, Khan SM. The Alzheimer's disease mitochondrial cascade hypothesis: progress and perspectives. Biochim Biophys Acta. 2014;1842:1219‐1231. [DOI] [PMC free article] [PubMed] [Google Scholar]
- 12. Boada M, Antúnez C, Ramírez‐Lorca R, et al. ATP5H/KCTD2 locus is associated with Alzheimer's disease risk. Mol Psychiatry. 2014;19:682‐687. [DOI] [PMC free article] [PubMed] [Google Scholar]
- 13. Traylor M, Adib‐Samii P, Harold D, et al. Shared genetic contribution to ischaemic stroke and Alzheimer's disease. Ann Neurol. 2016;79:739‐747. [DOI] [PMC free article] [PubMed] [Google Scholar]
- 14. Hudson G, Sims R, Harold D, et al. No consistent evidence for association between mtDNA variants and Alzheimer disease. Neurology. 2012;78:1038‐1042. [DOI] [PMC free article] [PubMed] [Google Scholar]
- 15. Ridge PG, Wadsworth ME, Miller JB, Saykin AJ, Green RC, Kauwe JSK. Assembly of 809 whole mitochondrial genomes with clinical, imaging, and fluid biomarker phenotyping. Alzheimers Dement. 2018;14:514‐519. [DOI] [PMC free article] [PubMed] [Google Scholar]
- 16. Beecham GW, Bis JC, Martin ER, et al. The Alzheimer's Disease Sequencing Project: study design and sample selection. Neurol Genet. 2017;3:e194. [DOI] [PMC free article] [PubMed] [Google Scholar]
- 17. Andrews RM, Kubacka I, Chinnery PF, Lightowlers RN, Turnbull DM, Howell N. Reanalysis and revision of the Cambridge reference sequence for human mitochondrial DNA. Nat Genet. 1999;23:147. [DOI] [PubMed] [Google Scholar]
- 18. Li H, Durbin R. Fast and accurate short read alignment with burrows‐wheeler transform. Bioinformatics. 2009;25:1754‐1760. [DOI] [PMC free article] [PubMed] [Google Scholar]
- 19. Mckenna A, Hanna M, Banks E, et al. The Genome Analysis Toolkit: a MapReduce framework for analyzing next‐generation DNA sequencing data. Genome Res. 2010;20:1297‐1303. [DOI] [PMC free article] [PubMed] [Google Scholar]
- 20. Depristo MA, Banks E, Poplin R, et al. A framework for variation discovery and genotyping using next‐generation DNA sequencing data. Nat Genet. 2011;43:491‐498. [DOI] [PMC free article] [PubMed] [Google Scholar]
- 21. Van der Auwera GA, Carneiro MO, Hartl C, et al. From FastQ data to high confidence variant calls: the Genome Analysis Toolkit best practices pipeline. Curr Protoc Bioinformatics. 2013;43:11 10 1‐11 10 33. [DOI] [PMC free article] [PubMed] [Google Scholar]
- 22. Naj AC, Lin H, Vardarajan BN, et al. Quality control and integration of genotypes from two calling pipelines for whole genome sequence data in the Alzheimer's disease sequencing project. Genomics. 2019;111:808‐818. [DOI] [PMC free article] [PubMed] [Google Scholar]
- 23. Genomes Project C, Auton A, Brooks LD, Durbin RM, et al, Genomes Project C. A global reference for human genetic variation. Nature. 2015;526:68‐74. [DOI] [PMC free article] [PubMed] [Google Scholar]
- 24. Lott MT, Leipzig JN, Derbeneva O, et al. mtDNA variation and analysis using mitomap and mitomaster. Curr Protoc Bioinformatics. 2013;44:1 23‐21 26. [DOI] [PMC free article] [PubMed] [Google Scholar]
- 25. Sims R, Van Der Lee SJ, Naj AC, et al. Rare coding variants in PLCG2, ABI3, and TREM2 implicate microglial‐mediated innate immunity in Alzheimer's disease. Nat Genet. 2017;49:1373‐1384. [DOI] [PMC free article] [PubMed] [Google Scholar]
- 26. Weissensteiner H, Pacher D, Kloss‐Brandstätter A, et al. HaploGrep 2: mitochondrial haplogroup classification in the era of high‐throughput sequencing. Nucleic Acids Res. 2016;44:W58‐W63. [DOI] [PMC free article] [PubMed] [Google Scholar]
- 27. Van Oven M, Kayser M. Updated comprehensive phylogenetic tree of global human mitochondrial DNA variation. Hum Mutat. 2009;30:E386‐E394. [DOI] [PubMed] [Google Scholar]
- 28. Lee S, Teslovich TM, Boehnke M, Lin X. General framework for meta‐analysis of rare variants in sequencing association studies. Am J Hum Genet. 2013;93:42‐53. [DOI] [PMC free article] [PubMed] [Google Scholar]
- 29. Clima R, Preste R, Calabrese C, et al. HmtDB 2016: data update, a better performing query system and human mitochondrial DNA haplogroup predictor. Nucleic Acids Res. 2017;45:D698‐D706. [DOI] [PMC free article] [PubMed] [Google Scholar]
- 30. Mastroeni D, Khdour OM, Delvaux E, et al. Nuclear but not mitochondrial‐encoded oxidative phosphorylation genes are altered in aging, mild cognitive impairment, and Alzheimer's disease. Alzheimers Dement. 2017;13:510‐519. [DOI] [PMC free article] [PubMed] [Google Scholar]
- 31. Calvo SE, Clauser KR, Mootha VK. MitoCarta2.0: an updated inventory of mammalian mitochondrial proteins. Nucleic Acids Res. 2016;44:D1251‐D1257. [DOI] [PMC free article] [PubMed] [Google Scholar]
- 32. Mclaren W, Gil L, Hunt SE, et al. The ensembl variant effect predictor. Genome Biol. 2016;17:122. [DOI] [PMC free article] [PubMed] [Google Scholar]
- 33. Cingolani P, Platts A, Wang LL, et al. A program for annotating and predicting the effects of single nucleotide polymorphisms, SnpEff: sNPs in the genome of Drosophila melanogaster strain w1118; iso‐2; iso‐3. Fly (Austin). 2012;6:80‐92. [DOI] [PMC free article] [PubMed] [Google Scholar]
- 34. Dobin A, Davis CA, Schlesinger F, et al. STAR: ultrafast universal RNA‐seq aligner. Bioinformatics. 2013;29:15‐21. [DOI] [PMC free article] [PubMed] [Google Scholar]
- 35. Li Bo, Dewey CN. RSEM: accurate transcript quantification from RNA‐Seq data with or without a reference genome. BMC Bioinformatics. 2011;12:323. [DOI] [PMC free article] [PubMed] [Google Scholar]
- 36. Love MI, Huber W, Anders S. Moderated estimation of fold change and dispersion for RNA‐seq data with DESeq2. Genome Biol. 2014;15:550. [DOI] [PMC free article] [PubMed] [Google Scholar]
- 37. Zhang B, Horvath S. A general framework for weighted gene co‐expression network analysis. Stat Appl Genet Mol Biol. 2005;4:Article17. [DOI] [PubMed] [Google Scholar]
- 38. Moreira PI, Carvalho C, Zhu X, Smith MA, Perry G. Mitochondrial dysfunction is a trigger of Alzheimer's disease pathophysiology. Biochim Biophys Acta. 2010;1802:2‐10. [DOI] [PubMed] [Google Scholar]
- 39. Lunnon K, Keohane A, Pidsley R, et al. Mitochondrial genes are altered in blood early in Alzheimer's disease. Neurobiol Aging. 2017;53:36‐47. [DOI] [PubMed] [Google Scholar]
- 40. Lee A, Hirabayashi Y, Kwon S‐K, Lewis TL, Polleux F. Emerging roles of mitochondria in synaptic transmission and neurodegeneration. Curr Opin Physiol. 2018;3:82‐93. [DOI] [PMC free article] [PubMed] [Google Scholar]
- 41. Sorrentino V, Romani M, Mouchiroud L, et al. Enhancing mitochondrial proteostasis reduces amyloid‐beta proteotoxicity. Nature. 2017;552:187‐193. [DOI] [PMC free article] [PubMed] [Google Scholar]
- 42. Ridge PG, Kauwe JSK. Mitochondria and Alzheimer's disease: the role of mitochondrial genetic variation. Curr Genet Med Rep. 2018;6:1‐10. [DOI] [PMC free article] [PubMed] [Google Scholar]
- 43. Tranah GJ, Nalls MA, Katzman SM, et al. Mitochondrial DNA sequence variation associated with dementia and cognitive function in the elderly. J Alzheimers Dis. 2012;32:357‐372. [DOI] [PMC free article] [PubMed] [Google Scholar]
- 44. Swerdlow RH, Hui D, Chalise P, et al. Exploratory analysis of mtDNA haplogroups in two Alzheimer's longitudinal cohorts. Alzheimers Dement. 2020;16:1164‐1172. [DOI] [PMC free article] [PubMed] [Google Scholar]
- 45. Coto E, Gómez J, Alonso B, et al. Late‐onset Alzheimer's disease is associated with mitochondrial DNA 7028C/haplogroup H and D310 poly‐C tract heteroplasmy. Neurogenetics. 2011;12:345‐346. [DOI] [PubMed] [Google Scholar]
- 46. Maruszak A, Safranow K, Branicki W, et al. The impact of mitochondrial and nuclear DNA variants on late‐onset Alzheimer's disease risk. J Alzheimers Dis. 2011;27:197‐210. [DOI] [PubMed] [Google Scholar]
- 47. Andrews SJ, Fulton‐Howard B, Patterson C, et al. Mitonuclear interactions influence Alzheimer's disease risk. Neurobiol Aging. 2020;87:138.e7‐138.e14. [DOI] [PMC free article] [PubMed] [Google Scholar]
- 48. Onyango IG Jr. Mitochondria in the pathophysiology of Alzheimer's and Parkinson's diseases. Front Biosci (Landmark Ed). 2017;22:854‐872. [DOI] [PubMed] [Google Scholar]
- 49. Giachin G, Bouverot R, Acajjaoui S, Pantalone S, Soler‐López M. Dynamics of human mitochondrial complex I assembly: implications for neurodegenerative diseases. Front Mol Biosci. 2016;3:43. [DOI] [PMC free article] [PubMed] [Google Scholar]
- 50. Picone P, Nuzzo D, Caruana L, Scafidi V, Di Carlo M. Mitochondrial dysfunction: different routes to Alzheimer's disease therapy. Oxid Med Cell Longev. 2014;2014:1. [DOI] [PMC free article] [PubMed] [Google Scholar]
- 51. Holper L, Ben‐Shachar D, Mann J. Multivariate meta‐analyses of mitochondrial complex I and IV in major depressive disorder, bipolar disorder, schizophrenia, Alzheimer disease, and Parkinson disease. Neuropsychopharmacology. 2019;44:837‐849. [DOI] [PMC free article] [PubMed] [Google Scholar]
- 52. Rollins B, Martin MV, Sequeira PA, et al. Mitochondrial variants in schizophrenia, bipolar disorder, and major depressive disorder. PLoS One. 2009;4:e4913. [DOI] [PMC free article] [PubMed] [Google Scholar]
- 53. Behbehani R, Melhem M, Alghanim G, Behbehani K, Alsmadi O. ND4L gene concurrent 10609T>C and 10663T>C mutations are associated with Leber's hereditary optic neuropathy in a large pedigree from Kuwait. Br J Ophthalmol. 2014;98:826‐831. [DOI] [PMC free article] [PubMed] [Google Scholar]
- 54. Ng YS, Lax NZ, Maddison P, et al. MT‐ND5 mutation exhibits highly variable neurological manifestations at low mutant load. EBioMedicine. 2018;30:86‐93. [DOI] [PMC free article] [PubMed] [Google Scholar]
- 55. Lin F‐H, Lin R, Wisniewski HM, et al. Detection of point mutations in codon 331 of mitochondrial NADH dehydrogenase subunit 2 in Alzheimer's brains. Biochem Biophys Res Commun. 1992;182:238‐246. [DOI] [PubMed] [Google Scholar]
- 56. Blunsom NJ, Gomez‐Espinosa E, Ashlin TG, Cockcroft S. Mitochondrial CDP‐diacylglycerol synthase activity is due to the peripheral protein, TAMM41 and not due to the integral membrane protein, CDP‐diacylglycerol synthase 1. Biochim Biophys Acta Mol Cell Biol Lipids. 2018;1863:284‐298. [DOI] [PMC free article] [PubMed] [Google Scholar]
- 57. He Y, Wei M, Wu Y, et al. Amyloid beta oligomers suppress excitatory transmitter release via presynaptic depletion of phosphatidylinositol‐4,5‐bisphosphate. Nat Commun. 2019;10:1193. [DOI] [PMC free article] [PubMed] [Google Scholar]
- 58. Pinto M, Moraes CT. Mitochondrial genome changes and neurodegenerative diseases. Biochim Biophys Acta. 2014;1842:1198‐1207. [DOI] [PMC free article] [PubMed] [Google Scholar]
- 59. Pinto M, Moraes CT. Mechanisms linking mtDNA damage and aging. Free Radic Biol Med. 2015;85:250‐258. [DOI] [PMC free article] [PubMed] [Google Scholar]
- 60. Delgado‐Morales R, Esteller M. Opening up the DNA methylome of dementia. Mol Psychiatry. 2017;22:485‐496. [DOI] [PMC free article] [PubMed] [Google Scholar]
- 61. Blanch M, Mosquera JL, Ansoleaga B, Ferrer I, Barrachina M. Altered mitochondrial DNA methylation pattern in Alzheimer disease‐related pathology and in Parkinson disease. Am J Pathol. 2016;186:385‐397. [DOI] [PubMed] [Google Scholar]
Associated Data
This section collects any data citations, data availability statements, or supplementary materials included in this article.
Supplementary Materials
Supporting Information