

Abstract
Background and Objectives:
Post-discharge oncologic surgical complications are costly for patients, families and healthcare systems. The capacity to predict complications and early intervention can improve postoperative outcomes. In this proof-of-concept study, we used a machine learning approach to explore the potential added value of patient reported outcomes (PROs) and patient generated health data (PGHD) in predicting post-discharge complications for gastrointestinal (GI) and lung cancer surgery patients.
Methods:
We formulated post-discharge complication prediction as a binary classification task. Features were extracted from clinical variables, PROs (MDASI) and PGHD (VivoFit) from a cohort of 52 patients with 134 temporal observation points pre- and post-discharge that were extracted from two pilot studies. We trained and evaluated supervised learning classifiers via nested cross-validation.
Results:
An area under the receiver operating characteristic (AUROC) of 0.74 was achieved with a model using clinical data, PROs and PGHD from wearable pedometers with a logistic regression classifier with L2 regularization.
Conclusions:
PROs and PGHDs captured through remote patient telemonitoring approaches have the potential to improve prediction performance for postoperative complications.
Keywords: machine learning, supervised learning, wearable computing, patient reported outcomes (PROs), patient generated health data (PGHD)
INTRODUCTION
Many cancer surgeries have high risk of post-discharge complications that may result in undesirable healthcare resource use such as hospital readmissions. Postoperative complications and readmissions are costly and burdensome for the patients, their families, and the healthcare system. Postoperative complications and readmissions are important surgical outcomes that are often used as quality metrics in surgical oncology.
The ability to predict postoperative complications is critical to improving the quality and value of surgical care. The predictive ability can assist with identifying patients that are at higher risk for postoperative morbidities early and allocate healthcare resources appropriately to improve postoperative recovery. Complications may also be caused by events occurring after discharge and therefore not observable by such prediction approaches. Patient-generated health data (PGHD), including wearable activity trackers and electronic patient-reported outcomes (ePROs) can be feasibly obtained while patients are at home and in their communities. These data, particularly ePROs (symptoms, quality of life), provide the patient’s lived experience away from the hospital, and have been shown to improve survival in patients with advanced cancer.1 Perioperative telemonitoring technologies through wearable and web-based applications may enable real-time remote patient observations and complement traditional clinical, surgical, and disease specific data to improve the prediction of negative outcomes and prevent undesirable healthcare resource use. In addition, policy and reimbursement barriers related to telehealth and telemonitoring have been temporarily removed to enable their rapid uptake and use during the COVID-19 pandemic. However, PGHDs and ePROs are not routinely captured in surgical oncology. Furthermore, there is a dearth in the current literature on understanding the meaning and potential clinical benefits of PGHD and ePROs in surgical oncology. As for PGHDs, Bae et al. used features from step counts to predict 30-day unplanned readmission for a cohort of 25 post-surgical cancer inpatients.2 Doryab et al. used step and heart rate data collected from smart watches to extract bio-behavioral rhythm figures to predict complication risk for a cohort of 52 pancreatic surgery patients (82% cancer).3 To the best of our knowledge, there is no work using ePROs to predict post-surgical outcomes for oncology patients. In this proof-of-concept study, we used a machine learning approach to explore the potential added value of functional recovery PGHD (as daily steps measured by wristband pedometers) and ePROs (symptoms) for predicting postoperative complications. Specifically, we were interested in the following research questions. First, does functional recovery PGHD (as measured by daily steps) bring added value to postoperative complications predictive models that also include traditional clinical/surgical/disease related variables? The second question we aimed to address was do ePROs (symptoms) bring added value to postoperative complications predictive models that also include traditional clinical/surgical/disease related variables?
MATERIALS AND METHODS
Data Source
PGHD and ePRO data from two telehealth/telemonitoring pilot studies were accessed for this analysis (n=52). The first study was a proof-of-concept pilot to explore the feasibility and acceptability of remote wireless perioperative telemonitoring in patients undergoing surgery for the treatment of gastrointestinal (GI) cancers (n=20).4 The second study was a feasibility trial of a telehealth perioperative physical activity intervention in older adults with lung and GI cancer (n=32).5 In both studies, patients wore wristband pedometers (VivoFit™) to assess functional recovery (as measured by daily steps) and completed ePROs (MD Anderson Symptom Inventory - MDASI) to assess symptoms. Telemonitoring for both studies began before surgery and continued up to four weeks post-discharge. Daily steps data were captured continuously, while ePROs were collected intermittently (before surgery, at discharge, and at 1, 2 and 4 weeks post-discharge. Surgical outcomes (postoperative complications, hospital readmissions) were captured via electronic health records (EHRs).
Functional recovery PGHD was captured using the VivoFit (Garmin Company). This device is a commercially available tracking wristband pedometer. It continuously monitors daily step progress 24/7 without battery change for one year. It is also waterproof and can be worn in the shower. VivoFit stores daily steps counts right on the device and can be wirelessly synced for free to supported smartphones and computers. A systematic review of 22 studies concluded that the validity and reliability of wearable pedometers were generally high for measuring daily steps.6
Symptoms were assessed using the MD Anderson Symptom Inventory (MDASI). This is a brief, well-validated measure of 13 common cancer-related symptoms: pain, fatigue, nausea, sleep, distress/anxiety, shortness of breath, memory, appetite, dry mouth, drowsiness, sadness, vomiting, and numbness/tingling. Each symptom’s severity is rated on a 10-point scale. A score of 1–3 indicates mild intensity, and 4-10 moderate to severe intensity. Patients also rate how much their symptoms interfered with 6 common functional domains: walking, activity, working/housework, social relationships, enjoyment of life, and mood. The MDASI applies broadly across cancer types and treatments and is easy for patients to complete. A movement of 1.2 points is clinically meaningful and cutoff scores for indication of clinical deficits have been defined by the tool authors. The MDASI has been validated in surgical populations; Cronbach Alpha reliability ranges from 0.82 to 0.94.7, 8
Out of the 52 patients enrolled, 47 participants submitted answers MDASI (ePROs) at least once. 40 of the 47 patients wore the VivoFit pedometer at least once. The numbers of male and female patients were 25 and 27 respectively. Age ranged between 22 and 84 years, with a median of 68 years. Complications were recorded for up to 30 days after discharge. The overall post-discharge complication rate for the 52 patients was 21.1%. The length of stay (LOS) ranged between 1 and 13 days with a median of 6 days. 36 and 16 patients underwent surgeries for treatment of GI and lung cancers, respectively.
Temporal segmentation of the data
From the standpoint of data collection, there are 3 distinct types of temporal segments for each patient: T1. period of 3 to 14 days preceding admission, days, used to collect baseline PRO and step data; T2. hospital visit for the surgery (median LOS=6 days) and T3. 2 -4 weeks following hospital discharge.
Patients were asked to submit ePROs at the end of periods T1 and T2 and the end of each week after discharge (T3). Similarly, patients were asked to wear the VivoFit pedometers throughout the above periods. For consistency across the pilots, we considered observations up to the second week after discharge, treating each week as a distinct observation. Hence, after the exclusion of the periods before admission, there were up to three temporal observations for each patient: hospital visit, first and second week after discharge. We pointed out the partial compliance of patients with ePROs and pedometers. We obtained 99 observations with at least partial compliance to VivoFit pedometers (63 post-discharge weeks) and 129 observations with compliance to MDASI questionnaires (85 post-discharge weeks). We included observations associated to hospital visits of patients non-compliant to MDASI questionnaires or VivoFit pedometers. We removed post-discharge observations encompassing or following readmission or complication events to avoid leakage.
Problem Formulation
We considered the periods up to admission only to extract baselines about the patients (e.g. median daily steps before surgery). In this case, we have between 1 and 3 temporal segments marked by discharge and/or the completion of MDASI ePRO questionnaire. Our goal was to predict unplanned readmission and serious complications within 30 days from discharge at discharge and/or at each time of PRO the data available for associated segment. Therefore, for each patient with at least partially compliant PROs submissions, we performed predictions at up to 3 distinct times. We framed the complication prediction task as a binary classification problem (complication yes or no), where a score between 0 and 1 is produced. A score close to 1 means high risk of complication/unplanned readmission.
Features
We selected sets of variables shared by both pilots based on clinical domain knowledge and with the goal to evaluate the predictive potential for ePRO and PGHD in the form of steps collected via wearable devices. From the variables we extracted features to train machine learning models. The small sample size limits the number of variables that can be considered. For this reason, we did not include immediate discharge labs, although potentially predictive of risk of readmission in larger cohorts. The features used are listed in Table 1. They were computed for the temporal period of the hospital visit and for week 1 and 2 after discharge (dsc): e.g. min (daily steps) = the minimum number of daily steps for week 1 after discharge. The nonlinear transformation of the BMI is motivated by the use of a linear model. The MDASI features range from 0 to 10, according to the level of self-assessed discomfort. “pain vs. baseline” is the difference between the pain levels reported at e.g. discharge and before admission.
Table 1.
Model features grouped by category. The MDASI features range from 0 to 10, according to the level of self-assessed discomfort.
| Clinical Charts | MDASI ePROs | Pedometer PGHD |
|---|---|---|
| ASA score | pain vs. baseline | total steps |
| N. complications before dsc. | pain | min(daily steps) |
| length of stay (LOS) | fatigue | max(daily steps) |
| Zubrod score | nausea | median(daily steps) |
| (BMI-21.7) 2 | sleep | total steps vs. baseline |
| weeks since dsc. | distress | linear trend(daily steps) |
| Breath memory | fraction of days w/ pedmtr. | |
| Appetite | ||
| dry mouth | ||
| Sadness | ||
| MDASI compliance |
For the purpose of feature extraction, most of the variables did not need processing (e.g. the answers to the MDASI questionnaires consists in scores between 0 and 10). MDASI PRO variables for drowsiness, numbness and vomiting were excluded based on domain expert assessments. We defined the feature pain with respect to the baseline as: pain(T1) – pain(Tk), where T1 is the observation period before admission (to collect patient’s baseline data) and Tk is either the hospital visit or one of the post-discharge weeks. We introduced an indicator feature to express compliance for MDASI questionnaires: MDASI compliance.
We performed a quadratic transformation on the Body Mass Index (BMI) and extracted its square root to express it as distance from a normal range. We imputed missing values only for the American Society of Anesthesiologists (ASA) physical status score with 3, the value the majority class. When considering observation periods, after discharge, we used the ASA score assessed during the hospital visit. We excluded age, because the largest of the pilots (n=32) focused exclusively on elderly patients.
The VivoFit devices recorded the daily steps. From the daily steps over an observation period, we extracted minimum, maximum, median counts of steps, standard deviation of steps, slope and intercept of the linear interpolation, differences with respect to baseline and the fraction of days the patients wore pedometer during an observation period. The latter also played as an indicator feature for observation periods without pedometers.
Training and Evaluation
As mentioned, for each patient we considered hospital visit, week 1 and 2 post-discharge as separate observations (n=134), to predict complications within 30 days from discharge. Temporal segments encompassing or following complications were removed to avoid leakage. We trained logistic regression classifiers via nested cross-validation with L1 or L2 regularization, using the scikit-learn Python library.9 Regularization is used to reduce the sensitivity of the coefficients of the model and therefore to prevent learning from noise in the data. The features values were standardized to zero mean and unit variance to facilitate convergence during training. We tuned the model with randomized hyperparameter search via 4-fold patient-cross-validation (inner loop). With this kind of group cross-validation, the observations from a patient are always within the same fold. The tuning parameters were the regularization coefficient and the type of regularization (L1 or L2). We evaluated the model via leave-one-patient-out cross-validation (outer loop). In both cross-validation loops all the feature vectors associated to the same patient were either in the same fold, to avoid having segments of the same patient split between training and testing. Cross-validation is a procedure to train and test machine learning models when the number of observations is limited: every observation is in turn used for both training and testing. The number of folds, K, is the number of groups the observations are split into. We considered the following subsets of data: Clinical data (n=52), Clinical + MDASI data (n=134), Clinical + steps data (n=111) and Clinical + steps + MDASI data (n=134).
We analyzed the contributions of the features towards the prediction score via the Python shap package.10 The SHapley Additive exPlanations (SHAP) are a measure of the contribution of each feature towards a prediction and are obtained via a game theory approach.
RESULTS
We evaluated the performance of the models with the receiver operating characteristic (ROC) and its underlying area (AUROC). The ROC shows the true positive rate (TPR) of the model as a function of the false positive rate (FPR) for the possible decision thresholds. The AUROC can be interpreted as the probability that an observation in the positive class (i.e. readmission/complication) has a risk score higher than an observation in the negative class. An AUROC equal to 0.5 means random guessing, while AUROC=1 means 100% correct predictions. We also computed the area and under the precision-recall curve (AUPRC). The PR-curve shows the precision-recall tradeoffs. Precision and recall are also indicated as positive predictive value (PPV) and sensitivity, respectively. The AUPRC depends on the quality of the model and the prevalence.
The model combining clinical, MDASI PROs and step features (n=134) yielded a 0.74 AUROC. When daily step data were removed, the AUROC was 0.70 (n=134). The AUROC was 0.72 for the model with daily step data, but without ePRO symptoms (n=111). For the baseline model, solely based on clinical features and observation until discharge, the AUROC was 0.62 (n=52). The performances are summarized in Table 2. The Receiver Operating Characteristics of each model are plotted in Figure 1. Table 3 shows the stratified performance of the model for different prediction times: at discharge, one and two weeks after discharge.
Table 2.
Counts of observation and features, complication rates and performance metrics for the models.
| N | N FEATURES | COMPLICATION RATE | AUROC | AUPRC | |
|---|---|---|---|---|---|
| BASELINE | 52 | 5 | 21.1% | 0.62 | 0.43 |
|
| |||||
| MDASI | 134 | 18 | 14.2% | 0.70 | 0.27 |
|
| |||||
| STEPS | 111 | 13 | 14.4% | 0.72 | 0.28 |
|
| |||||
| MDASI+STEPS | 134 | 25 | 14.2% | 0.74 | 0.28 |
Figure 1.

Receiver Operating Characteristic (ROC) curves for the evaluated models. The one trained with clinical, MDASI ePRO and step PGHD performs best (AUROC = 0.74).
Table 3.
The Area under the Received Operating Characteristic at different observation points for the model based on clinical, MDASI and step data.
| WEEK SINCE DSC | N | AUROC |
|---|---|---|
| 0 | 49 | 0.72 |
| 1 | 44 | 0.70 |
| 2 | 41 | 0.69 |
The performances for the models using ePROs and/or PGHDSs are close (0.70 - 0.74 AUROC), while the AUROC of the model based only on clinical factors collected before discharge is 0.62. The former models benefit from a larger number of training samples, because they include observations from data collected in the first two weeks after discharge from telemonitoring via MDASI ePROs and VivoFit pedometers. The relatively high value of the area under the precision-recall curve (AUPRC) for the baseline model depends on the higher prevalence. Due to the different values of prevalence for the above models, we chose AUROC for performance comparisons.
Figure 2 shows the global feature importance for the model using clinical, MDASI and step data. Figure 3 displays the impact on the prediction score based on the values of the features and it is obtained from the SHAP explanations associated to the prediction of the trained model. The blue and red colors are associated respectively with low and high values of a feature. Dots to the left and right of the vertical axis indicate low and high risk scores, respectively. The figure confirms several clinical intuitions. The two most predictive features are number of complications before discharge and LOS, with high values associated with a high risk of readmission/complication. Moreover, a low (i.e. 0) functional (Zubrod) score is associated with low risk of readmission/complications. We also observed that the risk of complication decreases as time progresses (measured via weeks since discharge).
Figure 2.

The global feature importance for the logistic regression model using clinical, MDASI ePRO and step PGHD.
Figure 3.

The contributions of the features based on their values for the model using clinical, MDASI ePRO and step PGHD.
The most predictive among PGHDs related features were the total steps vs. the baseline and the linear trend of the daily steps (i.e. the slope of the linear interpolation). The plot suggests that a large decrement of physical activity with respect to the baseline period and/or a sharp increase in the physical activity levels (measured via the slope of the linear interpolation of the daily step counts) are associated with higher risk of complications. Similarly Bae et al., who used Fitbit data to predict readmission for 25 postsurgical cancer patients, observed that more intense activity by the readmitted group could be a risky behavior and deserves more exploration.2
In regard to the MDASI ePROs, high levels of reported discomfort for pain (with respect the baseline as well as absolute values) sleep and appetite imply a higher risk of post-discharge complications. Overall, MDASI ePROs seems less predictive than wearable pedometer PGHD. As a matter of fact the model based on PGHD features outperformed slightly the one based on ePRO features (0.72 vs. 0.70 AUROC). Both shared highly predictive clinical features.
Figure 4 shows the top features for an observation of a readmitted patient: 897 step/day slope, 13 day LOS and 2 complications before discharge increased the predicted risk score, while a 0 Zubrod score was the major factor decreasing the risk score.
Figure 4.
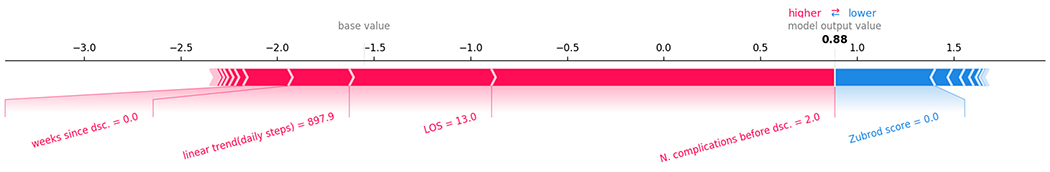
Top contributing features to the predicted risk for an observation associated with readmission.
Post-hoc t-tests showed significant differences over the observations for N of complications before discharge: no complications (μ=0.16, σ=0.36), complications (μ=0.6, σ=0.8) with t(134)=2.7, p=0.015; LOS: no complications (μ=5.6, σ=3.0), complications (μ=8.1, σ=3.3) with t(134)=3.1, p=0.005; Zubrod score: no complications (μ=0.79, σ=0.41), complications (μ=0.95, σ=0.23) with t(134)=2.4, p=0.021.
DISCUSSION
We proposed and evaluated an approach that uses clinical, ePROs and wearable PGHDs to predict 30-day post discharge complications and unplanned readmission for a cohort of 52 GI and lung surgical oncology patients. Since ePROs and PGHDs were monitored also after discharge to the best of the patients’ compliance, our approach updated predictions outside hospital settings, increasing the ability to predict complications. To date, there are limited work on perioperative complication prediction models based on the aforementioned types of data.
The prediction of unplanned hospital readmission is a classic task in machine learning for healthcare. With this goal, Rajikomar et al. proposed a deep learning approach for tasks such a readmission prediction, outperforming a logistic regression baseline by about 1%.11 Liu et al. applied an artificial neural network to features from embeddings of diagnosis codes and the EHR.12 There are few works focused on the prediction of post-discharge complications and unplanned readmissions for surgical patients. For instance, Kalgara et al. proposed a gradient boosting approach to predict readmission for patients subject to lumbar laminectomy.13 Bolourani et al. focused on predicting readmission for patients who underwent esophagectomy.14 Corey et al. evaluated different classifiers in predicting patients at risks of complications prior to the time of surgery.15
Patient generated health data (PGHD) are typically obtained via wearable devices. A limitation of prior studies on prediction of post-surgical complications is that the in-hospital clinical data used to make predictions are only available until the time of discharge. Critical changes in the patient’s condition were not detectable if occurred after discharge. The main advantage to monitor patients remotely via wearables is the capacity to unobtrusively observe proxies of their condition after discharge. There are studies on the application of wearable accelerometers to monitor the recovery of stroke patients.16 The number of studies using PGHD for predicting outcomes for surgical oncology patients are even more limited.2, 3 Additionally, we could not find any studies using ePROs to predict post-discharge outcomes for surgical patients. To the best of our knowledge, ours is the first work to combine clinical data with both PROs and PGHD to predict post-discharge surgical complications for cancer patients.
In general, it may be challenging to recruit large numbers of patients in studies involving wearable devices. For instance, the number of participants in the aforementioned works using PGHD varied from 24 to 52. Similarly, our study relied on data from 52 patients (for which we considered up to 134 temporal observations). Under these constraints, there weren’t enough observations for a testing set separated from the training, and we trained/evaluated our models via nested group (patient) cross-validation. Nested cross-validation is a recommended approach to train and evaluate models when the sample size is small.17
There was an inherent risk of overfitting due to limited sample size, hence overestimating the predictive power of some features. Consequently, the small number of observations also limited the number of features that model could have. For this reason, we chose to use a linear classifier (logistic regression), since nonlinear classification methods generally don’t perform as well for low numbers of observations relatively to the dimensionality of the problem. A larger cohort prospective study should include features from immediate discharge labs (e.g., markers of inflammation such as white blood cell count and C-reactive protein, markers of metabolic in-equilibrium, morning glucose and creatinine).
Other limitations of our study include the fact that our dataset originated from two pilots not designed for machine learning applications and designed with different inclusion criteria. The first pilot enrolled adults (median age = 55), while the second pilot targeted only elderly patients (age > 65) with a median of 75 years. The first pilot enrolled only GI cancer patients, while the second pilot also included lung cancer patients. Finally, steps data in the first pilot were entered manually with potential risk of errors. Despite these limitations, we believe the data and approach presented here to be novel and have added value to the available literature.
CONCLUSIONS
We trained supervised learning models based only on clinical data collected up to discharge, with ePROs and wearable PGHDs collected during and after visits. Our results suggest that both PGHD and ePROs from patient telemonitoring have the potential to enable predictions to be performed after discharge and to improve overall prediction accuracy. Patient-centered outcomes obtained via wearable and web-based technologies may complement clinical data to predict postoperative complications. From our analysis on the impact of each feature, the findings suggest that a high risk of complications was associated with long length of stay, a precipitous increase of physical activity, as measured via linear trend in daily steps, and also high levels of symptom discomfort (i.e., pain, sleep, appetite). Future large-scale studies are needed to definitively establish the added predictive value of patient-centered outcomes in surgical oncology to inform treatment decision-making, postoperative care, and postoperative recovery trajectories.
Synopsis:
We explored the potential added value of patient reported outcomes (PROs) and patient generated health data (PGHD) for the task of predicting post-discharge complications for a cohort of 52 gastro-intestinal and lung cancer surgical patients. Our machine learning approach used a combination of clinical, PRO and PGHD features with a linear classifier and achieved an area under the receiver operating characteristic (AUROC) of 0.74.
Acknowledgments
We would like to thank Dr. Chi Wah (Alec) Wong for his valuable suggestions on the methods. The research reported in this paper was supported by the National Cancer Institute of the National Institutes of Health under award number P30CA33572. It also included research that was supported by the City of Hope Center for Cancer and Aging. The content is solely the responsibility of the authors and does not necessarily represent the official view of the Center for Cancer and Aging, the National Cancer Institute, or the National Institutes of Health.
Footnotes
Disclosures: The authors have none to declare.
DATA AVAILABILITY: The data associated with the current study is not publicly available as the data are not legally certified as being de-identified. Summary data may be available by contacting corresponding author.
REFERENCES
- 1.Basch E, Deal AM, Kris MG, Scher HI, Hudis CA, Sabbatini P, Rogak L, Bennett AV, Dueck AC, Atkinson TM, Chou JF, Dulko D, Sit L, Barz A, Novotny P, Fruscione M, Sloan JA and Schrag D. Symptom Monitoring With Patient-Reported Outcomes During Routine Cancer Treatment: A Randomized Controlled Trial. J Clin Oncol. 2016;34:557–65. [DOI] [PMC free article] [PubMed] [Google Scholar]
- 2.Bae S, Dey A and Low C. Using passively collected sedentary behavior to predict hospital readmission. Proceedings of the 2016 ACM International Joint Conference on Pervasive and Ubiquitous Computing. 2016:616–621. [Google Scholar]
- 3.Doryab A, Dey A, Kao G and Low C. Modeling Biobehavioral Rhythms with Passive Sensing in the Wild: A Case Study to Predict Readmission Risk after Pancreatic Surgery. Proceedings of the ACM on Interactive, Mobile, Wearable and Ubiquitous Technologies. 2019;3:1–21.34164595 [Google Scholar]
- 4.Sun V, Dumitra S, Ruel N, Lee B, Melstrom L, Melstrom K, Woo Y, Sentovich S, Singh G and Fong Y. Wireless Monitoring Program of Patient-Centered Outcomes and Recovery Before and After Major Abdominal Cancer Surgery. JAMA surgery. 2017;152:852–859. [DOI] [PMC free article] [PubMed] [Google Scholar]
- 5.Lafaro KJ, Raz DJ, Kim JY, Hite S, Ruel N, Varatkar G, Erhunmwunsee L, Melstrom L, Lee B, Singh G, Fong Y and Sun V. Pilot study of a telehealth perioperative physical activity intervention for older adults with cancer and their caregivers. Support Care Cancer. 2020;28:3867–3876. [DOI] [PMC free article] [PubMed] [Google Scholar]
- 6.Kooiman TJ, Dontje ML, Sprenger SR, Krijnen WP, van der Schans CP and de Groot M. Reliability and validity of ten consumer activity trackers. BMC Sports Sci Med Rehabil. 2015;7:24. [DOI] [PMC free article] [PubMed] [Google Scholar]
- 7.Cleeland CS, Mendoza TR, Wang XS, Chou C, Harle MT, Morrissey M and Engstrom MC. Assessing symptom distress in cancer patients: the M.D. Anderson Symptom Inventory. Cancer. 2000;89:1634–46. [DOI] [PubMed] [Google Scholar]
- 8.Cleeland CS, Wang XS, Shi Q, Mendoza TR, Wright SL, Berry MD, Malveaux D, Shah PK, Gning I, Hofstetter WL, Putnam JB Jr., and Vaporciyan AA. Automated symptom alerts reduce postoperative symptom severity after cancer surgery: a randomized controlled clinical trial. J Clin Oncol. 2011;29:994–1000. [DOI] [PMC free article] [PubMed] [Google Scholar]
- 9.Pedregosa F, Varoquaux G, Gramfort, Michel V, Thirion B, Grisel O and Blondel M. Scikit-learn: Machine learning in Python. Journal of Machine Learning Research. 2011;12:2825–2830. [Google Scholar]
- 10.Lundberg S and Lee S. A unified approach to interpreting model predictions; 2017.
- 11.Rajkomar A, Oren E, Chen K, Dai A, Hajaj N, Hardt M and Liu P. Scalable and accurate deep learning with electronic health records. NPJ Digital Medicine. 2018;1:18. [DOI] [PMC free article] [PubMed] [Google Scholar]
- 12.Liu W, Stansbury C, Singh K, Ryan A, Sukul D, Mahmoudi E, Waljee A, Zhu J and Nallamothu B. Predicting 30-day hospital readmissions using artificial neural networks with medical code embedding. PloS one. 2020;15:e0221606. [DOI] [PMC free article] [PubMed] [Google Scholar]
- 13.Kalagara S, Eltorai AEM, Durand WM, DePasse JM and Daniels AH. Machine learning modeling for predicting hospital readmission following lumbar laminectomy. J Neurosurg Spine. 2018;30:344–352. [DOI] [PubMed] [Google Scholar]
- 14.Bolourani S, Tayebi MA, Diao L, Wang P, Patel V, Manetta F and Lee PC. Using machine learning to predict early readmission following esophagectomy. J Thorac Cardiovasc Surg. 2020. [DOI] [PubMed] [Google Scholar]
- 15.Corey K, Sehj E, Lagoo-Deenadayalan S, Heller K, Whelan K and Balu S. Development and validation of machine learning models to identify high-risk surgical patients using automatically curated electronic health record data (Pythia): A retrospective, single-site study. PLoS medicine 2018;15:e1002701. [DOI] [PMC free article] [PubMed] [Google Scholar]
- 16.Halloran S, Tang L, Guan Y, Shi J and Eyre J. Remote monitoring of stroke patients’ rehabilitation using wearable accelerometers. Proceedings of the 23rd International Symposium on Wearable Computers. 2019:72–77. [Google Scholar]
- 17.Raschka S (2018). Model evaluation, model selection, and algorithm selection in machine learning. arXiv preprint, 1811.12808.