

Abstract
Background and Objectives:
This study aims to characterize the utilization of minimally invasive myomectomy in the United States and to identify the patient and hospital factors associated with surgical approach to myomectomy.
Methods:
This is a cross-sectional study using the National Inpatient Sample database. We extracted women aged 18–50 years who underwent open and minimally invasive (laparoscopic and robotic) myomectomy (MIM) from January 1, 2010–December 31, 2014. Descriptive statistics were obtained for patient and hospital characteristics. We then performed multivariable logistic regression to examine the association of patient (age, race, insurance status, median household income) and hospital (bed size, teaching status, for-profit status, census region, cases volume) characteristics with the likelihood of undergoing MIM.
Results:
Of 114,850 myomectomy cases, 8,330 (7%) underwent MIM and 106,520 (93%) were open. Over time, the proportion of MIM remained very low and slightly decreased from 8.2% in 2010 to 6.1% in 2014 (p-for-trend: 0.001). Most hospitals performed few MIM per year, with 50% performing five or less, and 25% performing three or fewer per year. African American, Hispanic, and women of other races were less likely to undergo MIM compared to Caucasian women (adjusted odds ration [OR] 0.57, 95% confidence interval [CI] 0.50–0.64; 0.71, 95% CI 0.60–0.83; 0.62, 95% CI 0.52–0.74, respectively). Women in the West (adjusted odds ratio (aOR) 1.23, 95% CI 1.04–1.46) and Midwest (aOR 1.27, 95% CI 1.07–1.52) had higher odds of undergoing MIM.
Conclusion:
MIM appears to be an underutilized modality, accounting for less than10% of myomectomies. This underutilization disproportionally affects minority women.
Keywords: Fibroids, Myomectomy, Minimally invasive, Laparoscopic, Robotic
INTRODUCTION
Uterine fibroids are the most common benign tumor of the uterus with a lifetime incidence of up to 70%–80%.1 While advances in uterine preserving procedures and medical management of myomas have gained momentum, many symptomatic women ultimately require surgical management. Myomectomy remains the gold standard for surgical management for women desiring future fertility.1
With the advent of minimally invasive surgery (MIS), laparoscopic and robotic-assisted techniques are preferred over the open approach due to less blood loss, postoperative pain, shorter hospital stay, and decreased morbidity, even in high-risk conditions such as obesity.2–4 Minimally invasive myomectomy (MIM) is feasible even in cases with large fibroids.5 Although the use of MIS hysterectomy, has increased,6 there is still little data regarding overall utilization of MIM. Most existing data come from studies exploring changes in practice after the FDA power morcellation recommendation.7 The limited literature suggests that MIM remains underutilized, despite proven advantages.8–11
African American and other non-Caucasian women appear to be less likely to undergo MIS hysterectomy,12 but potential disparities have not been studied in myomectomy. Given the significantly higher prevalence of myomas in non-Caucasian women, there is a potential for disparities in this population. Only one study has examined racial disparities in myomectomy where minority women were more likely to undergo open myomectomy than Caucasian women. African American women had 50% increased odds of morbidity after open myomectomy including twice as likely to be readmitted, return to the operating room, receive a transfusion, and to experience thromboembolic phenomena, even after controlling for the myoma burden.13 However, this study did not include other patient and hospital variables. Hospital variables have been shown to impact the surgical approach for hysterectomy.12,14
The objectives of this study are to characterize the utilization of MIM and to examine the association of patient and hospital characteristics with surgical approach to myomectomy.
MATERIAL AND METHODS
This study was reviewed by the Johns Hopkins School of Medicine Institutional Review Board and determined to be exempt as data was de-identified and publicly available.
We used hospital reported data from the 2010–2014 National Inpatient Sample (NIS) database. The NIS is the largest publicly available, all-payer database of hospitalizations in the United States, including over 7 million hospitalizations from more than 4,000 hospitals annually.15 It includes surgical procedures, including myomectomy, in which women were admitted or observed one or more nights post-procedure. All data was reweighted to account for the redesign of the NIS in 2012, and prior studies have not found significant differences with the change in sample design for surgical outcomes.16
Women aged 18 to 50 years who underwent laparoscopic, robotic, and open myomectomy for fibroids were identified and included. We included women in whom fibroids and myomectomy were listed as one of the top 10 diagnoses or conditions during their hospitalization (International Classification of Disease [ICD]-9 for fibroids 218, 2180.0, 2180.1, 2180.2, 2180.9).17 We did not limit fibroids to the primary diagnosis to allow for other presenting complaints that are secondary to fibroids, such as abnormal uterine bleeding, symptomatic anemia, or pelvic pain. To minimize the inclusion of patients miscoded as having myomectomy, we excluded patients who did not have a diagnosis of fibroids among their first 10 diagnosis codes (n = 18,900 women); the most frequent diagnoses for these women were renal cancer (which has a similar ICD-9 code to fibroids).
Our primary outcome was undergoing MIM versus open myomectomy. We identified myomectomy approach using ICD-9 codes. Myomectomy approaches were categorized as open (IC9-9 68.19 or 68.29, without 54.21) or minimally invasive (ICD-9 68.19 or 68.29 with 54.21, 170.4, 17.41, 17.42, or 17.44); cases that were converted to open would be classified as open. Women who had a code for robotic-assisted procedure (ICD-9 170.4, 17.41, 17.42, or 17.44) were classified as having undergone robotic myomectomy. Given the small number of robotic myomectomies identified, we pooled robotic and laparoscopic myomectomies together for analysis.
In this study, we performed descriptive statistics for characterization and used multivariable logistic regression models to examine the association of patient (age, race, insurance status, median household income) and hospital (bed size, teaching status, for-profit status, Census region) factors with the likelihood of undergoing MIM (laparoscopic and robotic only) compared to open myomectomy. We added a hospital variable to account for hospital-level clustering.
For patient factors, age was stratified into four categories (ages 18–20, 21–30, 31–40, 41–50 years). Insurance status was categorized as private, public, and uninsured. Uninsured and publicly-insured were grouped together in final analysis, given the small number of uninsured women (less than 2,500 women per year). Median household income was defined as the median income in the patient’s zip code and was divided into quartiles by year (2014 quartiles: less than $40,00, $40,000–$50,999, $51,000–$65,999, $66,000 or more). Although the NIS lacks patient-level income data, the zip code-based variables highly correlate with actual patient income.18
We used NIS definitions for hospital factors. A hospital was considered a teaching hospital if it was a member of the Council of Teaching hospitals, had a residency program, or had a full-time resident to hospital bed equivalent ratio of 0.25. For-profit status was classified using the American Hospital Association Annual Survey of Hospitals; we considered both government-owned and private, not-for-profit hospitals as nonprofit. Hospital census region was categorized as Northeast, South, Midwest, and West. Large hospital bed size was defined using the NIS definition of 45 or more beds with variance in size categories by Census region and teaching status.
We defined hospital myomectomy volume as the number of cases who underwent myomectomy per year averaged over the five years of study. We divided myomectomy volume into low, medium, and high based on approximate tertiles. Low-volume was defined as 0–6 myomectomies per year, medium-volume as 7–15 myomectomies per year, and high-volume as 16 or more myomectomies per year. We excluded women missing any of the above patient or hospital characteristics from our analyses (n ∼ 10,000 cases).
Statistical Analysis
For descriptive statistics, we examined the frequency of patient and hospital characteristics and compared between MIM and open myomectomy using χ2 statistics. We examined trends in MIM over time using both univariable and multivariable logistic regression models, adjusted for above patient and hospital characteristics. We then used a logistic regression model to examine the association of patients and hospital characteristics on the likelihood of undergoing MIM in univariable and then multivariable analyses. We used NIS weighting by hospital discharges to obtain population-level estimates in all analyses. Two-sided p-values < 0.05 were considered significant. Analyses were performed using Stata version 11 (StataCorp, Texas).
We conducted sensitivity analyses first by examining the association of patients and hospital characteristics on the likelihood of undergoing MIM only at hospitals where one or more MIM was performed during the study period. Second, we analyzed cases with MIM from 2010–2013 only; we excluded data from 2014 to minimize confounding from the April 2014 FDA statement discouraging the use of power morcellation.
RESULTS
A total of 114,850 women underwent inpatient myomectomy for fibroids from January 1, 2010 –December 31, 2014. Of these, 106,520 (92.8%, 95% CI 92.4–93.1) underwent open myomectomy and 8,330 (7.2%, 95% CI 6.9–7.6) underwent MIM. During the study time frame, the proportion of MIM remained low and decreased from 8.2% (95% CI 7.5–9.0) in 2010 to 6.1% (95% CI 5.4–6.8) in 2014 (p-for-trend < 0.001).
There were statistically significant differences in baseline characteristics between women undergoing open myomectomy and MIM among age, race, hospital characteristics, region, and hospital volume (Table 1). Among all women undergoing myomectomy regardless of approach, the majority were between the ages of 31–40 years (55.9%, 95% CI 55.2–56.5). When looking only at MIM, the majority were between 41–50 years (57.5%, 95% CI 55.1–59.8). African American women underwent most myomectomies (44.5%, 95% CI 43.9–45.1); however, they only accounted for one-third of MIM (33.8%, 95% CI 31.5–36.0). Caucasian women underwent 29.6% (95% CI 29.0– 30.2) of myomectomies but accounted for 41.8% of MIM (95% CI 39.5–44.2). Geographically, most myomectomies were performed in the South (41.8%, 95% CI 41.1–42.4) and the minority in the Midwest (12.4%, 95% CI 12.0–12.8). Of MIM, 38.6% (95% CI 36.3–41.0) were performed in hospitals performing 0–6 myomectomies per year, 30.6% (95% CI 28.4–32.8) in hospitals performing 7–15 myomectomies per year, and 30.8% (95% CI 28.6–33.0) in hospitals performing 16 or more myomectomies per year.
Table 1.
Baseline Characteristics of Women Undergoing Myomectomies, 2010–2014
| All Cases% (95% CI) | Minimally Invasive Surgery Cases% (95% CI) | Open Cases% (95% CI) | p-Value | |
|---|---|---|---|---|
| Year | ||||
| 2010 | 21.3 (20.8–21.8) | 24.2 (22.1–26.2) | 21.1 (20.5–21.6) | < 0.001 |
| 2011 | 20.4 (19.9–20.9) | 22.8 (20.8–24.8) | 20.2 (19.7–20.7) | |
| 2012 | 20.0 (19.5–20.5) | 18.4 (16.5–20.2) | 20.1 (19.6–20.6) | |
| 2013 | 18.7 (18.2–19.2) | 18.2 (16.3–20.0) | 18.8 (18.2–19.3) | |
| 2014 | 19.6 (19.1–20.1) | 16.5 (14.7–18.2) | 19.9 (19.3–20.4) | |
| Patient Characteristics | ||||
| Age | ||||
| 18–20 years | 0.3 (0.2–0.3) | 0.2 (0.0–0.5) | 0.3 (0.2–0.3) | 0.81 |
| 21–30 years | 14.9 (14.5–15.4) | 8.8 (7.5–10.2) | 15.4 (14.9–15.9) | < 0.001 |
| 31–40 years | 55.9 (55.2–56.5) | 33.5 (31.2–35.7) | 57.6 (56.9–58.3) | < 0.001 |
| 41–50 years | 29.0 (28.4–29.5) | 57.5 (55.1–59.8) | 26.8 (26.2–27.3) | < 0.001 |
| Race | ||||
| Caucasian | 29.6 (29.0–30.2) | 41.8 (39.5–44.2) | 28.7 (28.1–29.3) | < 0.001 |
| African American | 44.5 (43.9–45.1) | 33.8 (31.5–36.0) | 45.3 (44.6–45.9) | < 0.001 |
| Hispanic | 13.5 (13.1–14.0) | 13.6 (12.0–15.3) | 13.5 (13.1–14.0) | 0.92 |
| Other race(s) | 12.3 (11.9–12.8) | 10.8 (9.3–12.2) | 12.5 (12.0–12.9) | 0.02 |
| Insurance type | ||||
| Private | 75.3 (74.8–75.9) | 74.8 (72.7–76.9) | 75.4 (74.8–76.0) | 0.62 |
| Public | 18.8 (18.3–19.3) | 19.1 (17.2–20.9) | 18.7 (18.2–19.2) | 0.52 |
| Uninsured | 5.9 (5.6–6.2) | 6.1 (5.0–7.2) | 5.9 (5.6–6.2) | 0.52 |
| Household income | ||||
| Lowest quartile | 24.1 (23.6–24.7) | 24.7 (22.7–26.8) | 24.0 (23.5–24.6) | 0.29 |
| 2nd quartile | 21.1 (20.6–21.6) | 22.2 (20.2–24.2) | 21.0 (20.4–21.5) | 0.14 |
| 3rd quartile | 25.8 (25.3–26.4) | 25.5 (23.4–27.5) | 25.9 (25.3–26.5) | 0.47 |
| Highest quartile | 29.0 (28.4–29.6) | 27.6 (25.5–29.7) | 29.1 (28.5–29.7) | 0.10 |
| Hospital Characteristics | ||||
| Large hospital | 60.7 (60.1–61.3) | 60.2 (57.8–62.5) | 39.2 (38.6–39.9) | 0.24 |
| Teaching hospital | 65.3 (64.7–65.9) | 58.0 (55.6–60.4) | 65.9 (65.3–66.5) | 0.001 |
| For-profit hospital | 13.7 (13.2–14.1) | 13.7 (12.0–15.3) | 13.6 (13.2–14.1) | 0.82 |
| Region | ||||
| Northeast | 25.1 (24.6–25.7) | 22.2 (20.2–24.2) | 25.3 (24.7–25.9) | 0.04 |
| South | 41.8 (41.1–42.4) | 38.1 (35.8–40.4) | 42.0 (41.3–42.6) | 0.02 |
| Midwest | 12.4 (12.0–12.8) | 14.4 (12.7–16.1) | 12.2 (11.8–12.7) | 0.001 |
| West | 20.7 (20.2–21.2) | 25.3 (23.2–27.4) | 25.3 (23.2–27.4) | 0.01 |
| Hospital cases per year | ||||
| 0–6 | 34.9 (34.3–35.5) | 38.6 (36.3–41.0) | 34.7 (34.0–35.3) | 0.001 |
| 7–15 | 31.0 (30.4–31.6) | 30.6 (28.4–32.8) | 31.1 (30.5–31.7) | 0.38 |
| 16+ | 34.0 (33.4–34.7) | 30.8 (28.6–33.0) | 34.2 (33.6–34.9) | 0.02 |
CI, confidence interval.
Unweighted n is 23,628 myomectomies in 6,011 hospitals.
Proportions are within each group.
2014 income quartiles: less than $40,00, $40,000–$50,999, $51,000–$65,999, $66,000 or more.
Mean annual hospital volume for all myomectomies was 13 cases (95% CI 13–14). Most hospitals perform very few MIM per year with 50% performing five or fewer, and 25% performing three or fewer. Average length of stay for all approaches was 2.62 days (95% CI 2.59–2.65). Length of stay was slightly shorter for MIM versus open myomectomy (2.48 days; 95% CI 2.38–2.57 and 2.63 days; 95% CI 2.60–2.66, respectively, P < .001). A higher proportion of women who underwent MIM were hospitalized 24 hours or fewer than women undergoing open myomectomy [27.3% (95% CI 25.1–29.4) vs. 16.6% (95% CI 16.2–17.1), P < .001].
Among all women undergoing myomectomy during the study period (n = 114,850), African American women had lower odds of undergoing MIM (OR 0.57, 95% CI 0.50–0.64) compared to Caucasian women. Hispanic women (OR 0.71, 95% CI 0.60–0.83) and women of other races (OR 0.62, 95% CI 0.52–0.74) also had lower odds of undergoing MIM compared to Caucasian women. Women in the West (OR 1.23, 95% CI 1.04–1.46) and Midwest (OR 1.27, 95% CI 1.07–1.52) had higher odds of undergoing MIM. Women in higher income brackets (third quartile OR 0.85, 95% CI 0.73–0.98; highest quartile OR 0.75, 95% CI 0.65–0.87), and those having surgery at teaching hospitals (OR 80, 95% CI 0.72–0.91) had lower odds of undergoing MIM. Hospitals with the highest volume of myomectomies had lower odds of performing MIM (OR 0.84 95% CI 0.71–0.99) compared to low-volume hospitals (0–6 per year) (Table 2).
Table 2.
Association of Minimally Invasive Myomectomy with Patient, Hospital, and Gynecologic Characteristics in All Hospitals during Study Time Window (n = 114,850 Myomectomies)
| Univariate Analysis Odds Ratio (95% CI) | p-Value | Multivariable Analysis Odds Ratio (95% CI) | p-Value | |
|---|---|---|---|---|
| Year | ||||
| 2010 | 1.20 (1.06–1.34) | 0.003 | 0.90 (0.86–0.95) | < 0.001 |
| 2011 | 1.17 (1.04–1.31) | 0.01 | ||
| 2012 | 0.89 (0.79–1.02) | 0.09 | ||
| 2013 | 0.96 (0.85–1.10) | 0.58 | ||
| 2014 | 0.79 (0.69–0.91) | 0.001 | ||
| Patient Characteristics | ||||
| Age | ||||
| 18–20 years | 0.91 (0.33–2.52) | 0.86 | Reference | |
| 21–30 years | 0.53 (0.45–0.63) | < 0.001 | 0.69 (0.24–1.95) | 0.48 |
| 31–40 years | 0.37 (0.33–0.41) | < 0.001 | 0.74 (0.26–2.08) | 0.56 |
| 41–50 years | 3.70 (3.35–4.10) | < 0.001 | 2.66 (0.94–7.48) | 0.07 |
| Race | ||||
| Caucasian | 1.79 (1.62–1.98) | < 0.001 | Reference | |
| African American | 0.62 (0.55–0.68) | < 0.001 | 0.57 (0.50–0.64) | < 0.001 |
| Hispanic | (0.87–1.17) | 0.90 | 0.71 (0.60–0.83) | < 0.001 |
| Other race(s) | 0.85 (0.72–0.99) | 0.04 | 0.62 (0.52–0.74) | < 0.001 |
| Insurance type | ||||
| Public and Uninsured | 1.03 (0.92–1.15) | 0.61 | Reference | |
| Private | 0.97 (0.87–1.09) | 0.61 | 0.92 (0.82–1.05) | 0.21 |
| Household income | ||||
| Lowest quartile | 1.04 (0.92–1.16) | 0.56 | Reference | |
| 2nd quartile | 1.08 (0.95–1.21) | 0.23 | 0.93 (0.80–1.08) | 0.35 |
| 3rd quartile | 0.98 (0.87–1.10) | 0.73 | 0.85 (0.73–0.98) | 0.03 |
| Highest quartile | 0.93 (0.83–1.04) | 0.20 | 0.75 (0.65–0.87) | < 0.001 |
| Hospital Characteristics | ||||
| Large hospital | 0.98 (0.89–1.07) | 0.65 | 0.94 (0.84–1.05) | 0.30 |
| Teaching hospital | 0.73 (0.67–0.80) | < 0.001 | 0.80 (0.72–0.91) | < 0.001 |
| For-profit hospital | 1.00 (0.88–1.15) | 0.98 | 0.90 (0.77–1.05) | 0.18 |
| Region | ||||
| Northeast | 0.84 (0.75–0.95) | 0.004 | Reference | |
| South | 0.85 (0.77–0.94) | 0.002 | 1.07 (0.92–1.24) | 0.38 |
| Midwest | 1.20 (1.05–1.39) | 0.01 | 1.27 (1.07–1.52) | 0.006 |
| West | 1.33 (1.18–1.49) | < 0.001 | 1.23 (1.04–1.46) | 0.02 |
| Hospital cases per year | ||||
| 0–6 | 1.19 (1.07–1.32) | 0.001 | Reference | |
| 7–15 | 0.98 (0.88–1.09) | 0.66 | 0.97 (0.85–1.10) | 0.60 |
| 16+ | 0.85 (0.77–0.95) | 0.003 | 0.84 (0.71–0.99) | 0.03 |
CI, confidence interval.
Unweighted n is 23,628 myomectomies in 6,011 hospitals.
Multivariable analysis weighted and adjusted for all patient and hospital characteristics.
Large hospital size was defined as 45 or more beds with variance in size categories by Census region and teaching status.
2014 income quartiles: less than $40,00, $40,000–$50,999, $51,000–$65,999, $66,000 or more.
Subgroup analyses showed that, among African American women only, there were lower odds of MIM in high-income brackets (third quartile OR 0.73 95% CI 0.58–0.92; highest quartile 0.69 95% CI 0.54–0.88) without a statistically significant difference among other patient or hospital characteristics. Among Caucasian women only, there were lower odds of undergoing MIM with private insurance (OR 0.76 95% CI 0.61–0.95), in the highest income bracket (OR 0.76 95% CI 0.59–0.98), and at teaching hospitals (OR 0.74 95% CI 0.62–0.89) (Table 3).
Table 3.
Association of Minimally Invasive Myomectomy with Patient, Hospital, and Gynecologic Characteristics by Race (n = 114,850 Myomectomies)
| African American Women |
Caucasian Women |
|||
|---|---|---|---|---|
| Odds Ratio (95% CI) | p-value | Odds Ratio (95% CI) | p-value | |
| Year | ||||
| 2010 | 0.89 (0.82–0.96) | 0.003 | 0.91 (0.84–0.98) | 0.013 |
| 2011 | ||||
| 2012 | ||||
| 2013 | ||||
| 2014 | ||||
| Patient Characteristics | ||||
| Age | ||||
| 18–20 years | Reference | Reference | ||
| 21–30 years | 0.40 (0.12–1.37) | 0.15 | 0.78 (0.09–6.59) | 0.82 |
| 31–40 years | 0.37 (0.1103644–1.26) | 0.11 | 0.97 (0.12–8.10) | 0.97 |
| 41–50 years | 1.07 (0.32–3.60) | 0.92 | 4.810 (0.57–40.27) | 0.15 |
| Insurance type | ||||
| Public and Uninsured | Reference | Reference | ||
| Private | 0.91 (0.75–1.10) | 0.33 | 0.76 (0.61–0.95) | 0.02 |
| Household income | ||||
| Lowest quartile | Reference | Reference | ||
| 2nd quartile | 0.79 (0.63–1.01) | 0.06 | 0.98 (0.76–1.28) | 0.90 |
| 3rd quartile | 0.73 (0.58–0.92) | 0.008 | 0.87 (0.67–1.12) | 0.28 |
| Highest quartile | 0.69 (0.54–0.88) | 0.003 | 0.76 (0.59–0.98) | 0.04 |
| Hospital Characteristics | ||||
| Large hospital | 0.90 (0.75–1.09) | 0.29 | 0.90 (0.75–1.07) | 0.24 |
| Teaching hospital | 0.82 (0.67–1.02) | 0.07 | 0.74 (0.62–0.89) | 0.002 |
| For-profit hospital | 0.96 (0.73–1.26) | 0.79 | 1.04 (0.82–1.34) | 0.73 |
| Region | ||||
| Northeast | Reference | Reference | ||
| South | 1.07 (0.84–1.36) | 0.59 | 1.01 (0.79–1.29) | 0.96 |
| Midwest | 1.33 (0.99–1.78) | 0.06 | 1.27 (0.98–1.65) | 0.07 |
| West | 1.35 (0.95–1.91) | 0.09 | 1.16 (0.89–1.50) | 0.27 |
| Hospital cases per year | ||||
| 0–6 | Reference | Reference | ||
| 7–15 | 1.07 (0.86–1.34) | 0.54 | 0.91 (0.74–1.12) | 0.391 |
| 16+ | 0.87 (0.66–1.14) | 0.32 | 0.83 (0.64–1.08) | 0.16 |
CI, confidence interval.
Unweighted n is 23,628 myomectomies in 6,011 hospitals.
Multivariable analysis weighted and adjusted for all patient and hospital characteristics.
Large hospital size was defined as 45 or more beds with variance in size categories by Census region and teaching status.
2014 income quartiles: less than $40,00, $40,000–$50,999, $51,000–$65,999, $66,000 or more.
Subgroup analysis by region showed that African American women had lower odds of undergoing MIM compared to Caucasian women across all regions. In the South and Midwest, women had lower odds of undergoing MIM at teaching hospitals (OR 0.78, 95% CI 0.64–0.95, OR 0.54 95% CI 0.40–0.73 respectively). In the West, women in the highest income brackets had lower odds of undergoing MIM compared to other income brackets (OR 0.65, 95% CI 0.46–0.91). No other statistically significant differences were seen within regions (Table 4).
Table 4.
Association of Minimally Invasive Myomectomy with Patient, Hospital, and Gynecologic Characteristics by Region (n = 114,850 Myomectomies)
| Northeast |
South |
Midwest |
West |
|||||
|---|---|---|---|---|---|---|---|---|
| Odds Ratio (95% CI) | p-value | Odds Ratio (95% CI) | p-value | Odds Ratio (95% CI) | p-value | Odds Ratio (95% CI) | p-value | |
| Year | ||||||||
| 2010 | 0.84 (0.74–0.94) | 0.003 | 0.86 (0.79–0.93) | < 0.001 | 0.93 (0.82–1.05) | 0.25 | 0.99 (0.86–1.14) | 0.86 |
| 2011 | ||||||||
| 2012 | ||||||||
| 2013 | ||||||||
| 2014 | ||||||||
| Patient Characteristics | ||||||||
| Age | ||||||||
| 18–20 years | Reference | Reference | Reference | Reference | ||||
| 21–30 years | 0.63 (0.08–5.26) | 0.67 | 1.01 (0.13–8.02) | 0.99 | 0.44 (0.05–3.97) | 0.46 | 0.57 (0.07– 4.41) | 0.59 |
| 31–40 years | 0.48 (0.06–3.91) | 0.49 | 1.12 (0.14–8.80) | 0.91 | 0.60 (0.07–5.24) | 0.64 | 0.70 (0.09–5.34) | 0.74 |
| 41–50 years | 1.41 (0.17–11.54) | 0.75 | 4.33 (0.55–33.91) | 0.16 | 3.19 (0.37–27.83) | 0.29 | 2.27 (0.30–17.16) | 0.43 |
| Race | ||||||||
| Caucasian | Reference | Reference | Reference | Reference | ||||
| African American | 0.55 (0.43–0.72) | < 0.001 | 0.57 (0.47–0.69) | < 0.001 | 0.61 (0.44–0.84) | 0.002 | 0.58 (0.43–0.78) | < 0.001 |
| Hispanic | 0.75 (0.52–1.08) | 0.12 | 0.73 (0.54–0.97) | 0.03 | 0.48 (0.25–0.96) | 0.04 | 0.70 (0.53–0.93) | 0.01 |
| Other race(s) | 0.65 (0.46–0.93) | 0.02 | 0.67 (0.48–0.93) | 0.02 | 0.75 (0.46–1.22) | 0.25 | 0.56 (0.41– 0.77) | < 0.001 |
| Insurance type | ||||||||
| Public and Uninsured | Reference | Reference | Reference | Reference | ||||
| Private | 0.90 (0.70–1.16) | 0.41 | 0.89 (0.73–1.08) | 0.23 | 0.80 (0.58–1.12) | 0.20 | 1.10 (0.88– 1.50) | 0.32 |
| Household income | ||||||||
| Lowest quartile | Reference | Reference | Reference | Reference | ||||
| 2nd quartile | 0.74 (0.52–1.04) | 0.08 | 0.95 (0.75–1.19) | 0.64 | 0.97 (0.67–1.41) | 0.88 | 1.08 (0.77–1.53) | 0.64 |
| 3rd quartile | 0.83 (0.61–1.13) | 0.23 | 0.87 (0.69–1.10) | 0.24 | 0.77 (0.53–1.12) | 0.17 | 0.91 (0.65–1.27) | 0.58 |
| Highest quartile | 0.84 (0.62–1.14) | 0.27 | 0.83 (0.65–1.04) | 0.12 | 0.71 (0.46–1.07) | 0.103 | 0.65 (0.46–0.91) | 0.01 |
| Hospital Characteristics | ||||||||
| Large hospital | 0.79 (0.61–1.02) | 0.07 | 1.06 (0.89–1.26) | 0.49 | 0.76 (0.57–1.03) | 0.08 | 0.97 (0.76–1.22) | 0.78 |
| Teaching hospital | 0.93 (0.69–1.24) | 0.62 | 0.78 (0.64–0.95) | 0.01 | 0.54 (0.40–0.73) | < 0.001 | 0.88 (0.70–1.11) | 0.28 |
| For-profit hospital | 1.72 (0.92–3.24) | 0.09 | 0.92 (0.74–1.14) | 0.42 | 0.87 (0.49–1.55) | 0.64 | 0.81 (0.59–1.10) | 0.18 |
| Hospital cases per year | ||||||||
| 0–6 | Reference | Reference | Reference | Reference | ||||
| 7–15 | 1.22 (0.91–1.63) | 0.18 | 0.95 (0.77–1.17) | 0.62 | 1.24 (0.84–1.83) | 0.28 | 0.78 (0.60–1.01) | 0.06 |
| 16+ | 1.15 (0.79–1.67) | 0.47 | 0.79 (0.60–1.03) | 0.08 | 1.19 (0.73–1.95) | 0.49 | 0.71 (0.51–0.99) | 0.05 |
CI, confidence interval.
Unweighted n is 23,628 myomectomies in 6,011 hospitals.
Multivariable analysis weighted and adjusted for all patient and hospital characteristics.
Large hospital size was defined as 45 or more beds with variance in size categories by Census region and teaching status.
2014 income quartiles: less than $40,00, $40,000–$50,999, $51,000–$65,999, $66,000 or more.
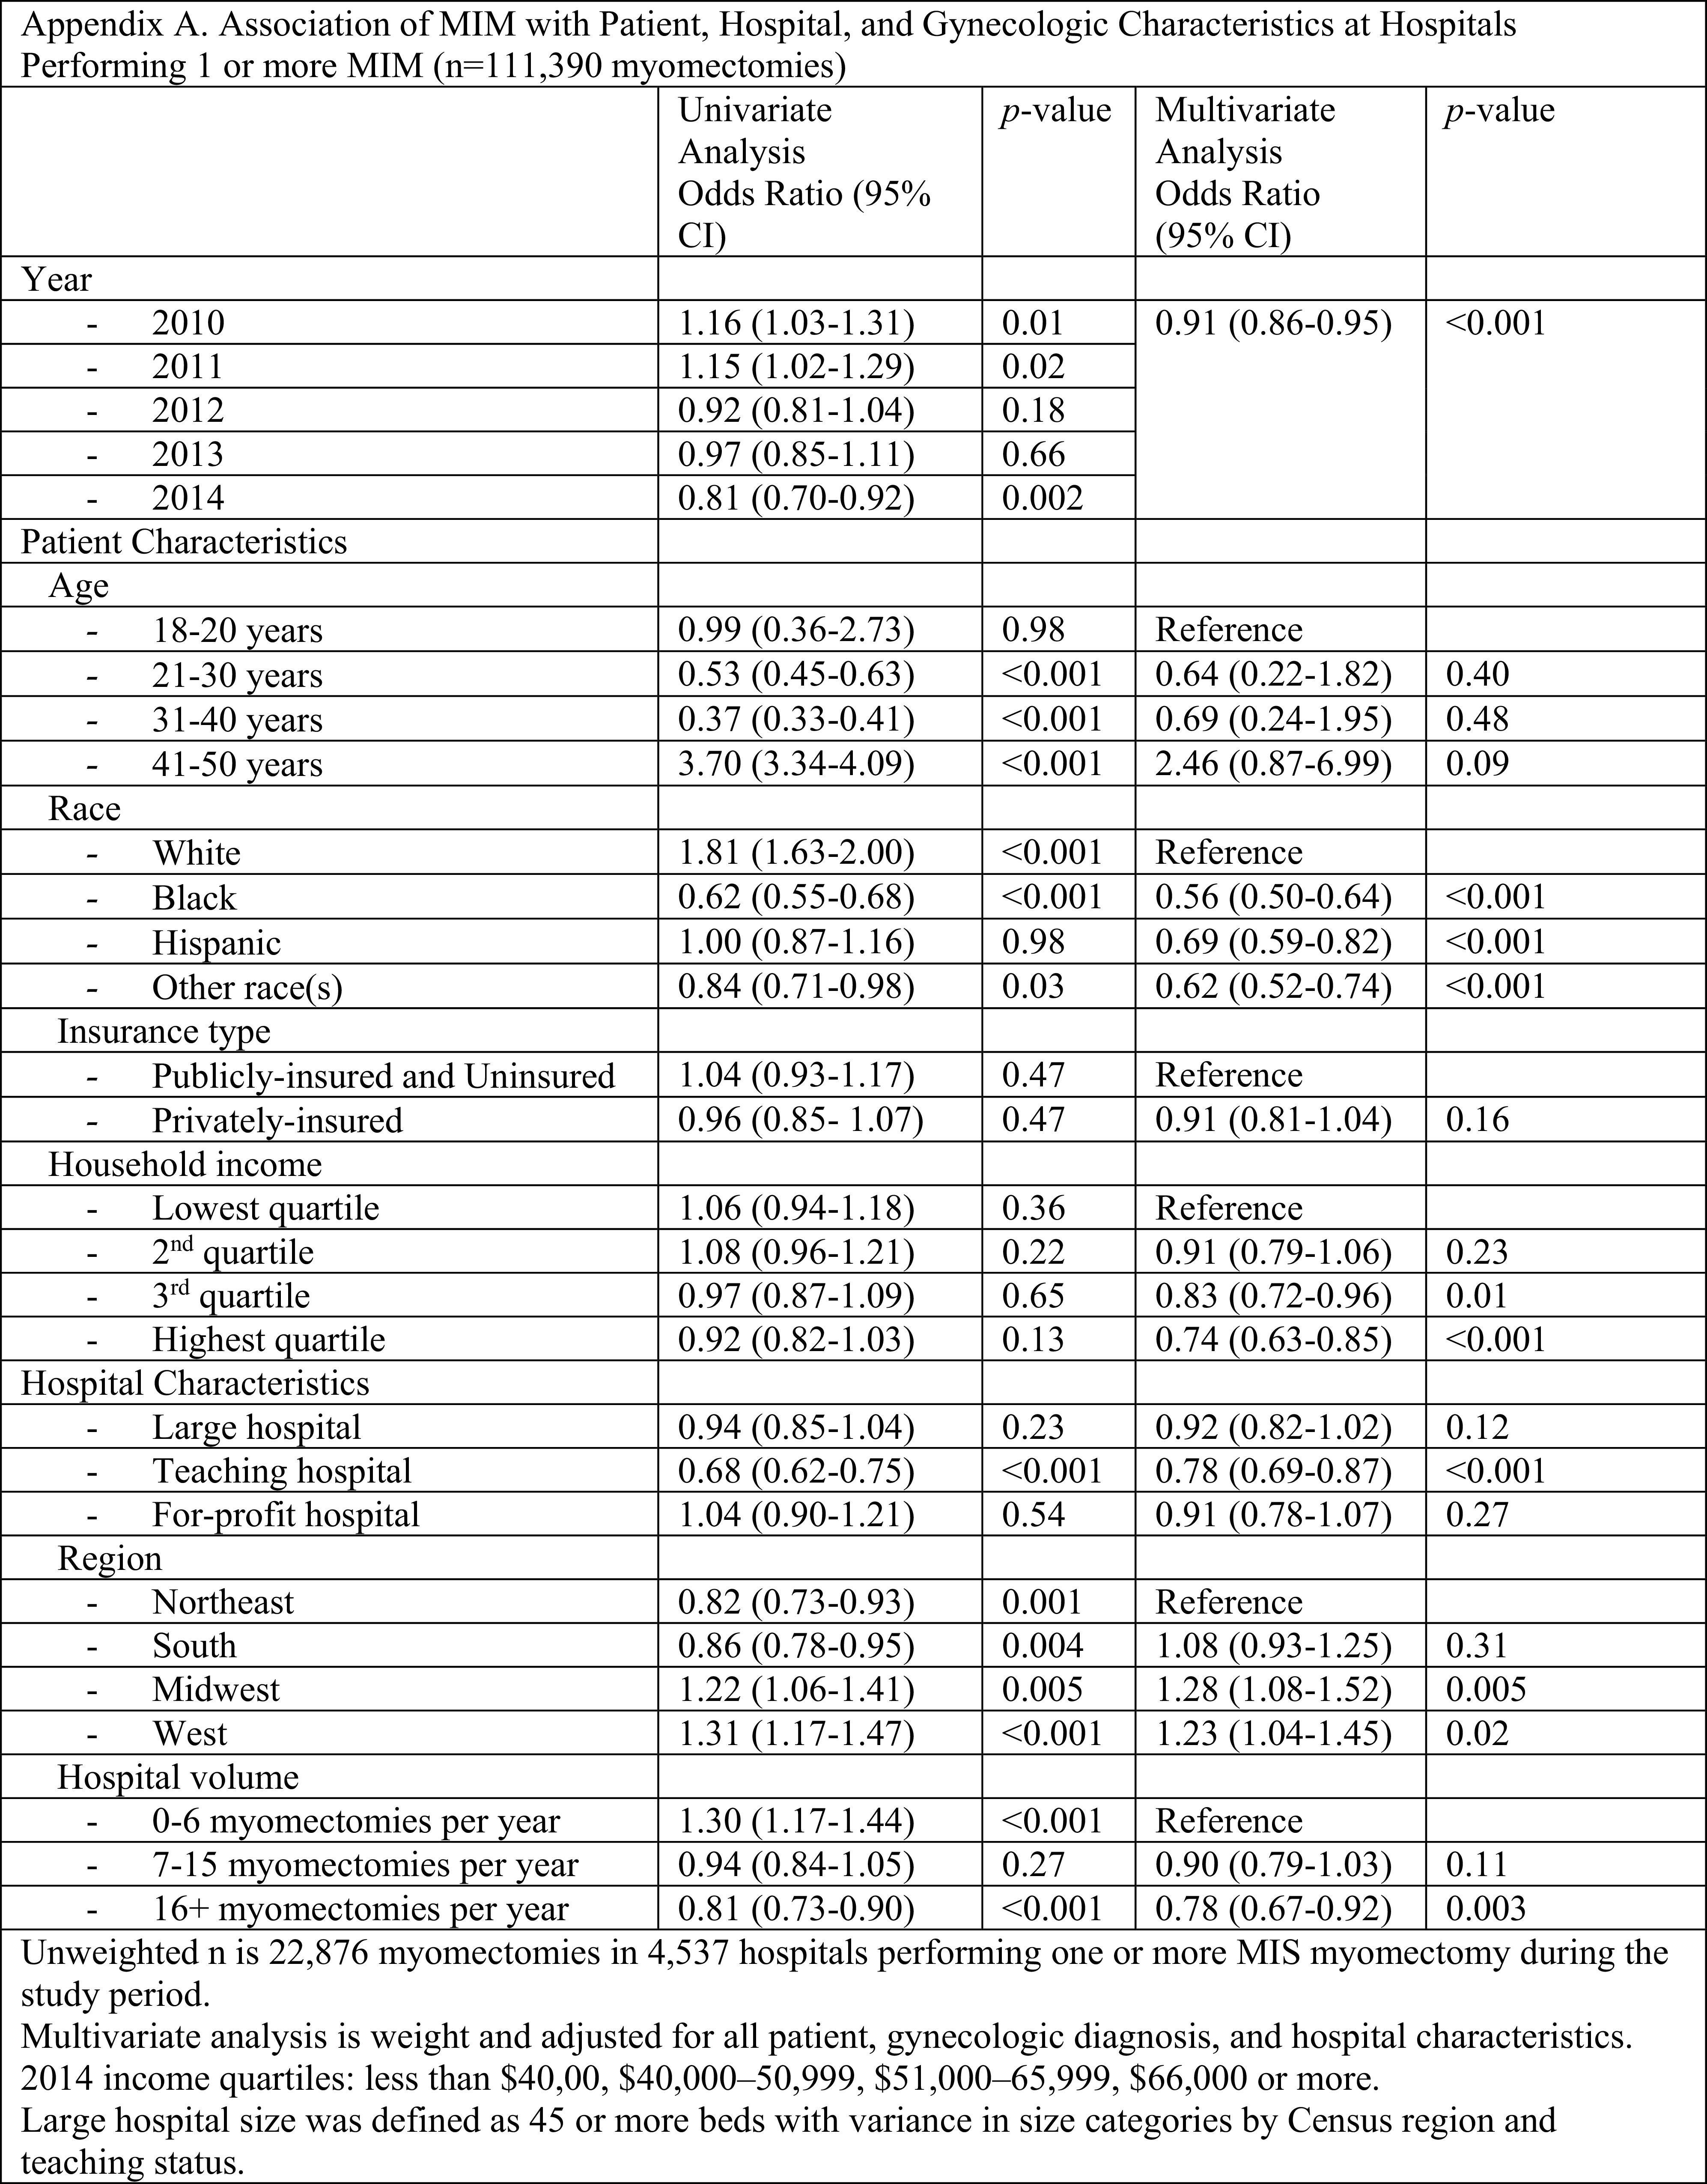
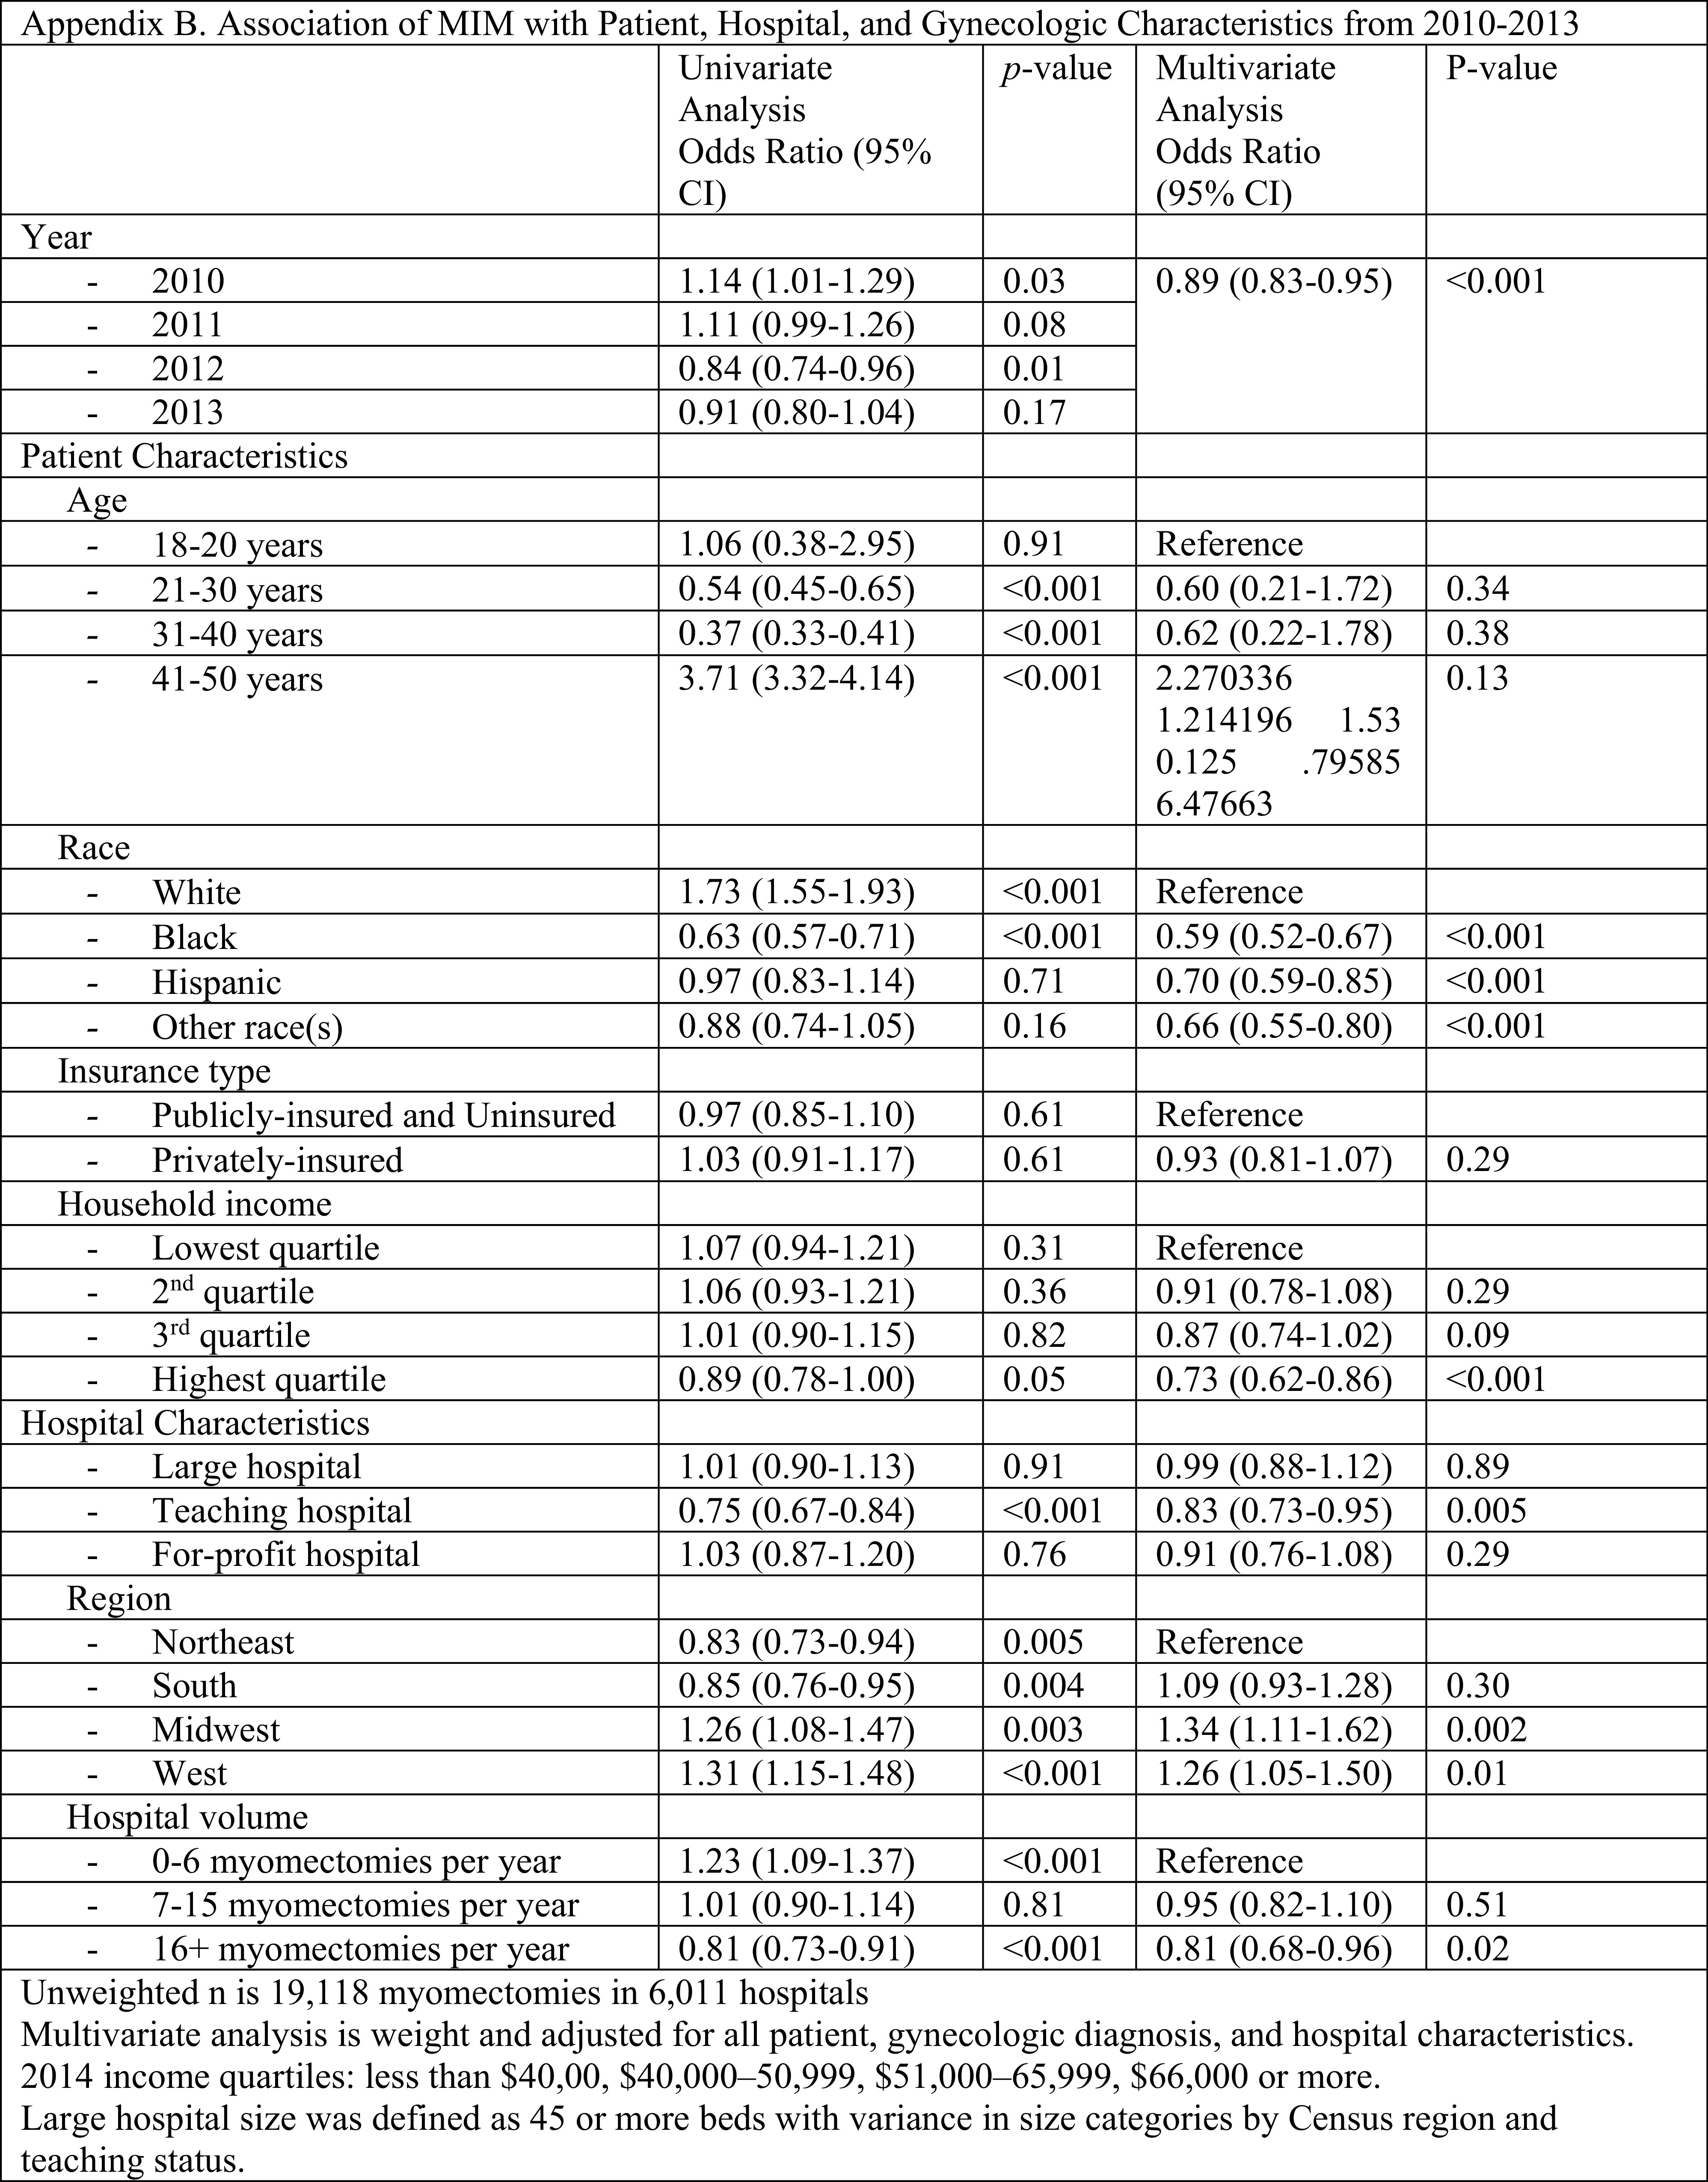
When the data was limited to only hospitals performing at least one MIM per year (n = 111,390, Appendix A), the findings remained the same. When myomectomies performed during 2014 were excluded to remove any confounding from the 2014 FDA recommendation against power morcellation, the only value that was no longer statistically significant was women in the third quartile income bracket no longer had lower odds of undergoing MIM (Appendix B).
DISCUSSION
In our analysis of almost 115,000 women who underwent inpatient myomectomy in the United States, we found significant underutilization of the minimally invasive approach with further racial and regional disparities. African American women were half as likely to undergo MIM after adjustment for other patient and hospital factors.
MIM remains the gold standard for uterine sparing surgery with decreased blood loss and postoperative pain, shorter hospital stays, and faster recovery. Despite these benefits, less than 10% of myomectomies were performed using an MIS approach during the study period. This underutilization may be attributed to the higher costs and/or challenging surgical techniques, including laparoscopic suturing, knot tying, dissection, and extraction of the myoma. Specifically, studies have shown that laparoscopic knot tying is a significant barrier to performing laparoscopy. Therefore, barbed sutures gained popularity in MIM and other gynecologic surgeries.19,20
In our study, African American women underwent most myomectomies but had the lowest proportion of MIM. A large body of research has shown racial disparities in women undergoing hysterectomy6,12,14 with an independent increase in surgical complications in African American and Asian American women; one study showing an elevated odds of almost every category of medical/surgical complications in African American women as well as risk of readmission.21–23 A 2020 study by Pollack et al. showed that African American, Hispanic, and Asian/Pacific Islander women eligible for minimally invasive hysterectomy were more likely than Caucasian women to undergo an open hysterectomy.24 Another study using the NIS showed that African American women had only half the odds of undergoing MIS hysterectomy after adjusting for patient, clinical, and hospital characteristics.25 The NIS lacks information about pre-operative imaging or specimen weight and the MIM racial disparities in our data could be explained, at least in part, by more complex fibroids (larger and/or higher number) in African American women. However, one prior study on myomectomy showed that African American women are substantially more likely to undergo myomectomy via laparotomy, even when accounting for fibroid burden.13 Fibroid disease severity in African American women would also not account for the MIM disparity seen in other minority groups in our study. These findings highlight the need for further efforts to address disparities, specifically in myomectomy given the higher prevalence and burden of fibroids in African American women making this procedure more common in this racial group.
Women in the Midwest and the West had higher odds of undergoing MIM, which may be correlated to these previously demonstrated racial disparities. According to the United States Census Bureau, the distribution of states with the lowest African American population (< 10%) were the Midwest and West.26 However, in the multivariable analysis, the associations of race and region should be controlled and therefore this relationship is not the sole reason for these findings. Disparities in geographic region may also be related to obesity with lower obesity rates seen in those regions that were more likely to perform MIM.
Our data indicates a lower odds of undergoing MIM with private insurance and higher-income brackets, which contradicts previous hysterectomy data.14 This data may be a limitation of an inpatient database, discussed further below. If same day discharge MIM analysis were also included, this data may in fact show that those patients requiring admission (rather than same day discharge) are those with lower income and public insurance. Further research is needed within this area. The findings regarding lower odds of undergoing MIM at teaching hospitals must be taken with caution, given the broad NIS definition of a teaching hospital (a member of the Council of Teaching hospital, had a residency program, or had a full-time resident), which accounted for 65% of hospitals in our study.
Lastly, our data indicated that women aged 41–50 had a higher odds of undergoing MIM compared to younger women. Due to the lack of tactile feedback with minimally invasive surgery compared to open surgery, there may be some surgeons who prefer to palpate the uterus if the myomectomy is being performed for future fertility to avoid retention of fibroids. Certain studies do indicate a higher risk of recurrence with laparoscopy versus open technique, although data is conflicting.27,28
There are inherent limitations of a large national database, including coding inconsistences between hospitals and coding errors. We attempted to account for some coding error by eliminating cases that did not have fibroids listed in the top ten discharge diagnoses. Another significant limitation of this study is an inpatient database which does not account for same-day discharges. However, a literature review of published studies in and around our study period suggests that same day discharge was not as ubiquitous at the time of our study as it is in current times, suggesting our data may be broadly applicable. Studies which specifically explore and report on day of discharge rates are from single, academic, high-volume institutions with a small number of specialized surgeons. One study was between January 1, 2011–December 31, 2013 with same day discharge rates of 88% (N = 403) and another between January 1, 2012–December 31, 2018 with same day discharge rates of 66% (N = 315).29,30 There has only been one large National Surgical Quality Improvement Program (NSQUIP) study performed between January 1, 2014–December 31, 2016, which is even beyond our study time period, (N = 7531, ∼3000 MIS) with a same day discharge rate of 57.5% among laparoscopic myomectomies.31 One additional study of laparoscopic and robotic myomectomies performed between January 1, 2016–December 31, 2017 had 57% of patients remain in the hospital for one day, 25% for 2 days, and 2% for 3 days which would indicated a same-day discharge rate of only ∼15% (10), albeit a small study. Therefore, one could conclude that MIM rates were lower during our study time frame. Even if one were to double the reported MIM rate in our study to account for the possibly unincluded ∼50%–60% discharged same day as evidenced by the large NSQUIP study, the rates of MIM would still be staggeringly low (∼14%), although caution must be taken with this direct comparison. One must also caution the low values reported in our paper as this may be a result of fewer myomectomies overall with improvements in medical and surgical management.
Likely causes for the underutilization of MIM include higher surgical costs and the need for advanced MIS skills. There are multiple confounders that make a direct cost comparison of abdominal versus minimally invasive surgeries, as well as laparoscopic versus robotic surgeries a challenge.32 Historically, abdominal myomectomies were noted to be the least expensive compared with laparoscopic and robotic,33 however, several studies in gynecologic surgery have shown with increasing expertise in MIS, there are shorter operating times, shorter length of stay, and fewer readmissions which can result in overall lower costs.34,35 A recent study demonstrated that the operating room time and the hospital length of stay appear to be potentially modifiable predictors of cost.36 Another study provided specific strategies to cut waste in the operating room via parallel tasking, minimizing time, and minimizing the number of instruments used.37 Also, outpatient surgeries appear to be safe with significant cost savings.38 Simulation appears to be an effective way to improve MIS skills and increase its utilization. First, simulation may improve the quality and safety of surgery. Second, simulation can decrease operating room time which can reduce cost and therefore increase utilization. Current evidence suggests that simulation can affect outcomes.39 Interestingly, it appears that simulation training in the laparoscopic and robotic platforms affect each other.40 Even more, it appears that improved spatial and temporal eye-brain-hand coordination from video games may improve performance.41,42
CONCLUSION
In conclusion, MIM not only remains underutilized, but also the underutilization disproportionally affects minority women. Recognition of these racial disparities is a critical first step and demands further investigation and action on a societal level. When feasible, women in need of myomectomy for complex fibroids can be referred to surgeons skilled in MIS techniques to assess their candidacy for an MIS approach. Given the high rate of myomectomy among African American women, referrals become increasingly important for them. Future studies include directly exploring outpatient myomectomy and surgical complications in each of the racial groups while controlling for the fibroid burden.
Appendix A.
Appendix B.
Footnotes
This study was presented in part at the 48th Global MIGS Congress in Vancouver, Canada, 2019.
Disclosure: Kristin E. Patzkowsky was a speaker for Abbvie in 2018. No other authors report disclosures.
Conflict of interests: none.
Funding sources: The authors thank the Johns Hopkins Department of Gynecology and Obstetrics’ Kelly Society grant for financial support. This work was also supported, in part, by NIH grant 1R01HD094380 to Mostafa A. Borahay.
Informed consent: Dr. Anja S. Frost declares that written informed consent was obtained from the patient/s for publication of this study/report and any accompanying images.
Contributor Information
Anja S. Frost, Department of Gynecology and Obstetrics, Johns Hopkins School of Medicine, Baltimore, Maryland..
Meghan McMahon, Department of Gynecology and Obstetrics, Johns Hopkins School of Medicine, Baltimore, Maryland..
Anna Jo Bodurtha Smith, Department of Gynecology and Obstetrics, Johns Hopkins School of Medicine, Baltimore, Maryland.; Department of Gynecology and Obstetrics, University of Pennsylvania Perelman School of Medicine, Philadelphia, Pennsylvania.
Mostafa A. Borahay, Department of Gynecology and Obstetrics, Johns Hopkins School of Medicine, Baltimore, Maryland..
Kristin E. Patzkowsky, Department of Gynecology and Obstetrics, Johns Hopkins School of Medicine, Baltimore, Maryland..
References:
- 1.Falcone T, Bedaiwy MA. Minimally invasive management of uterine fibroids. Curr Opin Obstet Gynecol. 2002;14(4):401–407. [DOI] [PubMed] [Google Scholar]
- 2.Alkatout I, Mettler L, Maass N, et al. Robotic surgery in gynecology. J Turk Ger Gynecol Assoc. 2016;17(4):224–232. [DOI] [PMC free article] [PubMed] [Google Scholar]
- 3.Kilic GS, et al. Comparison of perioperative outcomes of total laparoscopic and robotically assisted hysterectomy for benign pathology during introduction of a robotic program. Obstet Gynecol Int. 2. 011;2011:683703. [DOI] [PMC free article] [PubMed]
- 4.Borahay MA, Tapısız ÖL, Alanbay İ, et al. Outcomes of robotic, laparoscopic, and open hysterectomy for benign conditions in obese patients. J Turkish German Gynecol Assoc. 2018;19(2):72–77. [DOI] [PMC free article] [PubMed] [Google Scholar]
- 5.Takmaz Ö, Gündoğan S, Özbaşlı E, et al. Laparoscopic assisted robotic myomectomy of a huge myoma; does robotic surgery change the borders in minimally invasive gynecology? J Turk Ger Gynecol Assoc. 2019;20(3):211–212. [DOI] [PMC free article] [PubMed] [Google Scholar]
- 6.Lee J, Jennings K, Borahay MA, et al. Trends in the national distribution of laparoscopic hysterectomies from 2003 to 2010. J Minim Invasive Gynecol. 2014;21(4):656–661. [DOI] [PMC free article] [PubMed] [Google Scholar]
- 7.Pereira N, Frankel WC, Hutchinson AP, et al. Temporal trends in minimally invasive myomectomy before and after the US Food and Drug Administration recommendation against electric morcellation. Int J Gynecol Obstet. 2017;137(3):295–300. [DOI] [PubMed] [Google Scholar]
- 8.Advincula AP, Xu X, Goudeau S, et al. Robot-assisted laparoscopic myomectomy versus abdominal myomectomy: a comparison of short-term surgical outcomes and immediate costs. J Minim Invasive Gynecol. 2007;14(6):698–705. [DOI] [PubMed] [Google Scholar]
- 9.Havryliuk Y, Setton R, Carlow JJ, et al. Symptomatic fibroid management: systematic review of the literature. JSLS. 2017;21(3):e2017.00041. [DOI] [PMC free article] [PubMed] [Google Scholar]
- 10.Takmaz O, Ozbasli E, Gundogan S, et al. Symptoms and health quality after laparoscopic and robotic myomectomy. JSLS. 2018;22(4):e2018.00030. [DOI] [PMC free article] [PubMed] [Google Scholar]
- 11.Gobern JM, Rosemeyer CJ, Barter JF, et al. Comparison of robotic, laparoscopic, and abdominal myomectomy in a community hospital. JSLS. 2013;17(1):116–120. [DOI] [PMC free article] [PubMed] [Google Scholar]
- 12.Patel PR, Lee J, Rodriguez AM, et al. Disparities in use of laparoscopic hysterectomies: a nationwide analysis. J Minim Invasive Gynecol. 2014;21(2):223–227. [DOI] [PMC free article] [PubMed] [Google Scholar]
- 13.Stentz NC, Cooney LG, Sammel MD, et al. Association of patient race with surgical practice and perioperative morbidity after myomectomy. Obstet Gynecol. 2018;132(2):291–297. [DOI] [PubMed] [Google Scholar]
- 14.Smith AJB, Al Ashqar A, Chaves KF, et al. Association of demographic, clinical, and hospital-related factors with use of robotic hysterectomy for benign indications: a national database study. Int J Med Robot. 2020;16(4):e2107. [DOI] [PMC free article] [PubMed] [Google Scholar]
- 15.Khera R, Angraal S, Couch T, et al. Adherence to methodological standards in research using the National Inpatient Sample. JAMA. 2017;318(20):2011–2018. [DOI] [PMC free article] [PubMed] [Google Scholar]
- 16.Houchens Rl RD, A, Jiang J E. Nationwide Inpatient Sample Redesign Final Report. Accessed 3/22/2021. Available at: https://www.hcup-us.ahrq.gov/db/nation/nis/reports/NISRedesignFinalReport040914.pdf.
- 17.Barrett Ml WA, C, Stocks C, Steiner S. CA, Myers ER. Procedures to Treat Benign Uterine Fibroids in Hospital Inpatient and Hospital-Based Ambulatory Surgery Settings, in Healthcare Cost and Utilization Project (HCUP) Statistical Briefs, 2013. Agency for Healthcare Research and Quality. Accessed 9/13/2020. Available at: https://www.hcup-us.ahrq.gov/reports/statbriefs/sb200-Procedures-Treat-Uterine-Fibroids.jsp. [PubMed] [Google Scholar]
- 18.Narla NP, Pardo-Crespo MR, Beebe TJ, et al. Concordance between individual vs. area-level socioeconomic measures in an urban setting. J Health Care Poor Underserved. 2015;26(4):1157–1172. [DOI] [PubMed] [Google Scholar]
- 19.Einarsson JI, Chavan NR, Suzuki Y, et al. Use of bidirectional barbed suture in laparoscopic myomectomy: evaluation of perioperative outcomes, safety, and efficacy. J Minim Invasive Gynecol. 2011;18(1):92–95. [DOI] [PubMed] [Google Scholar]
- 20.Borahay MA, Oge T, Walsh TM, et al. Outcomes of robotic sacrocolpopexy using barbed delayed absorbable sutures. J Minim Invasive Gynecol. 2014;21(3):412–416. [DOI] [PubMed] [Google Scholar]
- 21.Kjerulff KH, Guzinski GM, Langenberg PW, et al. Hysterectomy and race. Obstet Gynecol. 1993;82(5):757–764. [PubMed] [Google Scholar]
- 22.Hakim RB, Benedict MB, Merrick NJ. Quality of care for women undergoing a hysterectomy: effects of insurance and race/ethnicity. Am J Public Health. 2004;94(8):1399–1405. [DOI] [PMC free article] [PubMed] [Google Scholar]
- 23.Smith LH, Waetjen LE, Paik CK, et al. Trends in the safety of inpatient hysterectomy for benign conditions in California, 1991–2004. Obstet Gynecol. 2008;112(3):553–561. [DOI] [PubMed] [Google Scholar]
- 24.Pollack LM, Olsen MA, Gehlert SJ, et al. Racial/ethnic disparities/differences in hysterectomy route in women likely eligible for minimally invasive surgery. J Minim Invasive Gynecol. 2020;27(5):1167–1177e2. [DOI] [PMC free article] [PubMed] [Google Scholar]
- 25.Bougie O, Singh SS, Chen I, et al. Relationship between race/ethnicity and hysterectomy outcomes for benign gynecologic conditions. J Minim Invasive Gynecol. 2019;26(3):456–462. [DOI] [PubMed] [Google Scholar]
- 26.Bureau, U.S.C. American Community Survey 5- Year Estimates Data Profile, 2014. Accessed 3/22/2021. Available at: https://data.census.gov/cedsci/map.
- 27.Ming X, Ran XT, Li N, et al. Risk of recurrence of uterine leiomyomas following laparoscopic myomectomy compared with open myomectomy. Arch Gynecol Obstet. 2020;301(1):235–242. [DOI] [PubMed] [Google Scholar]
- 28.Kotani Y, Tobiume T, Fujishima R, et al. Recurrence of uterine myoma after myomectomy: Open myomectomy versus laparoscopic myomectomy. J Obstet Gynaecol Res. 2018;44(2):298–302. [DOI] [PMC free article] [PubMed] [Google Scholar]
- 29.Alton K, Sullivan S, Udaltsova N, et al. Same-day discharge after minimally invasive myomectomy. Obstet Gynecol. 2016;127(3):539–544. [DOI] [PubMed] [Google Scholar]
- 30.Moawad G, Park D, Maasen M, et al. Predictors of overnight admission After laparoscopic myomectomy in a high-volume minimally invasive gynecologic surgery setting. J Minim Invasive Gynecol. 2020;27(1):195–199. [DOI] [PubMed] [Google Scholar]
- 31.Gunnala V, Setton R, Pereira N, et al. Robot-assisted myomectomy for large uterine myomas: a single center experience. Minim Invasive Surg. 2016;1–5. [DOI] [PMC free article] [PubMed] [Google Scholar]
- 32.Wu CZ, Klebanoff JS, Tyan P, et al. Review of strategies and factors to maximize cost-effectiveness of robotic hysterectomies and myomectomies in benign gynecological disease. J Robot Surg. 2019;13(5):635–642. [DOI] [PubMed] [Google Scholar]
- 33.Behera MA, Likes CE, Judd JP, et al. Cost analysis of abdominal, laparoscopic, and robotic-assisted myomectomies. J Minim Invasive Gynecol. 2012;19(1):52–57. [DOI] [PubMed] [Google Scholar]
- 34.Bogani G, Multinu F, Dowdy SC, et al. Incorporating robotic-assisted surgery for endometrial cancer staging: analysis of morbidity and costs. Gynecol Oncol. 2016;141(2):218–224. [DOI] [PubMed] [Google Scholar]
- 35.Wright JD, Burke WM, Wilde ET, et al. Comparative effectiveness of robotic versus laparoscopic hysterectomy for endometrial cancer. JCO. 2012;30(8):783–791. [DOI] [PMC free article] [PubMed] [Google Scholar]
- 36.Al Ashqar A, Goktepe ME, Kilic GS, et al. Predictors of the cost of hysterectomy for benign indications. J Gynecol Obstet Hum Reprod. 2021;50(2):101936. [DOI] [PMC free article] [PubMed] [Google Scholar]
- 37.Zeybek B, Oge T, Kılıç CH, et al. A financial analysis of operating room charges for robot-assisted gynaecologic surgery: efficiency strategies in the operating room for reducing the costs. J Turk Ger Gynecol Assoc. 2014;15(1):25–29. [DOI] [PMC free article] [PubMed] [Google Scholar]
- 38.Borahay MA, et al. Outpatient robotic hysterectomy: clinical outcomes and financial analysis of initial experience. Int J Med Robot. 2014. [DOI] [PubMed] [Google Scholar]
- 39.Asoglu MR, Achjian T, Akbilgic O, et al. The impact of a simulation-based training lab on outcomes of hysterectomy. J Turkish German Gynecol Assoc. 2016;17(2):60–64. [DOI] [PMC free article] [PubMed] [Google Scholar]
- 40.Borahay MA, Haver MC, Eastham B, et al. Modular comparison of laparoscopic and robotic simulation platforms in residency training: a randomized trial. J Minim Invasive Gynecol. 2013;20(6):871–879. [DOI] [PubMed] [Google Scholar]
- 41.Borahay MA. Assessment of minimally invasive surgical skills of pre-medical students: what can we learn from future learners? J Turkish German Gynecol Assoc. 2014;15(2):69–73. [DOI] [PMC free article] [PubMed] [Google Scholar]
- 42.Oge T, Borahay MA, Achjian T, et al. Impact of current video game playing on robotic simulation skills among medical students. J Turkish German Gynecol Assoc. 2015;16(1):1–4. [DOI] [PMC free article] [PubMed] [Google Scholar]