Figure 1.

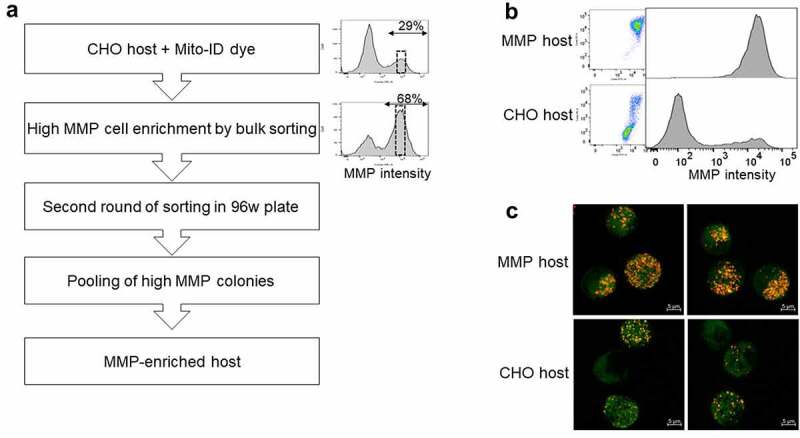
Generation of an MMP-enriched host. (a) Process of enrichment for a high MMP subpopulation using fluorescence-activated cell sorting (FACS). The dotted box in the histogram plots represents the sorted population. (b) Bivariate plots of green (x-axis) versus orange fluorescence (y-axis) and univariate histogram plots of orange fluorescence depicting Mito-ID dye staining pattern of parental CHO and MMP-enriched hosts. (c) Two representative confocal microscopic images for each of Mito-ID dye-stained parental CHO and MMP-enriched hosts. The orange fluorescence in the cells denotes the energized mitochondria. The process of enrichment of high MMP subpopulation with flow cytometry plots and confocal microscopy images of parental CHO and MMP-enriched hosts validating their MMP phenotypes as indicated by low and high intensity of orange fluorescence of Mito-ID dye, respectively.
