Abstract
Background/Aim: The pathogenesis, treatment and prevention of atherosclerosis continue to be the subject of intensive research and study by the scientific community. Based on Fourier-transform infrared spectra and 3D-Doppler echogram, we attempted to develop a computational simulation model for predicting the association of atherosclerotic risk factors with pathogenic molecular structural changes. Materials and Methods: Atheromatic carotid arteries from 56 patients (60-85 years old) were used as samples. Color 3D-Doppler echogram screening was performed on all patients preoperatively. Each infrared spectrum consisted of 120 co-added spectra at a spectral resolution of 4 cm−1. Results: The infrared spectral analysis reveals ‘marker bands’, such as the 1,744 cm−1 band assigned to aldehyde formation and to the ‘fingerprint’ digital spectral region of 1,050-1,169 cm−1, characteristic of the presence of advanced glycation end products (C-O-C). The accumulation of calcium phosphate salts increases the formation rate of stenosis. The critical point of stenosis risk starts at about 45%, while when stenosis is over 60-70%, the risk of ischemic stroke or other major adverse cardiovascular events increases dramatically. Conclusion: Fourier-transform infrared spectroscopy and mathematical simulation models showed that carotid artery stenosis over 45% reduces the blood flow rate, while stenosis over 65% dramatically increases the hemodynamic disturbance, with a parallel increase the rate of ischemic stroke or other major adverse cardiovascular events.
Keywords: FT-IR spectroscopy, carotid atherosclerosis, 3D-Doppler echogram, mathematical simulations, blood flow
Atherosclerosis is a multifactorial disease with very serious consequences for various organ systems, with high morbidity and mortality (1-3), while it tends to affect more than one arterial complex in many patients. The pathogenesis and treatment of atherosclerosis, as well as its prevention, have been and continue to be the subject of intensive research and study by the scientific community. Atherosclerosis is the most common cause of death in men over the age of 45 years and women over the age of 65 years in the Western world and this is more problematic since the pathogenic causes have not yet been completely clarified, moreover, the disease remains asymptomatic for decades (4). The appearance of clinical symptoms often highlights an irreversible stage of the disease. Atherosclerosis is characterized by the presence of specific lesions, which appear as asymmetrically localized thickenings of the inner layer of the arterial walls of medium and large arteries (1-5). The lesions consist of various cell types, connective tissue components, lipids and residual cell degradation products (debris). At the early stages of the disease, fatty lines develop in the areas of accumulation of fat droplets and inflammatory cells. The predominant components of fat lines are ‘foam cells’, which are macrophages that have accumulated large amounts of fat inside them. Other components of fatty lines are T-lymphocytes, dendritic cells and basophils (5). Fatty lines appear at a young age and either disappear over time or develop into more advanced lesions (atherosclerotic plaques or atheromas). However, non-invasive imaging methods, such as computed tomography and Doppler ultrasound, which are used widely in clinical practice to detect the progression of stenosis, are not able to visualize the composition of the atheromatic plaques at the molecular scale.
Infrared spectroscopy, especially attenuated total reflectance Fourier-transform infrared (ATR-FT-IR) spectroscopy offers a new potential in clinical practice to identify atheromatic plaques, with emphasis on aggregates, amyloid protein formations and calcium carbonate or phosphate deposits. ATR-FT-IR spectroscopy is a simple, fast and a non-destructive technique which requires small amounts of sample (micrograms or microliters), without any preparation of the sample and can be applied in medicine (6-11). IR spectroscopy has been shown to be a very sensitive method for evaluating the secondary protein structure of human tissues and other components, including DNA, lipids and phospholipids, all in a single spectrum (12-15). IR spectroscopic analysis provides characteristic ‘fingerprint region bands’ or ‘marker bands’ of the tissue of each patient and can differentiate normal from malignant tissues, as well as progression of disease, and can also characterize deposits at the very early stages of the disease (7-11).
In the present work, we combined 3D-Doppler echogram, scanning electron microscopy (SEM) and FT-IR spectral data in order to develop a multilevel computational simulation model for predicting the association of atherosclerotic risk factors with pathogenic molecular structural changes of vessel walls and coexisting hemodynamic disturbances.
Materials and Methods
Study material. Atheromas of carotid arteries from 56 patients (60-85 years old) who underwent carotid endarterectomy were used for ex vivo analysis. Color 3D-Doppler echogram screening (15 MHz Matrix head; General Electric) was performed on all patients preoperatively. For the mathematical calculations, we included the 3D-Doppler echograms of patients with 18% to 95% stenosis. The samples were collected according to the Greek ethical rules for ex vivo research. The samples were immediately fixed postoperatively in buffered formaldehyde solution. This method did not show any effects on the IR spectra. The samples were not fixed in paraffin, since we have noticed that in subsequent removal of the paraffin, the organic solvent removes important soluble components of atheromatic plaques.
FT-IR spectroscopy. FT-IR spectra were recorded with a Nicolet 6700 Thermoscientific spectrometer, equipped with an ATR accessory, USA. The spectra were taken from three different sections per patient at different positions in each sample (mapping), in order to visualize the changes which were induced by the disease. Each spectrum consisted of 120 co-added spectra at a spectral resolution of 4 cm−1. The included in the apparatus OMNIC 7.2a software was used for data analysis. Each IR spectrum was compared to the corresponding IR spectra of all the other patients, taking into account the clinical history, as well as the risk factors (1-4).
SEM. The Quanta 200 SEM instrument was from FEI Europe B.V., Eindhoven, the Netherlands and was used for determining the architecture of the carotid artery. The SEM was combined with energy dispersive X-ray (EDX) apparatus for the analysis of chemical elemental composition in different sites of the aortic valves and tissues. There was no coating of the samples with carbon or gold.
Mathematical computational model. Mathematical simulation was based on ultrasound data and boundary conditions from 3D-Doppler echogram blood flow rate and pressure at the minimum and maximum point measurements at the common carotid artery. According to this model, it is possible to take into account the non-homogenous geometry of the artery and the role of the midpoint on the blood flow rate. The blood flow is considered one-dimensional, unsteady and laminar, and the governing equation was solved numerically using MATLAB, Version 2021a (Math Works, Inc., Natick, MA, USA).
Results and Discussion
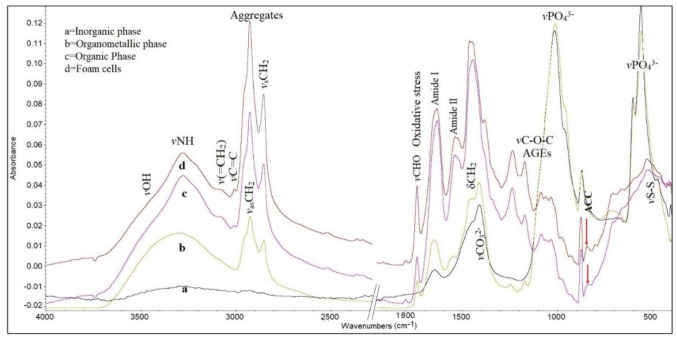
FT-IR spectral analysis and data. Figure 1 shows representative FT-IR spectra from characteristic regions of a non-homogeneous carotid atheromatic plaque in the spectral region 4,000-500 cm−1.
Figure 1. Representative Fourier-transform infrared spectra of a carotid atheromatic plaque. Spectrum a represents parts from a region rich in inorganic phase (calcified region). Spectrum b originates from the interfacial organometallic phase (calcium ions binding to organic molecules). Spectrum c shows the organic phase/inner membrane. Spectrum d corresponds to foam cells. Comparison between the spectra shows considerable differences in band absorption intensities, widths and shifts in all infrared spectral regions. AGEs: Advanced glycation end products; ACC: amorphous calcium carbonate.
In the infrared spectral region between 4,000-3,000 cm−1, the characteristic stretching vibrational modes of the stretching vibration of vNH groups derive mostly from proteins and the stretching vibrations of OH groups of organic molecules and from water molecules of the cells (11-14). It is observed that in the spectra originating from the inorganic phase, this band is almost absent, as expected, since the sample was not rich in organic components which contain these groups. In the spectra of the organometallic phase, the band of vNH modes becomes broad and shifts to higher wave numbers due to the fact that the plaque contained a higher number of terminal -NH groups, as a result of protein fragmentation (7-11).
In the spectra of organometallic and foam cells, a broad band was visible at about 3,527 cm−1 and is assigned to stretching vibration of vOH groups of water, together with other overlapping hydrogen bonded bands of vOH groups (12-14). These hydroxyl groups are assigned to hydroxyls of the hydroperoxidation of lipids and to proteins and glycosides (9).
The weak band at about 3,080 cm−1 indicates that the proteins had changed their conformation to amide B configuration (16,17). This means that the effect of the NH group of the peptide bond -NHCO- is stronger than that of C=O, unlike amide A, where the effect of C=O is stronger, suggesting different hydrogen bonds in length and strength that hold the protein strands together. We have noticed that this band is sensitive and very important for the characterization of the progression of this disease (18). The band at 3,060 cm−1 was assigned to stretching vibrations of the terminal olefinic v=CH mode, confirming the implication of oxidative stress during disease development. This band’s intensity was previously found to be proportional to levels of low-density lipoprotein cholesterol in the blood of patients (11).
In the important region 3,000-2,850 cm−1 are located the absorption bands of antisymmetric and symmetric stretching vibrations of methyl (vCH3) and methylene (vCH2) groups of membrane lipids and phospholipids. In the spectra of foam cells (Figure 1D) the intensity of absorption bands of the vasCH2 (2,921 cm−1) and vsCH2 (2,853 cm−1) increases, indicating changes of the flexibility and permeability of membranes. It seems that upon foam cell accumulation and disease development, the membrane environment becomes more lipophilic and rigid, and the carbon-carbon chains have a higher crystalline order (7-11).
The marker band at about 1,744 cm−1, which is attributed to malondialdehyde vCHO vibrational mode, is associated with peroxidation and degradation of lipids and phospholipids of membranes and proteins (7-11). This band reflects the progression of the disease and indicates inflammation upon development of the disease (18). The intensity of this band was increased considerably in the spectra of the organic phase and more distinctly in the region of the foam cells (Figure 1, spectra c and d). A further increase of the intensity of the band at 1,744 cm−1 was observed in patients with elevated serum glucose levels. The production of aldehydes in carotid and coronary atheromatic plaques was also found irrespective of plaque thickness, calculated by computed tomography or ultrasound. The alteration of the intensity was related to low-density lipoprotein cholesterol, most likely, aldehyde promoted membrane damage and inflammation. Our findings are in agreement with literature data from animal models where the formation of malondialdehyde-like material was observed during ischemia/reoxygenation (19). Recent studies showed increasing serum malondialdehyde levels during the first week of ischemic stroke (20).
The intense band at 1,650 cm−1 was assigned to amide I of the peptide bond (-NHCO-), being typical of α-helix (15-17). As the disease progresses, this band decreases in intensity, broadens and shifts to lower wave numbers at 1,633 cm−1, which is in agreement with the patients’ clinical history. Deconvolution analysis of this band showed three distinct bands at 1,691 cm−1, 1,652 cm−1 and 1,625 cm−1 corresponding to antiparallel β-sheet, α-helix and parallel β-sheet (8-10). These bands were used in order to study protein structural disorders and amyloid protein formation. The detected β-sheets in combination with the higher lipophilicity of the environment resulted from the increase in the intensity of stretching vibration bands of vCH2 frequencies, confirming the oxidation of membranes and protein formation, which lead to disease progression. These changes are more distinct in foam cells. Comparison between the clinical data and spectra of the patients showed that the amide II band broadens upon the progression of the disease and its deconvolution analysis showed three bands at 1,550 cm−1, 1,540 cm−1 and 1,514 cm−1, indicating amyloid protein formation. These bands are very characteristic and are observed in many diseases related to oxidative stress (21). It was also observed that these bands were related to the degree of stenosis and other clinical characteristics of the patients.
Another prominent band is between 1,500 cm−1 and 1,400 cm−1. In this spectral region, characteristic symmetric and antisymmetric vibration bands of carbonate anions vCO32− are located, arising from calcium carbonate salts of atheromatic plaques (22). Comparison between all the spectra showed considerable differences in shape and shifts of the bands in the spectra of foam cells, as shown in Figure 1 (spectrum d). The observed characteristic shape and split of the asymmetric stretching vibration band of carbonate anions v3CO32− at about 1,470 and 1,416 cm−1 is related to the formation of amorphous calcium carbonate (ACC) (23,24). These bands, in combination with the two bending bands at about 874 cm−1 and 840 cm−1, are indicated by an arrow in the spectral region of foam cells and the region rich in organic phase (Figure 1, spectra c and d), which confirms the production of ACC. On the contrary, in the rich inorganic mineral deposit regions of atheromatic plaques, different forms of calcium carbonates, calcite and aragonite are predominant, as is apparent from the absence of an absorption bending band of CaCO3 at 840 cm−1 (25). Although ACC is extremely thermodynamically unstable under normal conditions, in biological systems, macromolecules, such as membranes and glycosylation products, stabilize the amorphous form by incorporating magnesium ions (Mg2+) or silica (26-28).
The fingerprint spectral region between 1,300 cm−1 and 800 cm−1 gives important information about the stretching vibration of glycosylic bond v-O-C-O- resulting from sugar rings and sugar-phosphates, as well as the stretching vibrations of phosphates resulting from phospholipids (vPO2−) and phosphate salts (vPO43−), which arise from atheromatic plaques. In the spectral region of foam cells and inorganic-rich phase (Figure 1), the bands of stretching vibrations of v-O-C-O- are predominant. In particular, the band at about 1,170 cm−1 is related to advanced glycation end products (AGEs) (9) and is more noticeable in diabetic and hyperuricaemic patients (29). This band can be used as a marker band for the progression of carotid artery disease. It is also suggested that the increasing of AGEs produces a high number of -OH groups of sugars and N-linked saccharides, which can interact with metal ions, such as calcium and magnesium, and hydrogen bonds, leading to sclerosis and formation of atheromatic plaques. We also observed shape and shift changes of the absorption band at 1,170 cm−1 concerning the formation of glycation products upon cancer progression (7-9), indicating that oxidative stress is a common pathway for both cancer and atherosclerosis development. This hypothesis is supported by a recent study where the authors showed that there was a higher cancer risk in diabetic patients with increased atherosclerosis burden (30,31).
The sharp bands in regions 1,100-900 cm−1 and 650-500 cm−1 arise from calcium phosphate salts, while the shape and the shift of the bands show the interaction between them. From the FT-IR spectra in association with X-ray diffraction analysis (not shown), it is proposed that inorganic hydroxyapatites, CaHPO4, hydrated Ca3(PO4)2.xH2O and amorphous calcium phosphate Ca3(PO4)2 are formed. In addition, calcium phosphate salts increase the pH of the carotid environment, leading to destabilization of the amorphous phase and thus increasing the crystallinity of the plaque (25-28).
The appearance of the characteristic stretching vibration of vS-S mode at 522 cm−1 is the result of oxidization of endogenous thiols (mostly glutathione) by hydroxyl free radicals produced by Haber-Weiss or Fenton-catalyzed reactions. This band further confirms the involvement of oxidative stress in atherosclerosis development (32). Furthermore, it was observed that nicotinamide adenine-dinucleotide phosphate, NADPH, which is required to reduce the level of oxidized glutathione, is also reduced in metabolic diseases, aging and oxidative stress (33). The reduction of endogenous defense molecules, such as thiols and superoxide dismutase, promotes fibrosis (33).
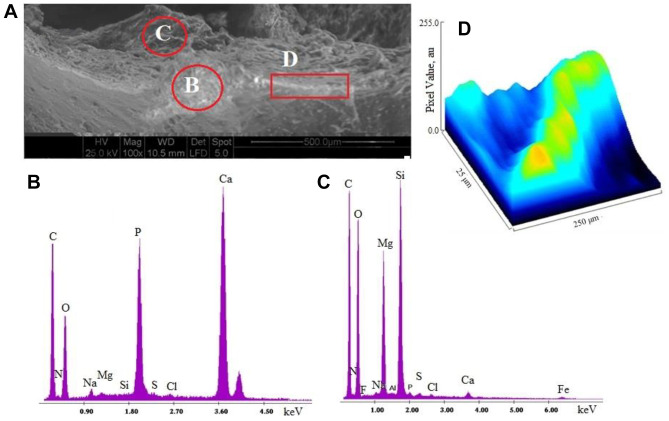
SEM-EDX analysis. In order to determine if an increase of lipophilic environment and amyloid proteins alter the formation of atheromatic plaque, we used SEM-EDX microscopy to study the morphology and the heterogeneous architecture of atheromatic carotid plaques. Figure 2A shows the morphology of a carotid atheromatic plaque, which is rich in fibrils, in the dark and white regions. EDX elementary analysis (Figure 2B and 2C) showed that the inorganic region of atheromatic plaque contained phosphorous and calcium at higher concentrations, while the foam cells were found to be rich in magnesium and silica, confirming the formation of calcium phosphate and magnesium carbonate salts. The detection of magnesium confirms the production and stabilization of ACC production in the region of foam cells (25-28). Analysis of the linear mineralized region D showed a well-defined preferential sequential sites of calcification. ImageJ analysis (Figure 2D) illustrated this high conductivity area, represented as hills (with yellow color) which correspond to calcium deposits. Furthermore, imageJ showed that the mineralized fiber formed had a helical shape, which corresponds to a protein structure. These findings lead to the suggestion that amino acids containing carboxylic (COO−) groups seem to play a role in the initiation of calcification, since the positively charged metal ions (Ca2+) require a negative polar environment to form metal ionic salts. Our results are in agreement with literature data, where the protein content in the ACC phase was found to be more increased than the calcite content (27). On the other hand, the grooved blue region confirmed the presence of lesions of connective tissues.
Figure 2. A: Morphology of a representative carotid atheromatic plaque by scanning electron microscopy (100×, scale=500 μm). B: Elementary analysis of region B shown in A, rich in inorganic deposits. C: Elementary analysis of region C shown in A, rich in foam cells. D: ImageJ analysis of the linear calcified region D shown in A.
From all the above it seems that magnesium, a calcium antagonist, may substitute for calcium ions on hydroxyapatite, producing more soluble magnesium phosphate salts that inhibit bone formation and perhaps carotid artery stenosis. However, Iseri and French described that Mg2+ inhibited the release of Ca2+ ions from the sarcoplasmic reticulum and blocked the influx of Ca2+ into cells by inactivating Ca-channels in the cell membrane (34). Similar results were found in aortic valve calcification (35).
Computational simulations. A mathematical computation model, based on fluid dynamics, is a powerful tool for confirming or challenging experimental data and for simulating the effect of stenosis in extremely complex systems, such as the carotid artery. Hemodynamical factors affect blood flow and atherosclerotic plaques cause the carotid artery to be narrow.
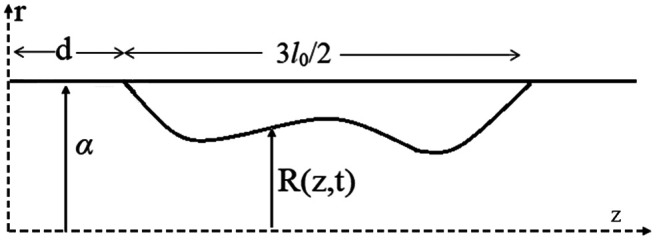
In Figure 3, the carotid artery is simulated as a cylindrical tube, where the blood flows through local wall stenosis. The flow through the cylinder is assumed to be unsteady, axisymmetric, laminar, one-dimensional and fully developed. Figure 3 illustrates the cylindrical artery together with the time-dependent overlapping stenosis. Cylindrical coordinates are used for the description, with z representing the coordinate taken along the axis of the cylinder, and r that for the radial axis (36). The radius of the stenosed region R(z,t) of the artery is given by Equation 1:
Figure 3. The geometry of the stenosed part of a carotid artery visualized as a cylindrical tube across the axis z with radial coordinates r. The disordered curve presents an arbitrary stenosed region 3lo/2, with α being the constant radius of the normal artery, d the non-stenosed part of the artery and R(z,t) is the radius of the stenosed region at real time t.
 (Eq 1)
for  , outside these limits the ratio R(z,t)/α=1, where α is the constant radius in the normal artery (non-stenosed)
  , is the length of the stenosis, d is the location of the stenosis and
  is a function of time (t) in a given period of time T.
The governing equation which describes our model is Equation 2:
 (Eq 2)
where P is the pressure which the blood exerts on the walls of the artery, ρ is the density, μ is the kinematic viscosity, while w(r,z,t) is the component of the blood flow velocity in the axial direction.
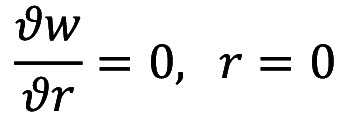
Under the assumption at the beginning of the axis, where there is no shear rate of the fluid along the axis, the velocity gradient is obtained as follows:
In addition, on the arterial wall, the velocity is given as:
w=0, r=R(z,t)
Since there is nonzero velocity of the blood, then the system at rest has the following values:
w=w0 t=0
In order to simplify the system, we introduce a new radial coordinate using Equation 3:
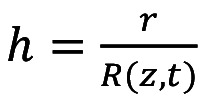 (Eq 3)
By using the new radial coordinate and Laplace transforms our governing equation takes the form of Equation 4:
 (Eq 4)
Where μ is the viscosity of blood.
The boundary conditions in the Laplace space are described as:
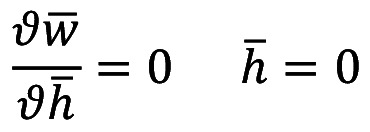

In order to approach the in vivo conditions, we considered the pressure totally independent and uniform along the cross section.
Pressure values derived from hemodynamic data were obtained from the 3D-Doppler echogram from all patients (Figure 4, inset) and applied at the points of the minimum end-diastolic and maximum peak systolic pressures of the stenosed carotid artery, were used to numerically solve the above equations, with the aid of the MATLAB pdepe routine. For the purpose of the calculations, the following data were used: l0=20 mm, d=0.2 mm, α=0.5 mm and μ=0.2 Poise.
Figure 4. Computational simulation of blood flow (cm3/s) reduction over time between maximum systolic and maximum diastolic velocity is a function of atherosclerotic carotid artery stenosis. The inset shows an exemplary 3D-Doppler echogram from a patient with stenosis of 95% and peak systolic rate=441.5 cm/s, end-diastolic rate=69.8 cm/s. The curves show that after stenosis of between 73% to 95% there is no linear association with blood flow, increasing the risk of ischemic stroke event or death.
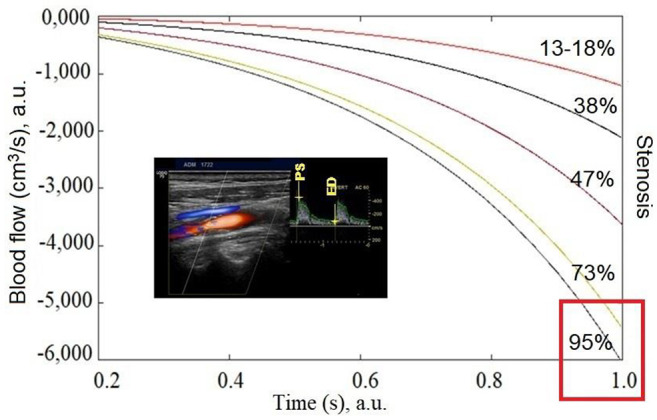
Three integration points were used in both the axial and the radial directions. As a result, a series of curves were constructed (Figure 4). Thus, in this Figure, the reduction of blood flow (cm3/s) with time, can be seen as a result of arterial stenosis realized through reduced pressure values. According to our model, it becomes clear that after about 65% stenosis, the risk for stroke or death increases rapidly.
In order to understand and analyze further the mathematical simulation model as a clinical effect, the above curves were used to plot the blood flow rate as a function of the degree of carotid artery stenosis (Figure 5). As can be seen from the Figure, when stenosis increases, the hemodynamic blood flow rate decreases. This means that the stenosed arteries do not receive enough blood to function properly.
Figure 5. Relationship between blood flow (cm−3/s) and carotid artery stenosis. The curve is associated with ischemic stroke risk. The starting point of stroke risk for some patients is between 45% and 60% stenosis, while after 60%, the risk of ischemic stroke increases dramatically.
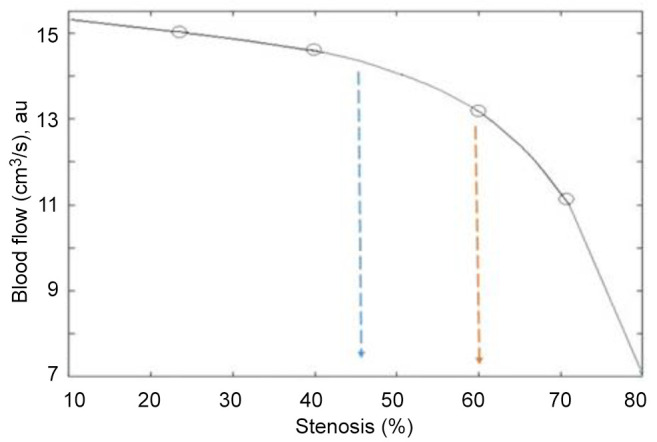
From our results it is clear that development of stenosis from 45% to 60% reduces blood flow, leading to a strong positive association with increased risk for transient ischemic attack or stroke. The risk in this case depends on other clinical factors of the patients, such as fat, mineral deposits, diabetes, hyperuricaemia, obesity and smoking. These factors affect the shape and plaque surface, symptomatic lesions and irregularity of the edges of the artery walls (morphology of the plaque surface), as detected on 3D-echograms. For stenosis over 70%, the hemodynamic disturbance decreases dramatically, reflecting a further increase in risk of developing ischemic attack. The phenomenon is associated with highly reduced cerebral perfusion.
The above results are in agreement with clinical data where it was found that patients with over 70% carotid stenosis are at a particularly high risk of ischemic stroke (3,37). Our simulation model, in combination with FT-IR and SEM data, also provides the starting point of calcium salt crystallization, which plays a crucial role in stenosis, since mineral and lipid deposits affect arterial stiffness.
Conclusion
Based on the results obtained from FT-IR spectra, the observed intensity increase of vas,sCH2 at 3,000-2,850 cm−1 in combination with the highly intense band at 1,744 cm−1 is attributed to aldehyde formation as result of lipid and protein peroxidation, especially in foam cells. The spectral range of 1,050-1,169 cm−1 is due to the absorption by AGEs. In addition, the formation of amorphous CaCO3 in the presence of Mg2+ ions, particularly in highly oxidized lipid regions inhibits stenosis of the carotid arteries. Excessive Ca2+ efflux promotes crystallization of CaCO3 (1,450 cm−1) and Ca3(PO4)2 deposits (1,080-900 cm−1), leading to development of atheromatic plaque and stenosis. Increasing amounts of AGEs, which contain many binding sites for metal ions enabling calcium mineral deposition, increases the hemodynamic disturbance, which leads to atheromatic plaque formation and stenosis. From the clinical history of the patients and SEM surface analysis of the endarterectomy products, it was found that the atheromatic plaque components produced affect plaque instability and wall stiffness, which might lead to thrombosis and finally to transient ischemia or ischemic stroke. The description of blood flow as being one-dimensional, unsteady and laminar in the fully developed model was shown to correctly represent the flow through a stenosed artery as compared with experimental results. The mathematical simulation model showed that carotid artery stenosis over 45% reduces the blood flow rate, while stenosis over 65% dramatically increases hemodynamic disturbance, with parallel increase of the rate of ischemic stroke or other major adverse cardiovascular events.
Conflicts of Interest
No conflicts.
Authors’ Contributions
Ioannis Mamarelis, Emmanuil Koutoulakis, and Christophoros Kotoula were responsible for the patients and interpretation of clinical data. Panagiota Kolovou, performed the 3D-Doppler echograms. Vasiliki Mamareli, Christina Mamareli and Sotiris Kotoulas prepared the samples and recorded the FT-IR spectra and performed the SEM analysis. Evangelos Mylonas developed the mathematical simulation models. Konstantinos Spiliopoulos evaluated and carried out the interpretation of mathematical equation models. Theophile Theophanides and Jane Anastassopoulou were responsible for the editing, interpretation of the spectra and assignment of the infrared bands.
References
- 1.Libby P, Buring JE, Badimon L, Hansson GK, Deanfield J, Bittencourt MS, Tokgözoğlu L, Lewis EF. Atherosclerosis. Nat Rev Dis Primers. 2019;5(1):56. doi: 10.1038/s41572-019-0106-z. [DOI] [PubMed] [Google Scholar]
- 2.Basatemur GL, Jørgensen HF, Clarke MCH, Bennett MR, Mallat Z. Vascular smooth muscle cells in atherosclerosis. Nat Rev Cardiol. 2019;16(12):727–744. doi: 10.1038/s41569-019-0227-9. [DOI] [PubMed] [Google Scholar]
- 3.Ntaios G, Sagris D, Strambo D, Perlepe K, Sirimarco G, Georgiopoulos G, Nannoni S, Korompoki E, Manios E, Makaritsis K, Vemmos K, Michel P. Carotid atherosclerosis and patent foramen ovale in embolic stroke of undetermined source. J Stroke Cerebrovasc Dis. 2021;30(1):105409. doi: 10.1016/j.jstrokecerebrovasdis.2020.105409. [DOI] [PubMed] [Google Scholar]
- 4.Herrington W, Lacey B, Sherliker P, Armitage J, Lewington S. Epidemiology of atherosclerosis and the potential to reduce the global burden of atherothrombotic disease. Circ Res. 2016;118(4):535–546. doi: 10.1161/CIRCRESAHA.115.307611. [DOI] [PubMed] [Google Scholar]
- 5.Douna H, Amersfoort J, Schaftenaar FH, Kröner MJ, Kiss MG, Slütter B, Depuydt MAC, Bernabé Kleijn MNA, Wezel A, Smeets HJ, Yagita H, Binder CJ, Bot I, van Puijvelde GHM, Kuiper J, Foks AC. B- and T-lymphocyte attenuator stimulation protects against atherosclerosis by regulating follicular B cells. Cardiovasc Res. 2020;116(2):295–305. doi: 10.1093/cvr/cvz129. [DOI] [PubMed] [Google Scholar]
- 6.Balan V, Mihai CT, Cojocaru FD, Uritu CM, Dodi G, Botezat D, Gardikiotis I. Vibrational spectroscopy fingerprinting in medicine: from molecular to clinical practice. Materials (Basel) 2019;12(18):2884. doi: 10.3390/ma12182884. [DOI] [PMC free article] [PubMed] [Google Scholar]
- 7.Kyriakidou M, Mavrogenis AF, Kyriazis S, Markouizou A, Theophanides T, Anastassopoulou J. An FT-IR spectral analysis of the effects of γ-radiation on normal and cancerous cartilage. In Vivo. 2016;30(5):599–604. [PubMed] [Google Scholar]
- 8.Anastassopoulou J, Kyriakidou M, Malesiou E, Rallis M, Theophanides T. Infrared and raman spectroscopic studies of molecular disorders in skin cancer. In Vivo. 2019;33(2):567–572. doi: 10.21873/invivo.11512. [DOI] [PMC free article] [PubMed] [Google Scholar]
- 9.Anastassopoulou J, Kyriakidou M, Papatheodorou G, Rallis M, Theophanides T. The environmental effects of lead concentrations on protein and DNA structure in epileptic patients from an infrared spectroscopic study. J Basic Appl Sci. 2019;15:56–63. doi: 10.29169/1927-5129.2019.15.07. [DOI] [Google Scholar]
- 10.Kotoulas C, Mamarelis I, Koutoulakis E, Kyriakidou M, Mamareli V, Tanis O, Malesiou E, Theophanides T, Anastassopoulou J. The influence of diabetes on atherosclerosis and amyloid fibril formation of coronary arteries. A FT-IR spectroscopic study. Hell J Atheroscler. 2017;8:15–29. [Google Scholar]
- 11.Mamarelis I, Pissaridi K, Dritsa V, Kotileas P, Tsiligiris V, Tzilalis V, Anastassopoulou J. Oxidative stress and atherogenesis. An FT-IR spectroscopic study. In Vivo. 2010;24(6):883–888. [PubMed] [Google Scholar]
- 12.Theophanides T. Infrared spectroscopy-life and biomedical science. IntechOpen. 2012 doi: 10.5772/2655. [DOI] [Google Scholar]
- 13.Theophanides T. Infrared spectroscopy-anharmonicity of biomolecules, crosslinking of biopolymers, food quality and medical applications. IntechOpen. 2015 doi: 10.5772/58483. [DOI] [Google Scholar]
- 14.Theophanides T. Material science, engineering and technology. IntechOpen. 2012 doi: 10.5772/2055. [DOI] [Google Scholar]
- 15.Mamareli V, Tanis O, Kyriakidou M, Mamarelis I, Anastassopoulou J, Koutoulakis E, Kotoulas C. Oxidative damage of carotid arteries in diabetic patients. Biomedical J Sci Tech Res. 2018;3(3) doi: 10.26717/BJSTR.2018.03.000901. [DOI] [Google Scholar]
- 16.Barth A. Infrared spectroscopy of proteins. Biochim Biophys Acta. 2007;1767(9):1073–1101. doi: 10.1016/j.bbabio.2007.06.004. [DOI] [PubMed] [Google Scholar]
- 17.Barth A, Zscherp C. What vibrations tell us about proteins. Q Rev Biophys. 2002;35(4):369–430. doi: 10.1017/s0033583502003815. [DOI] [PubMed] [Google Scholar]
- 18.Anastassopoulou J, Kyriakidou M, Kyriazis S, Mavrogenis AF, Mamareli V, Mamarelis I, Petra M, Malesiou E, Kotoulas C, Kolovou P, Koutoulakis E, Markouizou A, Theophanides T. Oxidative stress in ageing and disease development studied by FT-IR spectroscopy. Mech Ageing Dev. 2018;172:107–114. doi: 10.1016/j.mad.2017.11.009. [DOI] [PubMed] [Google Scholar]
- 19.Salaris SC, Babbs CF. Effect of oxygen concentration on the formation of malondialdehyde-like material in a model of tissue ischemia and reoxygenation. Free Radic Biol Med. 1989;7(6):603–609. doi: 10.1016/0891-5849(89)90141-x. [DOI] [PubMed] [Google Scholar]
- 20.Lorente L, Martín MM, Abreu-González P, Sabatel R, Ramos L, Argueso M, Solé-Violán J, Cáceres JJ, Jiménez A, García-Marín V. Non-survivor patients with malignant middle cerebral artery infarction showed persistently high serum malondialdehyde levels. BMC Neurol. 2019;19(1):238. doi: 10.1186/s12883-019-1479-z. [DOI] [PMC free article] [PubMed] [Google Scholar]
- 21.Mamarelis I, Koutoulakis E, Kotoulas C, Dritsa V, Mammareli V, Pissaridi K, Kyriakidou M, Anastassopoulou J. Amyloid like formation and aortic valve calcification promoted by oxidative stress. Hell J Atherosclerosis. 2016;7(2):84–96. [Google Scholar]
- 22.Petra M, Anastassopoulou J, Theologis T, Theophanides T. Synchrotron micro-FT-IR spectroscopic evaluation of normal paediatric human bone. Journal of Molecular Structure. 2019;733(1-3):101–110. doi: 10.1016/j.molstruc.2004.07.041. [DOI] [Google Scholar]
- 23.Weiner S, Levi-Kalisman Y, Raz S, Addadi L. Biologically formed amorphous calcium carbonate. Connect Tissue Res. 2003;44 Suppl 1:214–218. [PubMed] [Google Scholar]
- 24.Aizenberg J, Lambert G, Weiner S, Addadi L. Factors involved in the formation of amorphous and crystalline calcium carbonate: a study of an ascidian skeleton. J Am Chem Soc. 2002;124(1):32–39. doi: 10.1021/ja016990l. [DOI] [PubMed] [Google Scholar]
- 25.Theophanides T, Anastassopoulou J, Lazzarini L, Dritsa V, Papandreopoulos P, Koui M. The study of Pentelic marble in pure form and in polluted monuments by Fourier transform infrared spectroscopy. 10th International Symposium on the Conservation of Monuments in the Mediterranean. 2019;Basin:331–338. doi: 10.1007/978-3-319-78093-1_35. [DOI] [Google Scholar]
- 26.Beniash E, Aizenberg J, Addadi L, Weiner S. Amorphous calcium carbonate transforms into calcite during sea urchin larval spicule growth. Proceedings of the Royal Society of London. Series B: Biological Sciences. 2021;264(1380):461–465. doi: 10.1098/Rspb.1997.0066. [DOI] [Google Scholar]
- 27.Cartwright J, Checa A, Gale J, Gebauer D, Sainz-Díaz C. Calcium carbonate polyamorphism and its role in biomineralization: How many amorphous calcium carbonates are there. Angewandte Chemie International Edition. 2021;51(48):11960–11970. doi: 10.1002/anie.201203125. [DOI] [PubMed] [Google Scholar]
- 28.Loste E, Wilson R, Seshadri R, Meldrum F. The role of magnesium in stabilising amorphous calcium carbonate and controlling calcite morphologies. Journal of Crystal Growth. 2019;254(1-2):206–218. doi: 10.1016/S0022-0248(03)01153-9. [DOI] [Google Scholar]
- 29.Mamareli V, Tanis O, Anastassopoulou J, Kyriakidou M, Mamareli Ch, Koui M, Theophanides T, Mamarelis I. The role of oxidative stress on molybdenum enzymes and ischemic reperfusion injury in hyperuricaemic patients. An infrared spectroscopic study. Eur J Mol Clin Med. 2019;6(1):20–25. [Google Scholar]
- 30.Rizza S, Rossini V, Cardellini M, Luzi A, Longo S, Piciucchi G, Coppeta L, Federici M. Diabetes influences cancer risk in patients with increased carotid atherosclerosis burden. Nutr Metab Cardiovasc Dis. 2020;30(4):652–655. doi: 10.1016/j.numecd.2019.11.016. [DOI] [PubMed] [Google Scholar]
- 31.Mohanty JG, Nagababu E, Rifkind JM. Red blood cell oxidative stress impairs oxygen delivery and induces red blood cell aging. Front Physiol. 2014;5:84. doi: 10.3389/fphys.2014.00084. [DOI] [PMC free article] [PubMed] [Google Scholar]
- 32.Kilanczyk E, Saraswat Ohri S, Whittemore SR, Hetman M. Antioxidant protection of NADPH-depleted oligodendrocyte precursor cells is dependent on supply of reduced glutathione. ASN Neuro. 2016;8(4):1759091416660404. doi: 10.1177/1759091416660404. [DOI] [PMC free article] [PubMed] [Google Scholar]
- 33.Shen J, Rastogi R, Geng X, Ding Y. Nicotinamide adenine dinucleotide phosphate oxidase activation and neuronal death after ischemic stroke. Neural Regen Res. 2019;14(6):948–953. doi: 10.4103/1673-5374.250568. [DOI] [PMC free article] [PubMed] [Google Scholar]
- 34.Iseri L, French J. Magnesium: Nature’s physiologic calcium blocker. American Heart Journal. 2021;108(1):188–193. doi: 10.1016/0002-8703(84)90572-6. [DOI] [PubMed] [Google Scholar]
- 35.Dritsa V, Pissaridi K, Koutoulakis E, Mamarelis I, Kotoulas C, Anastassopoulou J. An infrared spectroscopic study of aortic valve. A possible mechanism of calcification and the role of magnesium salts. In Vivo. 2014;28(1):91–98. [PubMed] [Google Scholar]
- 36.Chakravarty S, Mandal P. Mathematical modelling of blood flow through an overlapping arterial stenosis. Mathematical and Computer Modelling. 2019;19(1):59–70. doi: 10.1016/0895-7177(94)90116-3. [DOI] [Google Scholar]
- 37.Rothwell PM, Gibson R, Warlow CP. Interrelation between plaque surface morphology and degree of stenosis on carotid angiograms and the risk of ischemic stroke in patients with symptomatic carotid stenosis. On behalf of the European Carotid Surgery Trialists’ Collaborative Group. Stroke. 2000;31(3):615–621. doi: 10.1161/01.str.31.3.615. [DOI] [PubMed] [Google Scholar]


