

Abstract
Background:
There is a growing need for information regarding the recent coronavirus disease of 2019 (COVID-19). We present a comprehensive report of COVID-19 patients in Iran.
Materials and Methods:
One hundred hospitalized patients with COVID-19 were studied. Data on potential source of exposure, demographic, clinical, and paraclinical features, therapy outcome, and postdischarge follow-up were analyzed.
Results:
The median age of the patients was 58 years, and the majority of the patients (72.7%) were above 50 years of age. Fever was present in 45.2% of the patients on admission. The most common clinical symptoms were shortness of breath (74%) and cough (68%). Most patients had elevated C-reactive protein (92.3%), elevated erythrocyte sedimentation rate (82.9%), and lymphocytopenia (74.2%) on admission. Lower lobes of the lung were most commonly involved, and ground-glass opacity (81.8%) was the most frequent finding in computed tomography scans. The administration of hydroxychloroquine improved the clinical outcome of the patients. Lopinavir/ritonavir was efficacious at younger ages. Of the 70 discharged patients, 40% had symptom aggravation, 8.6% were readmitted to the hospital, and three patients (4.3%) died.
Conclusion:
This report demonstrates a heterogeneous nature of clinical manifestations in patients affected with COVID19. The most common presenting symptoms are nonspecific, so attention should be made on broader testing, especially in age groups with the greatest risk and younger individuals who can serve as carriers of the disease. Hydroxychloroquine and lopinavir/ritonavir (in younger age group) can be potential treatment options. Finally, patients discharged from the hospital should be followed up because of potential symptom aggravation.
Keywords: 2019-novel coronavirus, clinical characteristics, coronavirus disease 2019, severe acute respiratory syndrome-CoV-2, treatment outcomes
INTRODUCTION
Coronaviruses are the second cause of the common cold after rhinoviruses.[1] Human coronavirus pathogens can cause a wide range of diseases from the common cold to severe pneumonia. Two previous large-scale pandemics of coronavirus infections in 2002–2003 (coronavirus-severe acute respiratory syndrome [SARS]) and 2012 (coronavirus-Middle East Respiratory Syndrome) had severe global health impacts.[2,3] The recent coronavirus disease of 2019 (COVID-19) has stricken the global health and the economy even more than the previous ones. It has spread to more than 213 countries/territories and has infected more than twenty-seven million people around the world. Iran has been one of the most severely affected countries by the virus.[4,5]
Previous studies described the clinical and demographic characteristics of the disease. Information regarding the transmission pattern is mostly related to China. There is also a lack of information about the potential treatment outcomes and posthospitalization follow-up in the literature.[6,7,8,9]
This study is one of the first reports of COVID-19 patients from Iran. We reported detailed information about the potential source of exposure, household contact information, outcomes of potential therapies, and postdischarge follow-up, as well as demographic, clinical, and paraclinical characteristics.
METHODS
Patients and study overview
Medical records of suspected cases of COVID-19 from February 22, 2020, to March 5, 2020, admitted to the YAS Hospital affiliated to Tehran University of Medical Sciences (TUMS), were reviewed. Our hospital was the first center in Tehran to care for adult COVID-19 patients. A suspected case was defined as a flu-like syndrome/or symptomatic patient along with radiologic pulmonary findings. Data of patients for whom the results of reverse transcriptase-polymerase chain reaction (RT-PCR) were not available were excluded from the study. COVID-19 was confirmed using RT-PCR of nasopharyngeal specimens. This study was approved by the TUMS ethics committee (IR.TUMS.VCR.REC.1398.1036). Informed consent was obtained from all patients or their first-degree relatives in unconscious patients.
Data sources
Patients who came to the hospital were examined by an infectious disease specialist and classified into three groups according to disease severity based on Iran's national guideline for the diagnosis and treatment of COVID-19 in outpatients and inpatients [Figure 1].[10] Patients assigned to moderate or severe infection group were admitted to the hospital.
Figure 1.

Flow chart with an overview of study steps. Patients were classified into three groups of mild, moderate, and severe disease. Treatment regimen and admission/discharge criteria were according to Iran's national guideline for novel coronavirus infection. The definition of mild, moderate, and severe disease was as below according to the national guideline: Patients with a flu-like syndrome with/without fever, who did not have any signs of infiltration in lung imaging were classified as having mild disease. The moderate group was defined as symptomatic patients with pulmonary infiltration or at least one of the admission criteria, as explained in figure. The severe group constituted patients who have at least one of the following criteria: (1) reduced consciousness; (2) respiratory rate ≥30; (3) blood pressure (BP) BP <90/60; (4) multilobular infiltration; (5) hypoxemia
Patients' occupation, travel history within the past 14 days, household contact information, demographic characteristics, potential source of exposure, influenza vaccination history, current list of medications, past medical history, social history, and the use of preventive measures were determined.
History of present illness and comprehensive review of systems were taken, and a complete physical examination was done. Clinical laboratory studies and chest computed tomography (CT scan) were requested on the 1st day of admission according to infectious disease specialist recommendations. We collected hospitalization data using patients' paper medical records.
Available CT scans were reported by a radiologist and scored for severity and location of involvement. The final reports were reviewed by an infectious disease specialist and a pulmonologist.
The main treatment medications included oseltamivir (75 mg twice daily), hydroxychloroquine (200 mg twice daily/400 mg single dose when combined administration with lopinavir-ritonavir), lopinavir-ritonavir (400 mg lopinavir – 100 mg ritonavir twice daily), and ribavirin (1200 mg twice daily) according to the national guideline.[10]
Furthermore, we conducted a telephone survey of patients who were discharged from the hospital. A questionnaire was developed to follow patients for 14-day postdischarge. We asked patients about the episodes of symptom relapse, the need for hospital readmission, and whether they completed 14 days of home quarantine after discharge. Discharged patients were followed up to March 19, 2020.
Study outcomes
The critical situation of the patients, which was defined as admission to an intensive care unit, the use of mechanical ventilation, or death was considered as a primary composite endpoint. We compared demographic characteristics, hospitalization data, and potential treatment outcomes in critically ill and noncritically ill patients. Postdischarge follow-up was reported from the discharged patients.
Study definitions
The patient's occupation risk was classified into three groups. 1. Low exposure occupations that do not require close contact (at least within 6 feet) with the general public, 2. High exposure occupations that have frequent close contact (at least within 6 feet) with the general public, 3. Medical staff occupation was defined as a job in which people work in close proximity (at least within 6 feet) to patients known or suspected of COVID-19 infection.[11] The incubation period was calculated from the time between the last potential exposure and the time showing the first disease symptoms.
Lung lobar scores were calculated using a scoring system giving each five lobes a score graded from 0 to 4 according to the severity of the involved lobe (0 = not involved; 1 = up to 25% involvement; 2 = 26%–50% involvement; 3 = 51%–75% involvement; and 4 = 76%–100% involvement). The sum of all lobar scores combined is defined as the total lung score, which estimates the severity of the entire lung involvement (provides a score between 0 and 20). Lower lobes score was defined as the sums of right lower lobe and left lower lobe scores (provides a score between 0 and 8). The middle lobe score was defined as the right middle lobe score (provides a score between 0 and 4). Upper lobes score was defined as the sums of right upper lobe and left upper lobe scores (provides a score between 0 and 8).
Laboratory confirmation
Laboratory confirmation of SARS-CoV2 was performed in the National Influenza Center located at the School of Public Health, TUMS [Technical details are provided in Supplementary Material].[12]
Statistical analysis
Nonparametric tests (including Fisher's exact test, Mann–Whitney U-test, and Friedman test) were used to analyze data. In addition, logistic regression was used to estimate the effect of the treatment on an odds ratio (OR) scale using the backward Wald elimination of variables [Supplementary Material]. All analysis was performed using SPSS software, version 23 (IBM Corp. Armonk, NY, USA) [More details are provided in Supplementary Material].
RESULTS
In this study, we included 100 hospitalized patients out of 185 admitted patients from February 22, 2020, to March 5, 2020. Figure 2 shows the distribution of the index patients in 22 districts of Tehran and the surrounding areas/cities. District 2 was the most affected district in Tehran, followed by district 12, 5, 8, and 3. Findings show that 37% of the patients either lived in or visited these neighboring areas within the 14 days before admission. Five of these patients were linked to the city of Qom, the epicenter of the disease in Iran.[13] Recent potential exposures, household contact information, demographics, clinical characteristics, laboratory, radiologic findings, and patients' outcomes were extracted as shown in Table 1.
Figure 2.
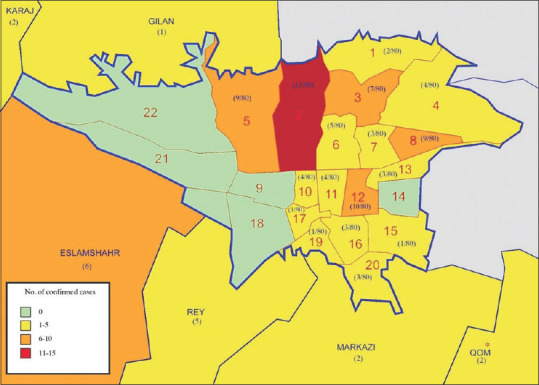
Disease distribution map in Tehran and surrounding areas/cities. This map shows the distribution of all reverse transcriptase-polymerase chain reaction confirmed index patients in 22 districts of Tehran and surrounding areas. We did not have access to the address of two patients in the study. * Qom is marked as the epicenter of COVID-19 in Iran
Table 1.
Demographic characteristics and paraclinical findings of hospitalized patients, compared between critically ill patients and noncritically ill patients
| Variable | All patients (n=100), n/total, n (%) | Noncritically ill (n=85), n/total, n (%) | Critically ill (n=15), n/total, n (%) | P |
|---|---|---|---|---|
| Exposure history | ||||
| Contact with suspected COVID-19 family member | 22/88 (25) | 21/83 (25.3) | 1/5 (20) | 0.63 |
| Contact with medical staff in family member | 6/88 (6.8) | 6/83 (7.2) | 0/5 (0) | 0.70 |
| Contact with underage with upper respiratory infection symptoms | 8/88 (9.1) | 8/83 (9.6) | 0/5 (0) | 0.61 |
| Contact with animals | 4/88 (4.5) | 4/83 (4.8) | 0/5 (0) | 0.79 |
| The use of preventing measuresa | ||||
| Used to wear medical masks | 5/88 (5.7) | 5/83 (6) | 0/5 (0) | 0.74 |
| Used an alcohol-based hand rub | 9/88 (10.2) | 9/83 (10.8) | 0/5 (0) | 0.58 |
| Used to wash hands regularly | 37/88 (42) | 36/83 (43.4) | 1/5 (20) | 0.30 |
| Had personal knowledge about the disease symptom | 22/88 (25) | 22/83 (26.5) | 0/5 (0) | 0.23 |
| Travel history within 14 days before the onset of the symptoms | ||||
| Domestic travel history | 19/88 (21.6) | 19/83 (22.9) | 0/5 (0) | 0.29 |
| International travel history (except china) | 3/88 (3.4) | 3/83 (3.6) | 0/5 (0) | 0.84 |
| Travel to china | 0/88 (0) | 0/83 (0) | 0/5 (0) | |
| Social history | ||||
| Smoker | 15/88 (17) | 15/83 (18.1) | 0/5 (0) | 0.38 |
| Vaccination history | 8/88 (9.1) | 8/83 (9.6) | 0/5 (0) | 0.61 |
| Index patients job classificationb | ||||
| Low exposure risk occupations | 28/58 (48.3) | 27/57 (47.4) | 1/1 (100) | |
| High exposure risk occupation | 25/58 (43.1) | 25/57 (43.9) | 0/1 (0) | |
| Medical staff | 5/58 (8.6) | 5/57 (8.8) | 0/1 (0) | |
| Demographic information | ||||
| Age (years), median (IQR) | 58 (48-68) | 57 (47-68) | 59 (53-67) | 0.32 |
| Distribution | ||||
| >50 | 72/99 (72.7) | 57/84 (67.9) | 15/15 (100) | 0.005 |
| Male sex | 64/99 (64.6) | 55/85 (64.7) | 9/14 (64.3) | 0.60 |
| Median hospitalization period (IQR)-days | 4 (3-5) | 4 (3-5) | 5 (4-8) | 0.006 |
| Median incubation period (IQR)-days | 7 (5-7) | 7 (4-8) | 7 (5-7) | 0.95 |
| Vital signs on admission | ||||
| Fever on admissionc | ||||
| Median temperature (IQR)°C | 37.5 (37-38) | 37.5 (37-38) | 38.2 (37.1-38.8) | 0.12 |
| Distribution of temperature | ||||
| ≥37.8°C | 42/93 (45.2) | 34/81 (42) | 8/12 (66.7) | 0.10 |
| Peripheral capillary oxygen saturation (SpO2) % | ||||
| SpO2 <93% | 84/97 (86.6) | 70/83 (84.3) | 14/14 (100) | 0.11 |
| Median respiratory rate (IQR)-min | 19.5 (18-22) | 19 (18-21.25) | 25.5 (18-28.5) | 0.02 |
| Median heart rate (IQR)-min | 88 (80-100) | 88 (80-93.75) | 104 (80.75-117.75) | 0.02 |
| Blood pressure (mmHg) | ||||
| Median systolic blood pressure (IQR) | 110 (100-130) | 110 (100-130) | 110 (104.5-135) | 0.81 |
| Median diastolic blood pressure (IQR) | 75 (70-80) | 80 (70-80) | 75 (60-80) | 0.53 |
| Clinical symptoms | ||||
| Cough | 68/100 (68) | 57/85 (67.1) | 11/15 (73.3) | 0.44 |
| Sputum production | 6/100 (6) | 4/85 (4.7) | 2/15 (13.3) | 0.22 |
| Shortness of breath | 74/100 (74) | 63/85 (74.1) | 11/15 (73.3) | 0.59 |
| Myalgia | 18/100 (18) | 15/85 (17.6) | 3/15 (20) | 0.56 |
| Headache | 4/100 (4) | 4/85 (4.7) | 0/15 (0) | 0.52 |
| Fatigue | 5/100 (5) | 5/85 (5.9) | 0/15 (0) | 0.44 |
| Pleuritic chest pain | 11/100 (11) | 7/85 (8.2) | 4/15 (26.7) | 0.06 |
| Rhinorrhea | 100/0 (0) | 85/0 (0) | 15/0 (0) | -- |
| Sore throat | 4/100 (4) | 2/85 (2.4) | 2/15 (13.3) | 0.11 |
| Nausea or vomiting | 1/100 (1) | 0/85 (0) | 1/15 (6.7) | 0.15 |
| Diarrhea | 6/100 (6) | 5/85 (5.9) | 1/15 (6.7) | 0.63 |
| Decrease level of consciousness | 5/100 (5) | 0/85 (0) | 5/15 (33.3) | <0.001 |
| Coexisting disorder | ||||
| Any | 62/100 (62) | 51/85 (60) | 11/15 (73.3) | 0.25 |
| Diabetes | 26/100 (26) | 20/85 (23.5) | 6/15 (40) | 0.15 |
| Hypertension | 26/100 (26) | 19/85 (22.4) | 7/15 (46.7) | 0.05 |
| Ischemic heart disease | 19/100 (19) | 15/85 (17.6) | 4/15 (26.7) | 0.31 |
| Chronic obstructive pulmonary disease/asthma | 13/100 (13) | 12/85 (14.1) | 1/15 (6.7) | 0.38 |
| Hypothyroidism | 6/100 (6) | 6/85 (7.1) | 0/15 (0) | 0.37 |
| Others | 19/100 (19) | 13/85 (15.3) | 6/15 (40) | 0.04 |
| Laboratory findings | ||||
| White-cell count | ||||
| Median (IQR) — per mm3 | 6400 (4445-8525) | 5900 (4400-7775) | 12200 (6947.5-13525) | <0.001 |
| Distribution (per mm3) | ||||
| <4000 | 11/90 (12.2) | 10/76 (13.2) | 1/14 (7.1) | |
| 4000-10,000 | 67/90 (74.4) | 63/76 (82.9) | 4/14 (28.6) | |
| >10,000 | 16/90 (17.8) | 7/76 (9.2) | 9/14 (64.3) | |
| Lymphocyte countd | ||||
| Median (IQR)-per mm3 | 1100 (849.5-1530) | 1100 (848-1541) | 1248.5 (918.6-1460.8) | 0.73 |
| Distribution (per mm3) | ||||
| <1500 | 66/89 (74.2) | 54/75 (72) | 12/14 (85.7) | 0.24 |
| Neutrophil count | ||||
| Median (IQR) — per mm3 | 4510.2 (3244.8-6708) | 4237 (3201.3-6205) | 10505.5 (5225.4-12014.5) | <0.001 |
| Distribution (per mm3) | ||||
| >1800 | 7/90 (7.8) | 6/76 (7.9) | 1/14 (7.1) | |
| 1800-7800 | 67/90 (74.4) | 63/76 (82.9) | 4/14 (28.6) | |
| <7800 | 16/90 (17.8) | 7/76 (9.2) | 9/14 (64.3) | |
| Platelet counte (per mm3) | ||||
| Median (IQR) | 180,000 (150,000-214,000) | 174,000 (150,000-213,500) | 184,000 (147,250-268,750) | 0.64 |
| <150,000 | 20/87 (23) | 16/73 (21.9) | 4/14 (28.6) | 0.41 |
| Distribution of other findings | ||||
| Erythrocyte sedimentation rate (mm/h)f | ||||
| Median (IQR) | 43 (32.5-60) | 40.5 (28.5-59) | 50 (42.5-77) | 0.22 |
| Elevated | 34/41 (82.9) | 30/37 (81.1) | 4/4 (100) | 0.46 |
| C-reactive protein (mg/L) | ||||
| Median (IQR) | 36 (20-54.8) | 36 (20-56.6) | 43.25 (22-52.3) | 0.76 |
| >6 | 60/65 (92.3) | 50/55 (90.9) | 10/10 (100) | 0.42 |
| Lactate dehydrogenase (U/L) | ||||
| Median (IQR) | 584 (461.3-736.3) | 581 (467.5-715) | 1500 (381-1531) | 0.27 |
| >480 | 30/40 (75) | 28/37 (75.7) | 2/3 (66.7) | 0.60 |
| Aspartate aminotransferase (U/L) | ||||
| Median (IQR) | 45 (30-56.3) | 41.5 (30-55.5) | 51.5 (39-64.3) | 0.22 |
| >40 | 17/30 (56.7) | 12/24 (50) | 5/6 (83.3) | 0.16 |
| Alanine aminotransferase (U/L) | ||||
| Median (IQR) | 28 (22-34.3) | 28 (19.8-33.8) | 28 (25-50.3) | 0.47 |
| >40 | 5/30 (16.7) | 3/24 (12.5) | 2/6 (33.3) | 0.25 |
| Alkaline phosphatase (U/L) | ||||
| Median (IQR) | 186 (135.5-225.5) | 180 (116.8-207.5) | 235 (195.5-522) | 0.05 |
| >140 | 15/20 (75) | 11/16 (68.8) | 4/4 (100) | 0.28 |
| Creatinine kinase (U/L) | ||||
| >170 | 4/4 (100) | 1/1 (100) | 3/3 (100) | - |
| Creatinine (mmol/L) | ||||
| Median (IQR) | 106.1 (88.4-132.6) | 106.1 (86.2-123.8) | 150.3 (101.7-221.1) | 0.01 |
| ≥133 | 17/83 (20.5) | 10/70 (14.3) | 7/13 (53.8) | 0.004 |
| Prothrombin time (s) | ||||
| Median (IQR) | 13 (13-14.9) | 13 (13-13) | 14.8 (13.4-17.3) | 0.05 |
| >13 | 14/16 (87.5) | 10/12 (83.3) | 4/4 (100) | 0.55 |
| Partial thromboplastin time (s) | ||||
| Median (IQR) | 32 (29-38.5) | 32 (29-35) | 36 (28.8-41.8) | 0.70 |
| >39 | 3/13 (23.1) | 1/9 (11.1) | 2/4 (50) | 0.20 |
| International normalized ratio | ||||
| >1.2 | 3/15 (20) | 1/11 (9.1) | 2/4 (50) | 0.15 |
| Blood gas | ||||
| Metabolic acidosis | 2/28 (7.1) | 2/24 (8.3) | 0/4 (0) | |
| Respiratory acidosis | 0/28 (0) | 0/24 (0) | 0/4 (0) | |
| Metabolic alkalosis | 2/28 (7.1) | 2/24 (8.3) | 0/4 (0) | |
| Respiratory alkalosis | 3/28 (10.7) | 2/24 (8.3) | 1/4 (25) | |
| Metabolic acidosis and respiratory acidosis | 5/28 (17.9) | 3/24 (12.5) | 2/4 (50) | |
| Metabolic acidosis and respiratory alkalosis | 4/28 (14.3) | 4/24 (16.7) | 0/4 (0) | |
| Metabolic alkalosis and respiratory acidosis | 6/28 (21.4) | 6/24 (25) | 0/4 (0) | |
| Metabolic alkalosis and respiratory alkalosis | 6/28 (21.4) | 5/24 (20.8) | 1/4 (25) | |
| Minerals (mmol/L) | ||||
| Median sodium (IQR) | 134 (131.8-136) | 134 (132-136) | 134 (129.5-135.5) | 0.36 |
| Median potassium (IQR) | 4.1 (3.8-4.5) | 4.1 (3.8-4.5) | 4.1 (3.1-4.5) | 0.36 |
| Radiologic findingsg | ||||
| Lobar predominance | ||||
| Right upper lobe | 51/55 (92.7) | 45/48 (93.8) | 6/7 (85.7) | 0.43 |
| Right middle lobe | 50/55 (90.9) | 45/48 (93.8) | 5/7 (71.4) | 0.12 |
| Right lower lobe | 53/55 (96.4) | 46/48 (95.8) | 7/7 (100) | 0.76 |
| Left upper lobe | 49/55 (89.1) | 43/48 (89.6) | 6/7 (85.7) | 0.58 |
| Left lower lobe | 53/55 (96.4) | 46/48 (95.8) | 7/7 (100) | 0.76 |
| Scoring | ||||
| Lobar scores (IQR) | ||||
| Median right upper lobe score | 1 (1-2) | 1 (1-2) | 2 (1-3) | 0.12 |
| Median right middle lobe score | 2 (2-2) | 2 (1-2) | 2 (0-3) | 0.83 |
| Median right lower lobe | 2 (2-3) | 2 (2-3) | 2 (1-3) | 0.96 |
| Median left upper lobe score | 1 (1-2) | 1 (1-2) | 2 (1-3) | 0.11 |
| Median left lower lobe score | 2 (2-3) | 2 (2-3) | 2 (1-3) | 0.96 |
| Cumulative scores (IQR) | ||||
| Median total score | 8 (7-11) | 8 (7-11) | 9 (6-15) | 0.51 |
| Median lower lobes score | 4 (4-6) | 4 (4-6) | 4 (2-6) | 0.96 |
| Median middle lobe score | 2 (1-2) | 2 (1-2) | 2 (0-3) | 0.83 |
| Median upper lobes score | 2 (2-4) | 2 (2-4) | 4 (2-6) | 0.12 |
| Anatomic distribution | ||||
| Peripheral (subpleural) predominance | 55/55 (100) | 48/48 (100) | 7/7 (100) | |
| Central/perihilar predominance | 33/55 (60) | 28/48 (58.3) | 5/7 (71.4) | 0.41 |
| Unilateral | 1/39 (2.6) | 1/36 (2.8) | 0/3 (0) | 0.92 |
| Bilateral | 38/39 (97.4) | 35/36 (97.2) | 3/3 (100) | |
| Attenuation | ||||
| Ground-glass opacity | 45/55 (81.8) | 39/48 (81.3) | 6/7 (85.7) | 0.66 |
| Mixed (ground-glass opacity and consolidation) | 10/55 (18.2) | 9/48 (18.8) | 1/7 (14.3) | |
| Crazy paving appearance | 10/55 (18.2) | 7/48 (14.6) | 3/7 (42.9) | 0.10 |
| Other signs | ||||
| Reticulation | 1/55 (1.8) | 1/48 (2.1) | 0/7 (0) | 0.87 |
| Cavitation | 0/55 (0) | 0/48 (0) | 0/7 (0) | |
| Bronchiectasis | 0/55 (0) | 0/48 (0) | 0/7 (0) | |
| Pleural effusion | 4/55 (7.3) | 2/48 (4.2) | 2/7 (28.6) | 0.07 |
| Lymphadenopathy | 2/55 (3.6) | 2/48 (4.2) | 0/7 (0) | 0.76 |
| Treatments | ||||
| Admission to intensive care unit | 12/100 (12) | 0/85 (0) | 12/15 (80) | <0.001 |
| Mechanical ventilation | 13/100 (14) | 0/85 (0) | 13/15 (86.7) | <0.001 |
| Noninvasive ventilation | 2/100 (2) | 0/85 (0) | 2/15 (13.3) | 0.02 |
| Invasive ventilation | 12/100 (12) | 0/85 (0) | 12/15 (80) | <0.001 |
| Medications | ||||
| Oseltamivir | 100/100 (100) | 85/85 (100) | 15/15 (100) | |
| Hydroxychloroquine | 94/100 (94) | 80/85 (94.1) | 14/15 (93.3) | 0.63 |
| Lopinavir/ritonavir | 60/100 (60) | 47/85 (55.3) | 13/15 (86.7) | 0.02 |
| Ribavirin | 12/100 (12) | 3/85 (3.5) | 9/15 (60) | <0.001 |
| Systemic glucocorticoids | 4/100 (4) | 1/85 (1.2) | 3/15 (20) | 0.01 |
| Losartan | 16/100 (16) | 14/85 (16.5) | 2/15 (13.3) | 0.56 |
| ACE inhibitor | 3/100 (3) | 1/85 (1.2) | 2/15 (13.3) | 0.06 |
| Levofloxacin | 52/100 (52) | 43/85 (50.6) | 9/15 (60) | 0.35 |
| Vancomycin | 32/100 (32) | 23/85 (27.1) | 9/15 (60) | 0.02 |
| Azithromycin | 21/100 (21) | 19/85 (22.4) | 2/15 (13.3) | 0.34 |
| Ceftriaxone | 23/100 (23) | 20/85 (23.5) | 3/15 (20) | 0.53 |
| Piperacillin-tazobactam | 6/100 (6) | 5/85 (5.9) | 1/15 (6.7) | 0.63 |
| Meropenem | 6/100 (6) | 2/85 (2.4) | 4/15 (26.7) | 0.004 |
| Imipenem | 5/100 (5) | 4/85 (4.7) | 1/15 (6.7) | 0.56 |
| Ciprofloxacin | 3/100 (3) | 1/85 (1.2) | 2/15 (13.3) | 0.06 |
| Intravenous fluid therapy | ||||
| Solution type-number/total number | ||||
| Dextrose 3.3%-sodium chloride 0.3% | 24/86 (27.9) | 21/73 (28.8) | 3/13 (23.1) | |
| Sodium lactate | 5/86 (5.8) | 5/73 (6.8) | 0/13 (0) | |
| Sodium chloride 0.9% | 5/86 (5.8) | 3/73 (4.1) | 2/13 (15.4) | |
| Sodium chloride 0.45% | 46/86 (53.5) | 39/73 (53.4) | 7/13 (53.8) | |
| Dextrose 5%-saline 0.9% | 6/86 (7) | 5/73 (6.8) | 1/13 (7.7) | |
| Median solution amount (IQR)-cc/24 h | 1500 (1000-2000) | 1500 (1000-2000) | 1500 (1250-2000) | 0.12 |
| Clinical outcome at hospitalization data cut off | ||||
| Still hospitalized | 18/100 (18) | 18/85 (21.2) | 0/15 (0) | |
| Discharged from hospital | 70/100 (70) | 65/85 (76.5) | 5/15 (33.3) | |
| Death | 12/100 (12) | 2/85 (2.4) | 10/15 (66.7) |
aPreventive measures consisted of wearing a medical facial mask when in contact with the public, 2. To use an alcohol-based hand rub, 3. To wash hands regularly according to the WHO guideline[19], bThe patient’s occupation risk was classified into three groups. 1. Low exposure occupations that do not require close contact (at least within 6 feet) with the general public, 2. High exposure occupations that have frequent close contact (at least within 6 feet) with the general public, 3. Medical staff occupation was defined as a job in which people work in close proximity (at least within 6 feet) to patients known or suspected of COVID-19 infection[11], cFever was defined as an axillary body temperature of 37.8°C or above, dLymphocytopenia was defined as lymphocyte count <1500, eThrombocytopenia was defined as a platelet count of <150,000, fESR normal range is dependent on age and sex of the patients and defined as follows=For male individuals <50 years of age; the normal range is below 15; for >50 and <85 years of age; the normal range is below 20; and for >85 years of age; the normal range is below 30. For female individuals 50 >years of age; the normal range is below 20; for >50 and <85 years of age; the normal range is below 30; and for >85 years of age; the normal range is below 42. Any values above the normal limits were defined as elevated ESR in table, gData regarding CT scan were missing for 45 patients due to the fact that they were performed at outside referring hospitals. IQR=Interquartile range; COVID-19=Coronavirus disease-2019; ACE=Angiotensin-converting-enzyme; WHO=World health organization, CT=Computed tomography, ESR=Erythrocyte sedimentation rate
Prehospitalization and demographic information
The median age of the patients was 58 years (range, 26–93). The majority of the patients (72.7%) were above 50 years of age. Critically ill patients were older than the noncritically ill group (100% vs. 67.9%; P = 0.005). Males constituted the majority of the patients (64.6%). The median of family members was 2 persons (interquartile range [IQR], 2–3) in a household. A total of 126 family members (55% female and 45% male) were identified to live in a household with index patients; 63% were above 50 years of age. According to job classification, 28 patients (28%) had low exposure risk occupations, 25 (25%) had high exposure risk occupations, and 5 of them (5%) were medical staff. Most potential exposures were contact with a suspected family member (22%) and contact with underage family members who had upper respiratory infection symptoms (8%). Nineteen patients (19%) who lived in Tehran had a recent history of domestic travel, and 3 (3%) had recent overseas travel. None of the patients recently traveled to or from China [Table 1].
Clinical and paraclinical findings
The median incubation period was 7 days (IQR, 5–7). Fever was present in 45.2% of the patients on admission. The most common clinical symptoms were shortness of breath (74%), cough (68%), and myalgia (18%). Decrease level of consciousness was evident in 33% among critically ill patients, as compared with 0% among the noncritically ill group (P < 0.001). Furthermore, respiratory rate was higher in critically ill patients compared with noncritically ill group (median of 25.5 vs. 19/min; P = 0.02). The presence of a coexisting disorder was higher in the critically ill group but was not statistically significant (73.3% vs. 60%, relative risk for the critically ill group, 0.59; 95% confidence interval [CI], 0.20–1.73; P = 0.25).
Laboratory tests on admission show that 74.2% of the patients had lymphocytopenia, 92.3% had elevated C-reactive protein, 82.9% had elevated erythrocyte sedimentation rate, and 75% had elevated lactate dehydrogenase levels. The median level of white-cell count and median neutrophil count was statistically different in two groups of critically and noncritically ill patients (P = 0.001 and P < 0.001, respectively). Abnormal creatinine level percentage was higher in critical patients compared to noncritical ones (relative risk for the critically ill group, 4.53; 95% CI, 1.75–11.73, P = 0.004).
In total, 55 CT scans were reviewed and scored by an expert radiologist. Nonparametric Friedman test shows different involvement in terms of lobar predominance. Right lower and left lower lobes were the most involved lobes followed by the right middle lobe, right upper lobe, and left upper lobe, respectively (P < 0.001). Furthermore, the test shows a difference in three cumulative scores. Median lower lobes score was the highest score followed by median upper lobes score and median middle lobe score, respectively (P < 0.001). Ground-glass opacity was the most common radiology finding (81.8%), followed by mixed pattern (ground-glass opacity + consolidation) and crazy paving appearance, which were found equally in the results (18.2%). Both groups (critically ill vs. noncritically ill) had similar CT scan findings. Comparing the demographic characteristics, radiographic and laboratory findings of discharged patients and dead patients are provided in the Supplementary Table 1.
Treatment and clinical outcomes
All of the patients received oseltamivir as a recommended medication according to the national guideline. Other main administered medications included hydroxychloroquine (94%), lopinavir/ritonavir (60%), and ribavirin (12%) were administered in the patients. Intravenous antibiotics were also administered as shown in [Table 1]. All patients received supplementary oxygen therapy based on patients' conditions. Intravenous fluid therapy was given for routine maintenance, as mentioned by solution type and volume [Table 1]. In total, 19 patients were already taking losartan and angiotensin-converting enzyme inhibitors (ACE inhibitors) due to hypertension, which continued during hospitalization course (16% losartan vs. 3% ACE inhibitors). Mechanical ventilation was used in 13% of the patients (2% noninvasive ventilation vs. 12% invasive ventilation).
Hydroxychloroquine (OR = 61.859; 95% CI for OR, 9.009–424.722) and the interaction of lopinavir/ritonavir × age × severity (OR = 0.922; 95% CI for OR, 0.887–0.958) had a significant effect on the OR. However, the interaction of azithromycin by hydroxychloroquine did not have a significant effect on the model (OR = 0.917; 95% CI for OR, 0.00–4.34 × 10⁹). Table 2 shows the first and the last step of the backward elimination in regression analysis. (Complete 13 steps of logistic regression is provided in the Supplementary Material section [Supplementary Table 2].) The value of Nagelkerke's R2 for the final model was 0.840, and Cox and Snell's R2 was 0.630, which both values showed the goodness of fit in our model.
Table 2.
The results of logistic regression using a backward Wald elimination of variables (response: Outcome)a
| Regression coefficient (β) | SE | P | OR | 95% CI for OR (lower-upper) | |
|---|---|---|---|---|---|
| Step 1 | |||||
| Age | −0.006 | 0.023 | 0.81 | 0.994 | 0.950-1.041 |
| Hospitalization period | −0.005 | 0.259 | 0.98 | 0.995 | 0.599-1.651 |
| Hydroxychloroquine (1) | 5.138 | 2.944 | 0.08 | 170.3 | 0.531-5.46E+04 |
| Ribavirin (1) | −1.854 | 4.555 | 0.68 | 0.157 | 0.000-1180.949 |
| Lopinavir/ritonavir (1) | 0.858 | 1.829 | 0.64 | 2.359 | 0.065-85.041 |
| Intravenous antibiotics (1) | −1.212 | 3.085 | 0.69 | 0.298 | 0.001-125.876 |
| Hydroxychloroquine (1) by age by severity (1) | 0.332 | 758.358 | 1.00 | 1.394 | 0.000-NA |
| Lopinavir/ritonavir (1) by age by severity (1) | −0.639 | 766.387 | 1.00 | 0.528 | 0.000-NA |
| Ribavirin (1) by age by severity (1) | 0.236 | 110.643 | 1.00 | 1.266 | 0.000-1.91E+94 |
| Diabetes (1) | −2.310 | 1.750 | 0.19 | 0.099 | 0.003-3.063 |
| Hypertension (1) | 2.513 | 2.062 | 0.22 | 12.338 | 0.217-702.334 |
| Chronic obstructive pulmonary disease/asthma (1) | 34.177 | 10895.718 | 1.00 | 6.96E+14 | 0.000-NA |
| Azithromycin (1) by hydroxychloroquine (1) | −0.087 | 11.366 | 0.99 | 0.917 | 0.000-4.34E+09 |
| Age by azithromycin (1) by hydroxychloroquine (1) | 0.028 | 0.207 | 0.89 | 1.028 | 0.685-1.544 |
| Step 13 | |||||
| Hydroxychloroquine (1) | 4.125 | 0.983 | <0.001 | 61.859 | 9.009-424.722 |
| Lopinavir/ritonavir (1) by age by severity (1) | −0.081 | 0.020 | <0.001 | 0.922 | 0.887-0.958 |
Complete 13 steps of logistic regression is provided in the electronic Supplementary Material [Supplementary Table 2]. OR=Odds ratio; CI=Confidence interval; SE=Standard deviation; NA=Not applicable
Of the 185 patients admitted to the hospital during the study period, only 100 patients were eligible. Of these 100, 12 patients (12%) died, and 70 patients (70%) discharged at the date of data cut off. The causes of death were as follows: five patients due to acute respiratory distress syndrome, two patients died of septic shock, two patients died due to cardiac arrhythmia, and 1 died of pneumothorax. The two remaining patients died of sudden cardiac arrest.
Postdischarge follow-up
Seventy patients were followed within 14 days of discharge date. Thirty-six patients (51.4%) had observed 14 days of home quarantine postdischarge. Symptoms had aggravated in 40% of the patients. Shortness of breath (13%) and cough (13%) were the most common aggravated symptoms after discharge. Six of the patients (8.6%) were readmitted to the hospital, and three patients (4.3%) died postdischarge [Table 3].
Table 3.
Postdischarge follow-up
| Variable | Discharged patientsa (n=70), n/total n (%) |
|---|---|
| Observing home quarantine after dischargeb | 36/70 (51.4) |
| Postdischarge symptom relapse | |
| Any | 28/70 (40) |
| Fever | 3/70 (4.3) |
| Sore throat | 3/70 (4.3) |
| Loss of appetite | 2/70 (2.9) |
| Dizziness | 2/70 (2.9) |
| Shortness of breath | 13/70 (18.6) |
| Cough | 13/70 (18.6) |
| Fatigue | 4/70 (5.7) |
| Myalgia | 3/70 (4.3) |
| Nausea or vomiting | 4/70 (5.7) |
| Postdischarge outcome- | |
| Hospital readmission | 6/70 (8.6) |
| Deathc | 3/70 (4.3) |
| Recovery | 61/70 (87.1) |
aOnly discharged patients were eligible for the telephone survey (n=70). bThe patients were asked whether they completed 14 days of home quarantine after discharge. cWe could not determine the cause of death in patients who died postdischarged
DISCUSSION
Our hospital was the first center to care for the new COVID-19 cases appearing in Tehran, Iran. We presented the first 100 cases of COVID-19 patients in Tehran. We identified the most common source of exposure, detailed clinical and paraclinical findings, the clinical outcome of common proposed antiviral therapies, and postdischarge follow-up.
The most important findings consisted of hydroxychloroquine and lopinavir/ritonavir's positive effect on the disease outcome. Our findings are in concordance with previous studies, where hydroxychloroquine showed efficacy in disease outcome.[14,15] However, some studies showed contrasting results. Cao et al. concluded that lopinavir/ritonavir was not efficacious for COVID-19, but the data were not assessed in relation to individual patient parameters.[16] Our regression model identified age as a determinant of responsiveness to lopinavir/ritonavir, with efficacy being related to younger ages. It means that younger age is a positive factor in the responsiveness to antiviral therapy with lopinavir/ritonavir. Furthermore, higher ages have been identified as an important determinant in the mortality from COVID-19. We also used the model to determine the efficacy of a combined azithromycin/hydroxychloroquine regimen and found that the combination was not significant in clinical outcomes. This finding is contrary to the current protocols and a previous study.[17]
The second most significant finding was symptom aggravation in 40% of patients after discharge. The most common aggravated symptoms were cough (18.6%) and shortness of breath (18.6%). Six patients (8.6%) were readmitted to the hospital, and three patients (4.3%) died after discharge. This emphasizes the need for a close follow-up after symptom improvement. Lan et al. showed that certain patients could recover and test negative, only to test positive again.[18,19] This phenomenon might underlie the symptom rebound in our patients and might indicate that patients are still a source of transmission after recovering from COVID-19.
The next significant finding in our study was a greater prevalence of COVID-19 in higher socioeconomic neighborhoods. We would have expected the lower socioeconomic segments in Tehran to be more important in transmission, but in our study, we found the contrary. This may be explained by the greater number of crowded areas such as shopping malls and hospitals in affluent areas in comparison to the less affluent areas.
Furthermore, the majority of the patients did not follow WHO preventive measures; only 5% used medical masks, 9% used an alcohol-based hand rub, and 37% washed their hands regularly.[20] This emphasizes the importance of preventive measures.
Fever was present in less than half (45.2%) of the patients on admission, while the most common clinical symptoms were shortness of breath (74%) and cough (68%). Our data on fever are similar to Guan et al. who reported 43.8% fever on admission and differ from Chen et al. and Wang et al. who reported 83% and 98.6%, respectively.[6,7,8] This might indicate that fever is not a specific finding in COVID-19. However, the cough has been a consistent prominent clinical symptom in COVID-19.
The severity of disease was directly related to patients age over 50 years, higher respiratory rate, and decreased level of consciousness. This is consistent with previous studies.[21,22] Furthermore, the rate of coexisting was higher among more critical group. This finding is consistent with a meta-analysis of 17 studies, in which hypertension, chronic obstructive pulmonary disease, diabetes, and cardiovascular disease were higher among critically-ill patients.[23]
Lymphocytopenia was a common laboratory finding. It may serve as a more specific marker at the beginning of this infection considering previous studies.[6,7,8] However, it was absent in 25% of our study population.
Abnormal creatinine levels, higher white cell count, and higher neutrophil count were seen in our critically ill patients. This may be explained by direct renal involvement or fluid imbalance secondary to the critically ill status of the patients.[24] Increased white blood cell count in critically ill patients with the predominance of neutrophils can be a sign of secondary bacterial infection.
Chest CT scans analysis revealed higher involvement in both lower lung lobes compared with right middle and upper lung lobes. The most common finding was ground-glass opacity (81.8%).[25] The presence of ground-glass opacity and bilateral lower lobe involvement is the most common radiographic findings of these patients, similar to Xu et al., and can be used as a diagnostic factor for COVID-19.[26]
Limitations
First, we did not have access to review all CT scans since some were performed at outside referring hospitals. Second, the limited number of laboratory studies was due to the high patient load and limited resources. Third, many patients were excluded due to the lack of PCR kits at the onset of the epidemic in Tehran. Fourth, some patient medical records were not complete due to the emergency situation. Fifth, many of the patients were unable to remember initial exposure. Sixth, we could not determine the cause of death in patients who died postdischarged.
CONCLUSION
COVID-19 can present with a heterogeneous pattern of nonspecific findings but affects older individuals more adversely. There is a high risk of postdischarge symptom aggravation and necessitates close monitoring of discharged patients. The rush is on to find an effective therapy. The medical community is actively testing numerous repurposed and novel drugs.
Financial support and sponsorship
Nil.
Conflicts of interest
There are no conflicts of interest.
SUPPLEMENTARY MATERIAL
Laboratory confirmation
Nasopharyngeal swab specimens were collected from hospitalized patients using Dacron sterile swabs and placed in 2 cc viral transport media and sent to the laboratory in cold condition. All samples were subjected to RNA extraction with High Pure Viral Nucleic Acid Kit (Roche, Germany) according to the manufacturer's instructions. Real-time polymerase chain reaction (RT-PCR) was used to detect the presence of SARS-CoV2 with kits (ModularDx Kit, Wuhan CoV E, and RdRP genes) provided by WHO targeting the E region for screening and RNA-dependent RNA polymerase for confirmation. Invitrogen SuperScript III One-Step RT-PCR System with Platinum Taq DNA Polymerase was used for PCR. For each reaction, 12.5 μl reaction mix, 1 μl RT enzyme, 0.5 μl primer, probe mix, and 5.6 μl PCR grade water were added to 5 μl RNA template. Cycling conditions for amplification of E and RdRP genes were 50°C for 30 min, 95°C for 2 min, then 45 cycles of 95°C for 15 s and 58°C for 30 s. A cycle threshold (Ct) value of less than 36 Ct was defined as a positive test result.[12]
Statistical analysis
Nonparametric tests (including Fisher's exact test, Mann–Whitney U test, and Friedman test) were used to analyze data. Cross-tabulation and Fisher's exact test were used to investigate the relation between the binary variables. Mann-Whitney U test was applied to compare the quantitative variables between the two groups, and the median and the interquartile range (IQR) were presented with the results. In the computed tomographic (CT) scan analysis, the Friedman test was used to compare between different lung lobes involvement and comparison of triple accumulative scores. In addition, logistic regression was used to estimate the effect of the treatment on an odds ratio (OR) scale using the backward Wald elimination of variables. In the regression model, the response variable was considered as a binary variable with either 0 or 1 (1 in case of discharge and recovery, and 0 in case of death). All of the administered medications (hydroxychloroquine, lopinavir/ritonavir, ribavirin, and antibiotics) were entered into the regression model as binary and independent variables. Patients' age and coexisting disorders (including hypertension, diabetes, and COPD/asthma) were considered as covariate variables, and the interaction between age and patient's condition (critically ill vs. noncritically ill), and medications (hydroxychloroquine, lopinavir/ritonavir, and ribavirin) were included in the model. Further, to examine the simultaneous effect of hydroxychloroquine and azithromycin, the interaction of these two variables was considered in the model. All analysis was performed using SPSS software, version 23 (IBM Corp. Armonk, NY, USA).
Supplementary Table 1 significant findings
All of the deceased group were aged above 50 years compared with the discharged patients who were only 70% above the age of 50 (P = 0.02). Only 2.9% of the discharged patients presented with decrease consciousness in comparison with the other group who had a 25% decrease level of consciousness on admission (relative risk for the dead group, 0.20; 95% confidence interval [CI], 0.08–0.50; P = 0.02). Deceased patients had a higher respiratory rate on admission compared with the other group (median 27 vs. median 19, P = 0.04). Only 3% of the discharged group needed invasive ventilation compared with the other group who needed 83% (relative risk for the dead group, 0.03; 95% CI, 0.01–0.14; P < 0.001).
There is no significant difference between the two groups regarding receiving lopinavir/ritonavir (83% vs. 54%; relative risk for the dead group, 0.28; 95% CI, 0.07–1.21; P = 0.05).
Patients who died had more elevated white cell count than the discharged group (64% vs. 14%, P = 0.001). Furthermore, the elevated neutrophil count was higher in deceased patients than the other (64% vs. 14%, P < 0.001).
Supplementary Table 1.
Comparing the demographic characteristics, radiographic and laboratory findings of discharged patients and dead patients
| Variable | Total (n=82), n/total n (%) | Dead (n=12), n/total n (%) | Discharged (n=70), n/total n (%) | P |
|---|---|---|---|---|
| Demographic information | ||||
| Age (years) | ||||
| Median (IQR) | 58 (48.5-68.5) | 65 (54.5-78.8) | 57 (47.5-68) | 0.06 |
| Distribution | ||||
| >50 | 60/81 (74.1) | 12/12 (100) | 48/69 (69.6) | 0.02 |
| Male sex | 52/81 (64.2) | 8/11 (72.7) | 44/70 (62.9) | 0.39 |
| Median hospitalization period (IQR), days | 4 (3-5) | 4.5 (4-9) | 4 (3-5) | 0.22 |
| Median incubation period (IQR), days | 7 (5-7) | 7 (5-7) | 7 (4.75-7) | 0.39 |
| Clinical symptoms | ||||
| Cough | 59/82 (72) | 8/12 (66.7) | 51/70 (72.9) | 0.45 |
| Sputum production | 6/82 (7.3) | 0/12 (0) | 6/70 (8.6) | 0.37 |
| Shortness of breath | 60/82 (73.2) | 9/12 (75) | 51/70 (72.9) | 0.59 |
| Myalgia | 13/82 (15.9) | 1/12 (8.3) | 12/70 (17.1) | 0.39 |
| Headache | 2/82 (2.4) | 0/12 (0) | 2/70 (2.9) | 0.73 |
| Fatigue | 2/82 (2.4) | 0/12 (0) | 2/70 (2.9) | 0.73 |
| Pleuritic chest pain | 11/82 (13.4) | 3/12 (25) | 8/70 (11.4) | 0.20 |
| Rhinorrhea | 82/0 (100) | 12/0 (100) | 70/0 (100) | - |
| Sore throat | 3/82 (3.7) | 2/12 (16.7) | 1/70 (1.4) | 0.06 |
| Nausea or vomiting | 1/82 (1.2) | 0/12 (0) | 1/70 (1.4) | 0.85 |
| Diarrhea | 5/82 (6.1) | 1/12 (8.3) | 4/70 (5.7) | 0.56 |
| Decrease level of consciousness | 5/82 (6.1) | 3/12 (25) | 2/70 (2.9) | 0.02 |
| Vital signs on admission | ||||
| Fever on admission | ||||
| Patients | ||||
| Median temperature (IQR) °C | 37.6 (37-38.1) | 37.8 (36.9-38.7) | 37.6 (37-38) | 0.58 |
| ≥37.8°C | 37/76 (48.7) | 5/9 (55.6) | 32/67 (47.8) | 0.47 |
| Peripheral capillary oxygen saturation (SpO2) % | ||||
| SpO2 <93% | 71/81 (87.7) | 11/11 (100) | 60/70 (85.7) | 0.21 |
| Median respiratory rate (IQR), min | 20 (18-24) | 27 (18-30) | 19 (18-22) | 0.04 |
| Median heart rate (IQR), min | 90 (80-101) | 104 (88-114) | 88 (80-100) | 0.03 |
| Median systolic blood pressure (IQR), mmHg | 110 (100-130) | 110 (98-115) | 110 (100-130) | 0.25 |
| Median diastolic blood pressure (IQR), mmHg | 75 (70-80) | 75 (58-80) | 77.5 (70-80) | 0.48 |
| Coexisting disorder | ||||
| Any | 50/82 (61) | 9/12 (75) | 41/70 (58.6) | 0.23 |
| Diabetes | 18/82 (22) | 5/12 (41.7) | 13/70 (18.6) | 0.08 |
| Hypertension | 24/82 (29.3) | 5/12 (41.7) | 19/70 (27.1) | 0.24 |
| Ischemic heart disease | 13/82 (15.9) | 2/12 (16.7) | 11/70 (15.7) | 0.61 |
| Chronic obstructive pulmonary disease/asthma | 11/82 (13.4) | 0/12 (0) | 11/70 (15.7) | 0.16 |
| Hypothyroidism | 5/82 (6.1) | 0/12 (0) | 5/70 (7.1) | 0.44 |
| Others | 17/82 (20.7) | 4/12 (33.3) | 13/70 (18.6) | 0.21 |
| Treatments | ||||
| Admission to intensive care unit | 13/82 (15.9) | 7/12 (58.3) | 6/70 (8.6) | <0.001 |
| Mechanical ventilation | 13/82 (15.9) | 10/12 (83.3) | 3/70 (4.3) | <0.001 |
| Noninvasive | 2/82 (2.4) | 1/12 (8.3) | 1/70 (1.4) | 0.27 |
| Invasive | 12/82 (14.6) | 10/12 (83.3) | 2/70 (2.9) | <0.001 |
| Medications | ||||
| Oseltamivir | 82/0 (100) | 12/0 (100) | 70/0 (100) | - |
| Hydroxychloroquine | 77/82 (93.9) | 10/12 (83.3) | 67/70 (95.7) | 0.15 |
| Lopinavir/ritonavir | 48/82 (58.5) | 10/12 (83.3) | 38/70 (54.3) | 0.05 |
| Ribavirin | 11/82 (13.4) | 6/12 (50) | 5/70 (7.1) | 0.00 |
| Systemic glucocorticoids | 4/82 (4.9) | 2/12 (16.7) | 2/70 (2.9) | 0.10 |
| Losartan | 14/82 (17.1) | 2/12 (16.7) | 12/70 (17.1) | 0.67 |
| ACE inhibitor | 3/82 (3.7) | 0/12 (0) | 3/70 (4.3) | 0.62 |
| Levofloxacin | 42/82 (51.2) | 7/12 (58.3) | 35/70 (50) | 0.41 |
| Vancomycin | 27/82 (32.9) | 5/12 (41.7) | 22/70 (31.4) | 0.35 |
| Azithromycin | 18/82 (22) | 1/12 (8.3) | 17/70 (24.3) | 0.20 |
| Ceftriaxone | 20/82 (24.4) | 1/12 (8.3) | 19/70 (27.1) | 0.15 |
| Piperacillin-tazobactam | 5/82 (6.1) | 0/12 (0) | 5/70 (7.1) | 0.44 |
| Meropenem | 4/82 (4.9) | 3/12 (25) | 1/70 (1.4) | 0.009 |
| Imipenem | 5/82 (6.1) | 1/12 (8.3) | 4/70 (5.7) | 0.56 |
| Ciprofloxacin | 2/82 (2.4) | 2/12 (16.7) | 0/70 (0) | 0.02 |
| Intravenous fluid therapy | ||||
| Solution type | ||||
| Dextrose 3.3% -sodium chloride 0.3% | 18/71 (25.4) | 3/10 (30) | 15/61 (24.6) | |
| Sodium lactate | 3/71 (4.2) | 0/10 (0) | 3/61 (4.9) | |
| Sodium chloride 0.9% | 5/71 (7) | 3/10 (30) | 2/61 (3.3) | |
| Sodium chloride 0.45% | 39/71 (54.9) | 3/10 (30) | 36/61 (59) | |
| Dextrose 5% - saline 0.9% | 6/71 (8.5) | 1/10 (10) | 5/61 (8.2) | |
| Median solution amount (IQR), cc/24 h | 1500 (1000-2000) | 1500 (1000-2250) | 1500 (1000-2000) | 0.51 |
| Laboratory findings | ||||
| White-cell count (per mm3) | ||||
| Median (IQR) | 6700 (4460-8900) | 13000 (7300-14200) | 6100 (4400-7900) | 0.001 |
| Distribution (per mm3) | ||||
| <4000 | 8/75 (10.7) | 0/11 (0) | 8/64 (12.5) | |
| 4000-10,000 | 51/75 (68) | 4/11 (36.4) | 47/64 (73.4) | |
| >10,000 | 16/75 (21.3) | 7/11 (63.6) | 9/64 (14.1) | |
| Lymphocyte count (per mm3) | ||||
| Median (IQR) | 1150 (848-1541) | 1300 (986.5-1463) | 1097.5 (847.3-1592.8) | 0.48 |
| Distribution (per mm3) | ||||
| <1500 | 55/75 (73.3) | 9/11 (81.8) | 46/64 (71.9) | 0.39 |
| Neutrophil count (per mm3) | ||||
| Median (IQR) | 4884 (3256-7128) | 11180 (5680-13348) | 4329.5 (3201.3-6589.5) | <0.001 |
| Distribution (per mm3) | ||||
| >1800 | 5/75 (6.7) | 0/11 (0) | 5/64 (7.8) | |
| 1800-7800 | 54/75 (72) | 4/11 (36.4) | 50/64 (78.1) | |
| <7800 | 16/75 (21.3) | 7/11 (63.6) | 9/64 (14.1) | |
| Platelet count (per mm3) | ||||
| Median (IQR) | 180,000 (147,000-213,000) | 190,000 (145,000-280,000) | 174,500 (147,500-212,000) | 0.36 |
| <150,000 | 19/73 (26) | 3/11 (27.3) | 16/62 (25.8) | 0.59 |
| Distribution of other findings | ||||
| Erythrocyte sedimentation rate (mm/h) | ||||
| Median (IQR) | 50.5 (37-71.5) | 54.5 (46.3-86) | 49 (36-71.5) | 0.33 |
| Elevated | 30/32 (93.8) | 3/3 (100) | 27/29 (93.1) | 0.82 |
| C-reactive protein (mg/L) | ||||
| Median (IQR) | 34.5 (17.5-48.5) | 44 (21.5-55.5) | 33 (12-47) | 0.28 |
| >6 | 47/52 (90.4) | 9/9 (100) | 38/43 (88.4) | 0.37 |
| Lactate dehydrogenase (U/L) | ||||
| Median (IQR) | 581 (467.5-711.5) | 1515.5 | 561 (455-697) | |
| >480 | 25/33 (75.8) | 2/2 (100) | 23/31 (74.2) | 0.57 |
| Aspartate aminotransferase (U/L) | ||||
| Median (IQR) | 45 (32-56) | 51 (43.5-64.5) | 41.5 (29.5-57) | 0.27 |
| >40 | 16/27 (59.3) | 5/5 (100) | 11/22 (50) | 0.05 |
| Alanine aminotransferase (U/L) | ||||
| Median (IQR) | 28 (22-35) | 28 (26-58.5) | 29.5 (21.3-34.3) | 0.30 |
| >40 | 5/27 (18.5) | 2/5 (40) | 3/22 (13.6) | 0.22 |
| Alkaline phosphatase (U/L) | ||||
| Median (IQR) | 186 (158-226) | 246 (205-486) | 180 (112-204) | 0.02 |
| >140 | 15/19 (78.9) | 5/5 (100) | 10/14 (71.4) | 0.26 |
| Creatinine kinase (U/L) | ||||
| >170 | 4/4 (100) | 2/2 (200) | 2/2 (100) | - |
| Creatinine (µmol/L) | ||||
| Median (IQR) | 106.1 (84-128.2) | 150.3 (123.8-238.7) | 97.2 (79.6-114.9) | <0.001 |
| ≥133 | 12/69 (17.4) | 6/11 (54.5) | 6/58 (10.3) | 0.002 |
| Prothrombin time (s) | ||||
| Median (IQR) | 13 (13-14.9) | 13 | 13 (13-14.8) | 0.77 |
| >13 | 14/16 (87.5) | 3/3 (100) | 11/13 (84.6) | 0.65 |
| Partial thromboplastin time (s) | ||||
| Median (IQR) | 32 (29-38.5) | 31 | 32.5 (29.5-37.3) | 0.80 |
| >39 | 3/13 (23.1) | 1/3 (33.3) | 2/10 (20) | 0.58 |
| International normalized ratio | ||||
| >1.2 | 3/15 (20) | 1/3 (33.3) | 2/12 (16.7) | 0.52 |
| Blood gas | ||||
| Metabolic acidosis | 2/19 (10.5) | 0/4 (0) | 2/15 (13.3) | |
| Respiratory acidosis | 0/19 (0) | 0/4 (0) | 0/15 (0) | |
| Metabolic alkalosis | 1/19 (5.3) | 0/4 (0) | 1/15 (6.7) | |
| Respiratory alkalosis | 2/19 (10.5) | 1/4 (25) | 1/15 (6.7) | |
| Metabolic acidosis and respiratory acidosis | 4/19 (21.1) | 1/4 (25) | 3/15 (20) | |
| Metabolic acidosis and respiratory alkalosis | 3/19 (15.8) | 1/4 (25) | 2/15 (13.3) | |
| Metabolic alkalosis and respiratory acidosis | 3/19 (15.8) | 0/4 (0) | 3/15 (20) | |
| Metabolic alkalosis and respiratory alkalosis | 4/19 (21.1) | 1/4 (25) | 3/15 (20) | |
| Minerals (mmol/L) | ||||
| Median sodium (IQR) | 134 (131-136) | 133 (130-137) | 134 (131.5-136) | 0.42 |
| Median potassium (IQR) | 4.1 (3.7-4.5) | 4.4 (3.6-4.6) | 4.1 (3.8-4.4) | 0.59 |
| Radiologic findings | ||||
| Lobar predominance | ||||
| Right upper lobe | 45/48 (93.8) | 1/2 (50) | 44/46 (95.7) | 0.12 |
| Right middle lobe | 44/48 (91.7) | 1/2 (50) | 43/46 (93.5) | 0.16 |
| Right lower lobe | 46/48 (95.8) | 2/2 (100) | 44/46 (95.7) | 0.92 |
| Left upper lobe | 43/48 (89.6) | 1/2 (50) | 42/46 (91.3) | 0.20 |
| Left lower lobe | 46/48 (95.8) | 2/2 (100) | 44/46 (95.7) | 0.92 |
| Anatomic distribution | ||||
| Peripheral (subpleural) predominance | 48/48 (100) | 2/2 (100) | 46/46 (100) | |
| Central/perihilar predominance | 30/48 (62.5) | 1/2 (50) | 29/46 (63) | 0.61 |
| Unilateral | 1/32 (3.1) | 0/1 (0) | 1/31 (3.2) | 0.97 |
| Bilateral | 31/32 (96.9) | 1/1 (100) | 30/31 (96.8) | |
| Attenuation | ||||
| Ground-glass opacity | 40/48 (83.3) | 2/2 (100) | 38/46 (82.6) | 0.69 |
| Mixed (ground-glass opacity and consolidation) | 8/48 (16.7) | 0/2 (0) | 8/46 (17.4) | |
| Crazy paving appearance | 9/48 (18.8) | 0/2 (0) | 9/46 (19.6) | 0.66 |
| Other signs | ||||
| Reticulation | 1/48 (2.1) | 0/2 (0) | 1/46 (2.2) | 0.96 |
| Pleural effusion | 4/48 (8.3) | 1/2 (50) | 3/46 (6.5) | 0.16 |
| Lymphadenopathy | 2/48 (4.2) | 0/2 (0) | 2/46 (4.3) | 0.92 |
IQR=Interquartile range; ACE=Angiotensin-converting-enzyme
Supplementary Table 2.
Complete 13 steps of logistic regression using a backward Wald elimination of variables (response:Outcome)
| Regression coefficient (β) | SE | Wald | df | P | OR | 95% CI for OR (lower-upper) | |
|---|---|---|---|---|---|---|---|
| Step 1 | |||||||
| Age | −0.006 | 0.023 | 0.060 | 1 | 0.81 | 0.994 | 0.950-1.041 |
| Hospitalization period | −0.005 | 0.259 | 0.000 | 1 | 0.98 | 0.995 | 0.599-1.651 |
| Hydroxychloroquine (1) | 5.138 | 2.944 | 3.045 | 1 | 0.08 | 170.338 | 0.531-54631.996 |
| Ribavirin (1) | −1.854 | 4.555 | 0.166 | 1 | 0.68 | 0.157 | 0.000-1180.949 |
| Lopinavir/ritonavir (1) | 0.858 | 1.829 | 0.220 | 1 | 0.64 | 2.359 | 0.065-85.041 |
| Intravenous antibiotics (1) | −1.212 | 3.085 | 0.154 | 1 | 0.69 | 0.298 | 0.001-125.876 |
| Hydroxychloroquine (1) by age by severity (1) | 0.332 | 758.358 | 0.000 | 1 | 1.00 | 1.394 | 0.000 |
| Lopinavir/ritonavir (1) by age by severity (1) | −0.639 | 766.387 | 0.000 | 1 | 1.00 | 0.528 | 0.000 |
| Ribavirin (1) by age by severity (1) | 0.236 | 110.643 | 0.000 | 1 | 1.00 | 1.266 | 0.000-1.91E+94 |
| Diabetes (1) | −2.310 | 1.750 | 1.743 | 1 | 0.19 | 0.099 | 0.003-3.063 |
| Hypertension (1) | 2.513 | 2.062 | 1.485 | 1 | 0.22 | 12.338 | 0.217-702.334 |
| CODP/asthma (1) | 34.177 | 10895.71 | 0.000 | 1 | 1.00 | 6.96E+14 | 0.000 |
| Azithromycin (1) by hydroxychloroquine (1) | −0.087 | 11.366 | 0.000 | 1 | 0.99 | 0.917 | 0.000-4.34E+09 |
| Age by azithromycin (1) by hydroxychloroquine (1) | 0.028 | 0.207 | 0.018 | 1 | 0.89 | 1.028 | 0.685-1.544 |
| Step 2 | |||||||
| Age | −0.006 | 0.023 | 0.056 | 1 | 0.81 | 0.994 | 0.950-1.041 |
| Hospitalization period | −0.005 | 0.259 | 0.000 | 1 | 0.98 | 0.995 | 0.598-1.653 |
| Hydroxychloroquine (1) | 5.153 | 2.953 | 3.046 | 1 | 0.08 | 173.034 | 0.530-56449.67 |
| Ribavirin (1) | −1.880 | 4.550 | 0.171 | 1 | 0.68 | 0.153 | 0.000-1138.985 |
| Lopinavir/ritonavir (1) | 0.823 | 1.828 | 0.202 | 1 | 0.65 | 2.276 | 0.063-81.890 |
| Intravenous antibiotics (1) | −1.183 | 3.091 | 0.146 | 1 | 0.70 | 0.306 | 0.001-131.156 |
| Hydroxychloroquine (1) by age by severity (1) | −0.307 | 110.404 | 0.000 | 1 | 1.00 | 0.735 | 0.000-6.96E+93 |
| Lopinavir/ritonavir (1) by age by severity (1) | 0.237 | 110.404 | 0.000 | 1 | 1.00 | 1.267 | 0.000-1.20E+94 |
| Diabetes (1) | −2.328 | 1.754 | 1.761 | 1 | 0.18 | 0.098 | 0.003-3.035 |
| Hypertension (1) | 2.514 | 2.068 | 1.478 | 1 | 0.22 | 12.349 | 0.215-710.559 |
| CODP/asthma (1) | 34.183 | 10874.87 | 0.000 | 1 | 1.00 | 7.01E+14 | 0.000 |
| Azithromycin (1) by hydroxychloroquine (1) | −0.172 | 11.412 | 0.000 | 1 | 0.99 | 0.842 | 0.000-4.36E+09 |
| Age by azithromycin (1) by hydroxychloroquine (1) | 0.029 | 0.208 | 0.020 | 1 | 0.89 | 1.030 | 0.685-1.549 |
| Step 3 | |||||||
| Age | −0.005 | 0.023 | 0.048 | 1 | 0.83 | 0.995 | 0.950-1.042 |
| Hospitalization period | −0.042 | 0.255 | 0.027 | 1 | 0.87 | 0.959 | 0.582-1.582 |
| Hydroxychloroquine (1) | 4.688 | 2.644 | 3.142 | 1 | 0.08 | 108.594 | 0.609-19351.48 |
| Ribavirin (1) | 0.877 | 3.193 | 0.075 | 1 | 0.78 | 2.403 | 0.005-1254.142 |
| Lopinavir/ritonavir (1) | 0.775 | 1.764 | 0.193 | 1 | 0.66 | 2.171 | 0.068-68.939 |
| Intravenous antibiotics (1) | −0.656 | 2.807 | 0.055 | 1 | 0.82 | 0.519 | 0.002-127.192 |
| Lopinavir/ritonavir (1) by age by severity (1) | −0.117 | 0.057 | 4.245 | 1 | 0.04 | 0.889 | 0.795-0.994 |
| Diabetes (1) | −2.008 | 1.614 | 1.548 | 1 | 0.21 | 0.134 | 0.006-3.175 |
| Hypertension (1) | 2.341 | 2.026 | 1.336 | 1 | 0.25 | 10.395 | 0.196-550.987 |
| CODP/asthma (1) | 22.969 | 8943.755 | 0.000 | 1 | 1.00 | 9.45E+9 | 0.000 |
| Azithromycin (1) by hydroxychloroquine (1) | −0.318 | 10.665 | 0.001 | 1 | 0.98 | 0.727 | 0.000-8.71E+08 |
| Age by azithromycin (1) by hydroxychloroquine (1) | 0.029 | 0.196 | 0.022 | 1 | 0.88 | 1.030 | 0.0701-1.512 |
| Step 4 | |||||||
| Age | −0.011 | 0.021 | 0.284 | 1 | 0.59 | 0.989 | 0.949-1.031 |
| Hospitalization period | 0.000 | 0.208 | 0.000 | 1 | 1.00 | 1.000 | 0.665-1.503 |
| Hydroxychloroquine (1) | 4.509 | 2.263 | 3.968 | 1 | 0.05 | 90.808 | 1.075-7669.183 |
| Ribavirin (1) | −1.436 | 1.434 | 1.003 | 1 | 0.32 | 0.238 | 0.014-3.950 |
| Lopinavir/ritonavir (1) | 1.732 | 1.835 | 0.891 | 1 | 0.35 | 5.651 | 0.155-206.167 |
| Intravenous antibiotics (1) | −0.348 | 2.299 | 0.023 | 1 | 0.88 | 0.706 | 0.008-63.937 |
| Lopinavir/ritonavir (1) by age by severity (1) | −0.088 | 0.030 | 8.904 | 1 | 0.003 | 0.915 | 0.864-0.970 |
| Diabetes (1) | −0.642 | 1.327 | 0.234 | 1 | 0.63 | 0.526 | 0.039-7.092 |
| Hypertension (1) | 0.945 | 1.449 | 0.425 | 1 | 0.51 | 2.573 | 0.150-43.992 |
| Azithromycin (1) by hydroxychloroquine (1) | −0.275 | 10.933 | 0.001 | 1 | 0.98 | 0.760 | 0.000-1.54E+09 |
| Age by azithromycin (1) by hydroxychloroquine (1) | 0.024 | 0.199 | 0.015 | 1 | 0.90 | 1.025 | 0.693-1.514 |
| Step 5 | |||||||
| Age | −0.011 | 0.020 | 0.303 | 1 | 0.58 | 0.989 | 0.950-1.029 |
| Hydroxychloroquine (1) | 4.509 | 2.263 | 3.970 | 1 | 0.05 | 90.816 | 1.077-7661.056 |
| Ribavirin (1) | −1.436 | 1.399 | 1.054 | 1 | 0.31 | 0.238 | 0.015-3.689 |
| Lopinavir/ritonavir (1) | 1.731 | 1.779 | 0.948 | 1 | 0.33 | 5.648 | 0.173-184.408 |
| Intravenous antibiotics (1) | −0.349 | 2.141 | 0.027 | 1 | 0.87 | 0.705 | 0.011-46.833 |
| Lopinavir/ritonavir (1) by age by severity (1) | −0.088 | 0.030 | 8.942 | 1 | 0.003 | 0.915 | 0.864-0.970 |
| Diabetes (1) | −0.642 | 1.301 | 0.244 | 1 | 0.62 | 0.526 | 0.041-6.739 |
| Hypertension (1) | 0.946 | 1.353 | 0.489 | 1 | 0.49 | 2.574 | 0.182-36.487 |
| Azithromycin (1) by hydroxychloroquine (1) | −0.275 | 10.934 | 0.001 | 1 | 0.98 | 0.760 | 0.000-1.54E+09 |
| Age by azithromycin (1) by hydroxychloroquine (1) | 0.024 | 0.199 | 0.015 | 1 | 0.90 | 1.025 | 0.694-1.514 |
| Step 6 | |||||||
| Age | −0.011 | 0.020 | 0.303 | 1 | 0.58 | 0.989 | 0.950-1.029 |
| Hydroxychloroquine (1) | 4.505 | 2.256 | 3.988 | 1 | 0.05 | 90.445 | 1.087-7523.718 |
| Ribavirin (1) | −1.433 | 1.393 | 1.059 | 1 | 0.30 | 0.239 | 0.016-3.657 |
| Lopinavir/ritonavir (1) | 1.730 | 1.777 | 0.948 | 1 | 0.33 | 5.640 | 0.173-183.460 |
| Intravenous antibiotics (1) | −0.353 | 2.135 | 0.027 | 1 | 0.87 | 0.703 | 0.011-46.125 |
| Lopinavir/ritonavir (1) by age by severity (1) | −0.088 | 0.029 | 9.016 | 1 | 0.003 | 0.915 | 0.864-0.970 |
| Diabetes (1) | −0.641 | 1.298 | 0.244 | 1 | 0.62 | 0.527 | 0.041-6.704 |
| Hypertension (1) | 0.948 | 1.349 | 0.494 | 1 | 0.48 | 2.580 | 0.183-36.317 |
| Age by azithromycin (1) by hydroxychloroquine (1) | 0.019 | 0.031 | 0.386 | 1 | 0.53 | 1.020 | 0.959-1.084 |
| Step 7 | |||||||
| Age | −0.011 | 0.020 | 0.301 | 1 | 0.58 | 0.989 | 0.951-1.029 |
| Hydroxychloroquine (1) | 4.228 | 1.465 | 8.334 | 1 | 0.004 | 68.595 | 3.887-1210.632 |
| Ribavirin (1) | −1.387 | 1.352 | 1.052 | 1 | 0.31 | 0.250 | 0.018-3.538 |
| Lopinavir/ritonavir (1) | 1.637 | 1.669 | 0.963 | 1 | 0.33 | 5.142 | 0.195-135.378 |
| Lopinavir/ritonavir (1) by age by severity (1) | −0.088 | 0.029 | 9.023 | 1 | 0.003 | 0.915 | 0.864-0.970 |
| Diabetes (1) | −0.595 | 1.267 | 0.221 | 1 | 0.64 | 0.551 | 0.046-6.605 |
| Hypertension (1) | 0.876 | 1.278 | 0.470 | 1 | 0.49 | 2.401 | 0.196-29.374 |
| Age by azithromycin (1) by hydroxychloroquine (1) | 0.019 | 0.031 | 0.374 | 1 | 0.54 | 1.019 | 0.959-1.084 |
| Step 8 | |||||||
| Age | −0.014 | 0.019 | 0.503 | 1 | 0.48 | 0.986 | 0.950-1.024 |
| Hydroxychloroquine (1) | 4.283 | 1.454 | 8.683 | 1 | 0.003 | 72.486 | 4.197-1251.864 |
| Ribavirin (1) | −1.316 | 1.354 | 0.943 | 1 | 0.33 | 0.268 | 0.019-3.816 |
| Lopinavir/ritonavir (1) | 1.804 | 1.646 | 1.201 | 1 | 0.27 | 6.074 | 0.241-152.889 |
| Lopinavir/ritonavir (1) by age by severity (1) | −0.093 | 0.030 | 9.905 | 1 | 0.002 | 0.911 | 0.860-0.966 |
| Hypertension (1) | 0.740 | 1.240 | 0.357 | 1 | 0.55 | 2.096 | 0.185-23.798 |
| Age by azithromycin (1) by hydroxychloroquine (1) | 0.014 | 0.028 | 0.246 | 1 | 0.62 | 1.014 | 0.960-1.072 |
| Step 9 | |||||||
| Age | −0.015 | 0.019 | 0.572 | 1 | 0.45 | 0.985 | 0.949-1.024 |
| Hydroxychloroquine (1) | 4.421 | 1.440 | 9.427 | 1 | 0.002 | 83.165 | 4.947-1398.057 |
| Ribavirin (1) | −1.214 | 1.336 | 0.826 | 1 | 0.36 | 0.297 | 0.022-4.071 |
| Lopinavir/ritonavir (1) | 1.842 | 1.656 | 1.237 | 1 | 0.27 | 6.307 | 0.246-161.963 |
| Lopinavir/ritonavir (1) by age by severity (1) | −0.096 | 0.029 | 10.66 | 1 | 0.001 | 0.909 | 0.858-0.962 |
| Hypertension (1) | 0.970 | 1.170 | 0.687 | 1 | 0.41 | 2.638 | 0.266-26.141 |
| Step 10 | |||||||
| Hydroxychloroquine (1) | 3.768 | 1.121 | 11.30 | 1 | 0.001 | 43.299 | 4.814-389.415 |
| Ribavirin (1) | −0.868 | 1.235 | 0.494 | 1 | 0.48 | 0.420 | 0.037-4.725 |
| Lopinavir/ritonavir (1) | 1.029 | 1.211 | 0.722 | 1 | 0.40 | 2.798 | 0.261-30.063 |
| Lopinavir/ritonavir (1) by age by severity (1) | −0.089 | 0.026 | 11.86 | 1 | 0.001 | 0.915 | 0.870-0.962 |
| Hypertension (1) | 0.780 | 1.141 | 0.467 | 1 | 0.49 | 2.181 | 0.233-20.415 |
| Step 11 | |||||||
| Hydroxychloroquine (1) | 3.812 | 1.086 | 12.32 | 1 | <0.001 | 45.248 | 5.388-379.982 |
| Ribavirin (1) | −0.789 | 1.242 | 0.404 | 1 | 0.53 | 0.454 | 0.040-5.183 |
| Lopinavir/ritonavir (1) | 1.159 | 1.173 | 0.977 | 1 | 0.32 | 3.186 | 0.320-31.720 |
| Lopinavir/ritonavir (1) by age by severity (1) | −0.085 | 0.025 | 11.63 | 1 | <0.001 | 0.918 | 0.874-0.964 |
| Step 12 | |||||||
| Hydroxychloroquine (1) | 3.703 | 1.026 | 13.023 | 1 | <0.001 | 40.552 | 5.428-302.931 |
| Lopinavir/ritonavir (1) | 1.063 | 1.126 | 0.891 | 1 | 0.35 | 2.895 | 0.319-26.316 |
| Lopinavir/ritonavir (1) by age by severity (1) | −0.092 | 0.024 | 14.950 | 1 | <0.001 | 0.912 | 0.871-0.956 |
| Step 13 | |||||||
| Hydroxychloroquine (1) | 4.125 | 0.983 | 17.609 | 1 | <0.001 | 61.859 | 9.009-424.722 |
| Lopinavir/ritonavir (1) by age by severity (1) | −0.081 | 0.020 | 17.300 | 1 | <0.001 | 0.922 | 0.887-0.958 |
OR=Odds ratio; CI=Confidence interval; SE=Standard deviation
Acknowledgments
We appreciate all the hospital staff for their support and dedication to patients' care, and all the patients who consented to their information are reported.
REFERENCES
- 1.Greenberg SB. Update on human rhinovirus and coronavirus infections. Semin Respir Crit Care Med. 2016;37:555–71. doi: 10.1055/s-0036-1584797. [DOI] [PMC free article] [PubMed] [Google Scholar]
- 2.Ksiazek TG, Erdman D, Goldsmith CS, Zaki SR, Peret T, Emery S, et al. A novel coronavirus associated with severe acute respiratory syndrome. N Engl J Med. 2003;348:1953–66. doi: 10.1056/NEJMoa030781. [DOI] [PubMed] [Google Scholar]
- 3.Arabi Y, Balkhy H, Hayden F, Bouchama A, Luke T, Baillie J, et al. Middle east respiratory syndrome. N Engl J Med. 2017;376:584–94. doi: 10.1056/NEJMsr1408795. [DOI] [PMC free article] [PubMed] [Google Scholar]
- 4.Zhuang Z, Zhao S, Lin Q, Cao P, Lou Y, Yang L, et al. Preliminary estimation of the novel coronavirus disease (COVID-19) cases in Iran: A modelling analysis based on overseas cases and air travel data. Int J Infect Dis. 2020;94:29–31. doi: 10.1016/j.ijid.2020.03.019. [DOI] [PMC free article] [PubMed] [Google Scholar]
- 5.Tuite AR, Bogoch II, Sherbo R, Watts A, Fisman D, Khan K. Estimation of coronavirus disease 2019 (COVID-19) burden and potential for international dissemination of infection from Iran. Ann Intern Med. 2020;172:699–701. doi: 10.7326/M20-0696. [DOI] [PMC free article] [PubMed] [Google Scholar]
- 6.Guan WJ, Ni ZY, Hu Y, Liang WH, Ou CQ, He JX, et al. Clinical characteristics of coronavirus disease 2019 in China. N Engl J Med. 2020;382:1708–20. doi: 10.1056/NEJMoa2002032. [DOI] [PMC free article] [PubMed] [Google Scholar]
- 7.Wang D, Hu B, Hu C, Zhu F, Liu X, Zhang J, et al. Clinical characteristics of 138 hospitalized patients with 2019 novel coronavirus-infected pneumonia in Wuhan, China. JAMA. 2020;323:1061–9. doi: 10.1001/jama.2020.1585. [DOI] [PMC free article] [PubMed] [Google Scholar]
- 8.Chen N, Zhou M, Dong X, Qu J, Gong F, Han Y, et al. Epidemiological and clinical characteristics of 99 cases of 2019 novel coronavirus pneumonia in Wuhan, China: A descriptive study. Lancet. 2020;395:507–13. doi: 10.1016/S0140-6736(20)30211-7. [DOI] [PMC free article] [PubMed] [Google Scholar]
- 9.Lipsitch M, Swerdlow DL, Finelli L. Defining the epidemiology of COVID-19 – Studies needed. N Engl J Med. 2020;382:1194–6. doi: 10.1056/NEJMp2002125. [DOI] [PubMed] [Google Scholar]
- 10.Health and Treatment Deputy of the Ministry of Health and Medical Education. Guideline for the Diagnosis and Treatment of COVID-19 in Outpatients and Inpatients. 2020. [Last Accessed 2020 Nov 25]. Available from: http://dme.behdasht.gov.ir/uploads/Felo_Tashkish.pdf .
- 11.Occupational Safety and Health Administration. Guidance for Preparing Workplaces for COVID-19. (Standard No. 3990-03); 2020. [Last Accessed on 2020 Nov 24]. Available from: https://www.osha.gov/Publications/OSHA3990.pdf .
- 12.Corman VM, Landt O, Kaiser M, Molenkamp R, Meijer A, Chu DK, et al. Detection of 2019 novel coronavirus (2019-nCoV) by real-time RT-PCR. Euro Surveill. 2020;25(3) doi: 10.2807/1560-7917.ES.2020.25.3.2000045. pii=2000045. https://doi.org/10.2807/1560-7917.ES.2020.25.3.2000045. [DOI] [PMC free article] [PubMed] [Google Scholar]
- 13.The Ministry of Health and Medical Education. Death of Two New Coronavirus Patients in Qom; 2020. [Last Accessed on 2020 Nov 15]. Available from: https://behdasht.gov.ir/%D8%A7%D8%AE%D8%A8%D8%A7%D8%B1/%D9%81%D9%88%D8%AA-%D8%AF%D9%88-%D8%A8%DB%8C%D9%85%D8%A7%D8%B1-%D9%85%D8%A8%D8%AA%D9%84%D8%A7-%D8%A8%D9%87-%DA%A9%D8%B1%D9%88%D9%86%D8%A7%D9%88%DB%8C%D8%B1%D9%88%D8%B3-%D8%AC%D8%AF%DB%8C%D8%AF-%D8%AF%D8%B1-%D9%82%D9%85 .
- 14.Gao J, Tian Z, Yang X. Breakthrough: Chloroquine phosphate has shown apparent efficacy in treatment of COVID-19 associated pneumonia in clinical studies. Biosci Trends. 2020;14:72–3. doi: 10.5582/bst.2020.01047. [DOI] [PubMed] [Google Scholar]
- 15.Colson P, Rolain JM, Lagier JC, Brouqui P, Raoult D. Chloroquine and hydroxychloroquine as available weapons to fight COVID-19. Int J Antimicrob Agents. 2020;55:105932. doi: 10.1016/j.ijantimicag.2020.105932. [DOI] [PMC free article] [PubMed] [Google Scholar]
- 16.Cao B, Wang Y, Wen D, Liu W, Wang J, Fan G, et al. A trial of lopinavir-ritonavir in adults hospitalized with severe COVID-19. N Engl J Med. 2020;382:1787–99. doi: 10.1056/NEJMoa2001282. [DOI] [PMC free article] [PubMed] [Google Scholar]
- 17.Gautret P, Lagier JC, Parola P, Hoang VT, Meddeb L, Mailhe M, et al. Hydroxychloroquine and azithromycin as a treatment of COVID-19: Results of an open-label non-randomized clinical trial. Int J Antimicrob Agents. 2020;56:105949. doi: 10.1016/j.ijantimicag.2020.105949. [DOI] [PMC free article] [PubMed] [Google Scholar]
- 18.Lan L, Xu D, Ye G, Xia C, Wang S, Li Y, et al. Positive RT-pcr test results in patients recovered from COVID-19. JAMA. 2020;323:1502–3. doi: 10.1001/jama.2020.2783. [DOI] [PMC free article] [PubMed] [Google Scholar]
- 19.Zhang JF, Yan K, Ye HH, Lin J, Zheng JJ, Cai T. SARS-CoV-2 turned positive in a discharged patient with COVID-19 arouses concern regarding the present standards for discharge. Int J Infect Dis. 2020;97:212–4. doi: 10.1016/j.ijid.2020.03.007. [DOI] [PMC free article] [PubMed] [Google Scholar]
- 20.World Health Organization. Rational Use of Personal Protective Equipment for Coronavirus Disease 2019 (COVID-19): Interim Guidance. 2020. [Last Accessed on 2020 Dec 01]. Available from: https://apps.who.int/iris/bitstream/handle/10665/331215/WHO-2019-nCov-IPCPPE_use-2020.1-eng.pdf .
- 21.Mao L, Jin H, Wang M, Hu Y, Chen S, He Q, et al. Neurologic Manifestations of Hospitalized Patients With Coronavirus Disease 2019 in Wuhan, China. JAMA Neurol. 2020;77(6):683. doi: 10.1001/jamaneurol.2020.1127. doi: 10.1001/jamaneurol.2020.1127. [DOI] [PMC free article] [PubMed] [Google Scholar]
- 22.Zhou F, Yu T, Du R, Fan G, Liu Y, Liu Z, et al. Clinical course and risk factors for mortality of adult inpatients with COVID-19 in Wuhan, China: A retrospective cohort study. Lancet. 2020;395:1054–62. doi: 10.1016/S0140-6736(20)30566-3. [DOI] [PMC free article] [PubMed] [Google Scholar]
- 23.Tabrizi R, Lankarani K, Nowrouzi-sohrabi P, Shabani-Borujeni M, Rezaei S, Hosseini-bensenjan M, et al. The role of comorbidities and clinical predictors of severe disease in COVID-19: a systematic review and meta-analysis. MedRxiv. 2020 Jan 1; doi: 10.1101/2020.04.21.20074633. [Google Scholar]
- 24.Cheng Y, Luo R, Wang K, Zhang M, Wang Z, Dong L, et al. Kidney disease is associated with in-hospital death of patients with COVID-19. Kidney Int. 2020;97(5):829–838. doi: 10.1016/j.kint.2020.03.005. DOI: 10.1016/j.kint.2020.03.005. [DOI] [PMC free article] [PubMed] [Google Scholar]
- 25.Li K, Wu J, Wu F, Guo D, Chen L, Fang Z, et al. The clinical and chest CT features associated with severe and critical COVID-19 pneumonia. Investig Radiol. 2020;55:327–31. doi: 10.1097/RLI.0000000000000672. [DOI] [PMC free article] [PubMed] [Google Scholar]
- 26.Xu Y, Dong J, An W, Lv X, Yin X, Zhang J, et al. Clinical and computed tomographic imaging features of novel coronavirus pneumonia caused by SARS-CoV-2. J Infect. 2020;80:394–400. doi: 10.1016/j.jinf.2020.02.017. [DOI] [PMC free article] [PubMed] [Google Scholar]