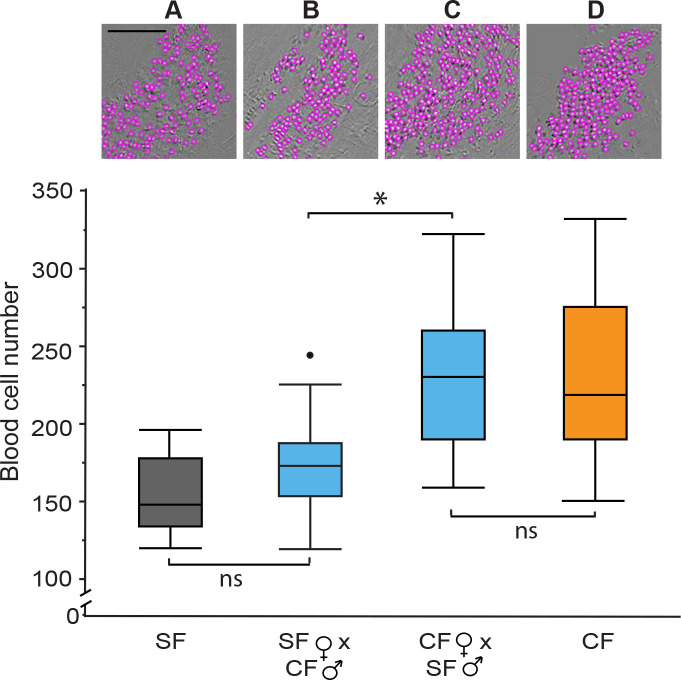
Figure 4. Maternal control of increased blood cells in cavefish determined by reciprocal hybridizations.
Video imaging in the Duct of Cuvier and blood cell quantification at 34 hpf in the F1 progeny of a (A) surface fish (SF) X SF control cross, (B) a SF female X cavefish (CF) male cross, (C) a CF female X SF male cross, and (D) a CF X CF control cross. (A–D) Top row. Representative images of blood cell number aligned with box plots below. Scale Bar is 100 µm; magnifications are the same in each frame. Bottom row. Boxplots of blood cell numbers showing medians, quartiles, min-max values, and outliers (dots). Asterisks: p < 0.05. ns: not significant. N = 20 for each box plot. Statistics by Wilcoxon/Kruskal-Wallis Rank Sums test followed by Wilcoxon for each pair.

