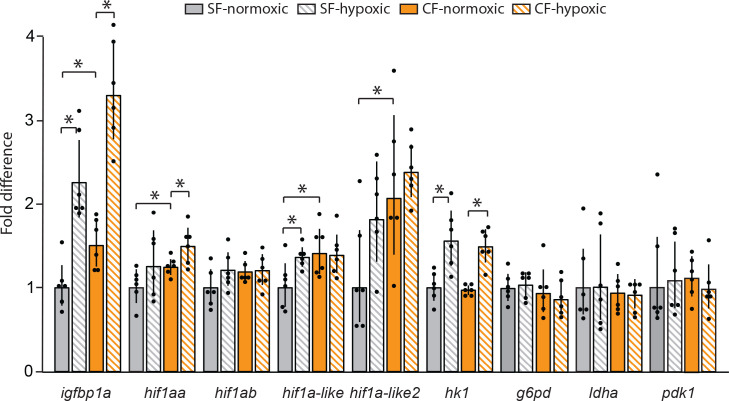
Figure 7. Changes in expression of some of the key HIF pathway genes in surface fish and cavefish exposed to hypoxia (1 mg/L oxygen) or normoxia.
Bars indicate qPCR fold difference over surface fish in normoxic condition. Error bars: range of fold change. Asterisks from left to right: p < 0.0001, p < 0.0001, p = 0.0044, p = 0.0306, p = 0.453, p = 0.0155, p = 0.0083, p = 0.0306, p = 0.0002, and p = 0.0003. N = 6 for each determination. Statistics by one-way ANOVA followed by Student’s t-test (igfbp1a, hif1ab, hif1a-like, hif1a-like2, hk1, g6pd, ldha, pdk1) or with unequal variance by Wilcoxon/Kruskal-Wallis Rank Sums test followed by Wilcoxon for each pair (hif1aa).

