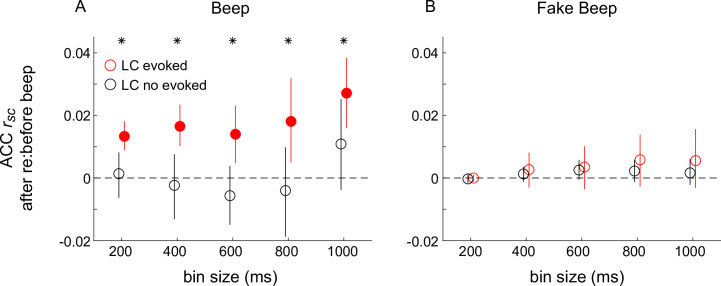
Figure 7. Differences in correlated activity in anterior cingulate cortex (ACC) in response to startling events, conditioned on locus coeruleus (LC) spiking.
(A) Beep-related difference in ACC rsc for trials in which LC had a transient response relative to trials in which LC had no transient response, plotted as a function of the bin size used to count spikes in ACC. Circles and vertical lines are median and bootstrapped 95% confidence estimates across the given set of ACC pairs. (B) Data from ‘fake-beep trials’ (trials with no beep but sorted according to whether or not there was a transient increase in LC spiking comparable in magnitude to the beep-evoked response), plotted as in (A). In both panels, asterisks indicate Mann–Whitney U-test for H0: median difference in ACC rsc (after relative to before the beep or ‘fake-beep’) between the two groups (LC-evoked and no-evoked) is different for the given time bin, p < 0.05 for both monkeys’ data pooled together; filled circles indicate sign-rank test for H0: ACC rsc differences (after relative to before the beep) within each group is different from zero, p < 0.05 for both monkeys’ data pooled together.


