Abstract
Municipal solid waste (MSW) management is known as one of the most crucial activities in municipalities that requires large amounts of fixed/variable and investment costs. The operational processes of collection, transportation and disposal include the major part of these costs. On the other hand, greenhouse gas (GHG) emission as environmental aspect and citizenship satisfaction as social aspect are also of particular importance, which are inevitable requirements for MSW management. This study tries to develop a novel mixed-integer linear programming (MILP) model to formulate the sustainable periodic capacitated arc routing problem (PCARP) for MSW management. The objectives are to simultaneously minimize the total cost, total environmental emission, maximize citizenship satisfaction and minimize the workload deviation. To treat the problem efficiently, a hybrid multi-objective optimization algorithm, namely, MOSA-MOIWOA is designed based on multi-objective simulated annealing algorithm (MOSA) and multi-objective invasive weed optimization algorithm (MOIWOA). To increase the algorithm performance, the Taguchi design technique is employed to set the parameters optimally. The validation of the proposed methodology is evaluated using several problem instances in the literature. Finally, the obtained results reveal the high efficiency of the suggested model and algorithm to solve the problem.
Keywords: Sustainable waste collection, Municipal solid waste, Periodic capacitated arc routing problem, Multi-objective simulated annealing, Multi-objective invasive weed optimization algorithm, Taguchi design
Introduction
Sustainable waste management (SWM) mainly tries to address three pillars of economy, environment and social in operational (collection, transportation and disposal) activities and minimize the amount of municipal solid waste (MSW) that is generated and disposed. According to reports from the United Nations, about 11.2 billion tonnes of MSW is generated and collected throughout the world such that almost all of which originates from humans (Bolingbroke et al., 2021). Hence, managers should concurrently manage this waste and come up with efficient strategies to tackle this issue sustainably. SWM consists of any process involved in the organization of MSW, from generation to final disposal. At a higher level, the main goals of SWM systems are to minimize the amounts of natural resources consumed and maximize reusing of the materials extracted from nature. Operational activities include the most critical elements of SWM systems in which economic, environmental and social aspects should be scrutinized (Seadon, 2010; Xu & Yeh, 2017).
Recently, a few researchers have been trying to address to sustainable MSW collection through vehicle routing problems (VRPs) (Ghannadpour et al., 2021; Inghels et al., 2016; Lin & Kernighan, 1973; Lou et al., 2020; Paletta & Triki, 2004), location-routing problems (LRPs) (Tirkolaee et al., 2021) and inventory-routing problems (IRPs) (Cárdenas-Barrón et al., 2019) within a given network. On the other hand, the application of arc routing problems (ARPs) in SWM was neglected even though it is a well-known type of routing problems that has been specifically studied to formulate the vehicle routing operations in waste collection, snow removal of streets, street painting and other street-related services (de Armas et al., 2019; Foulds et al., 2015). This type of routing was firstly introduced by Golden and Wang (1981), which is a specific area of VRP. Furthermore, ARP is known as an extension of the Chinese Postman Problem (CPP) which can be found in many studies such as Pearn (1994), Filipiak et al. (2009) and Çodur and Yılmaz (2020).
The most important research works on ARP and in the field of municipal solid waste management are summarized as follows. Sniezek and Bodin (2006) employed two mixed integer programming (MIP) techniques to formulate the capacitated arc routing problem (CARP) for residential sanitation collection. They incorporated the vehicle/site dependencies into the model and then investigated several examples. Bautista et al. (2008) modified the ARP by applying changes to the node routing to solve the waste collection problem in the municipality of a town of Barcelona. These changes were due to road constraints such as no U-turn to return from the edge. They solved the problem using the ACS algorithm, which was based on the nearest-neighborhood and closest-placement methods. Rodrigues and Soeiro Ferreira (2015) developed a mixed CARP for the collection and transportation of municipal waste. They considered a heterogeneous fleet of vehicles and multiple disposal sites in the proposed problem and solved the problem by CPLEX solver using benchmark problems. Tirkolaee et al. (2016) applied an SA algorithm to solve the robust CARP under fuzzy demand for urban waste collection. To improve the performance of the proposed algorithm, they employed the Taguchi design method to tune the algorithm parameters and evaluated the performance of the algorithm compared to the CPLEX solver. A comprehensive review of ARP was conducted by Mourão and Pinto (2017) which considers the most important researches from 2010 to 2017. Tirkoaee et al. (2018a) developed a robust CARP to solve the urban waste collection problem by considering driver and crew shifts. They designed random examples and solved them by an exact method and SA algorithm in order to validate the applicability of the proposed mathematical model. A hybrid genetic algorithm (GA) was developed by Tirkolaee et al. (2018b) to solve the multi-trip capacitated green ARP to collect MSW. To test the applicability of the proposed algorithm, they generated several random examples in different sizes and evaluated the results compared to the CPLEX solver. Tirkoaee et al. (2019a) offered a MILP formulation for the problem of multi-trip CARP for urban waste collection. To solve the problem, they developed an improved max-mini ant system (MMAS) algorithm and evaluated the performance of the algorithm in comparison with the heuristic algorithms and the simplified version of the max–min ant colony optimization algorithm by benchmark samples. Recently, several studies have been done in the area of uncertainty. A robust bi-objective MILP model was introduced by Tirkoaee et al. (2019b) for multi-period multi-trip CARP under fuzzy demand. The model aimed to minimize the total cost and the longest travelled distance of vehicles simultaneously. They implemented multi-objective invasive weed optimization (MOIWO) algorithm and ε-constraint method to treat the problem. Tirkoaee et al. (2020) developed an improved hybrid ant colony optimization (ACO) algorithm to solve the multi-trip CARP under fuzzy demand for urban waste collection. They applied their proposed model on a real case study problem in Iran. Keenan et al. (2021) offered a strategic oscillation simheuristic to solve a time-capacitated ARP under stochastic demand which is applicable to waste collection problem. They tested the efficiency of the algorithm using a set of numerical experiments and against existing algorithms. Recently, a comprehensive review was conducted by De Maio et al. (2021) to survey the most important studies in the literature addressing different applications of ARP under uncertainty, particularly waste collection problem.
To the best of our knowledge and according to the above survey, there is no study in the literature addressing sustainable waste collection ARP. Furthermore, there are only a few number of studies that incorporated the sustainable development concept in their waste collection problems. In this study, providing a sustainable waste collection and transportation system requires the study of conflicts and trade-offs between economic, environmental and social objectives subject to the main operating constraints. To this end, total cost minimization, total pollution minimization, total job opportunity maximization and workload deviation minimization are taken into account to address these objectives, respectively. An efficient methodology including mathematical model and solution techniques is designed treat the problem. Accordingly, a tri-objective novel mixed-integer linear programming (MILP) model is developed to formulate a sustainable periodic capacitated arc routing problem (PCARP). To tackle the complexity of the problem efficiently, a hybrid multi-objective optimization algorithm, namely, MOSA-MOIWOA is designed and then tested against the ε-constraint method using different well-known indexes. Moreover, the Taguchi design method is employed to provide a higher efficiency for the proposed algorithm.
The remaining sections of the paper are structured as follows. Section 2 explains the problem and the main assumptions of the model. Moreover, the proposed mathematical model is given in this section. Section 3 introduces the proposed solution techniques. The results and comparative analyses are given in Sect. 4. Finally, Sect. 5 concludes the study and suggest a useful outlook for future studies.
Problem description
This section introduces the sustainable PCARP and its specific characteristics. The operational objective is to find the optimal number of required waste-collection vehicles among a fleet of homogeneous vehicles as well as constructing the optimal planning of routes. The sustainability is addressed by studying its three main aspects (economic, environmental and social) as separate objective functions in the proposed model. The first objective function seeks to minimize the total cost including the traversing costs and usage costs of vehicles. Total pollution emission is taken into account as the second objective function to be minimized. The third objective function is to maximize job opportunities through increasing the number of hired labor. Finally, total workload deviation of drivers and crew is minimized as the fourth objective function. Accordingly, the sustainability aspect of the problem can be studied.
The proposed network can be displayed by a graph G = (V, E), where V = {1, 2… n} represents the set of nodes and E represents the set of edges. Each pair of nodes constitutes an edge of the network and each edge contains two arcs in opposite directions. Here, each edge in the set E may be a waste edge (required edge) or non-waste edge (traversing edges). Thus, displays the set of required edges so that , where represents the demand of edge in tth period. So, each non-waste edge has a demand equals to 0. Moreover, node number 1 stands for the depot and node number n shows the disposal site.
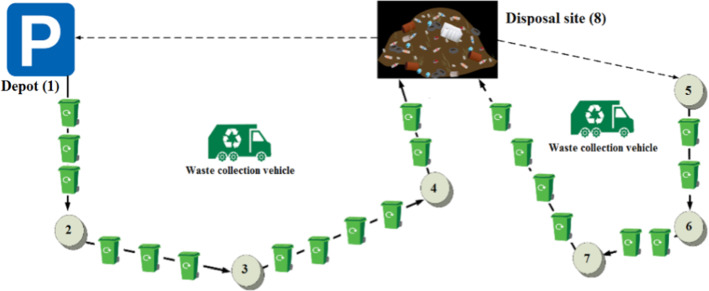
Figure 1 provides a schematic view to the problem.
Fig. 1.
Schematic view of the proposed problem
As can be seen, the suggested MSW collection network in Fig. 1 is composed of seven required edges (1–2, 2–3, 3–4, 4–8, 5–6, 6–7, 7–8), one depot node and one disposal site. As a possible solution for a single planning period, all required edge are covered exactly by one vehicle and two trips. The required and traversing edges are specified by trash bins and dashed lines, respectively. The optimal routing for the first and second trips are 1–2 → 2–3 → 3–4 → 4–8 and 1–8 → 8–7 → 7–6 → 6–5 → 5–8, respectively. Finally, the vehicle moves back to the depot for completing its tour.
The main assumptions of the model are given in the following:
-
I.
Each required edge is covered only by one vehicle.
-
II.
Separate locations are considered for the depot and disposal site in the network.
-
III.
Each vehicle begins its first trip from the depot and end it at the disposal site. Then start its possible 2nd, 3rd,…, pth trips from the disposal site and end at there again.
-
IV.
A fleet of homogeneous vehicles is taken into account.
-
V.
Vehicles have a maximum available service time.
-
VI.
Usage cost of vehicles include drivers’ and crew’s wage cost, fuel cost, hiring cost, etc.
-
VII.
A set of planning periods is regarded to serve the required edges.
-
VIII.
Environmental pollution [greenhouse gas (GHG) emission] is considered for the transportation of waste in urban districts.
-
IX.
Social aspect is studied by maximizing the number of hired labor and minimizing workload deviation.
Now, the main components of the suggested mathematical model including sets and indices, parameters and variables are described in the following.
Sets and Indices
Set of nodes;
Set of edges;
Set of required edges;
Set of homogeneous vehicles;
- P
Set of vehicle trips;
- T
Set of planning periods;
Each possible subset of edges
Set of nodes constituting S
Parameters
Distance of edge
Available capacity for each vehicle
Demand of edge in tth period
Maximum available time for vehicles
A large number,
Traversing time of edge
Usage cost of th vehicle
Conversion factor of distance to cost
Amount of pollution emission released by traversing edge
Number of required workforce (drivers and crew) for each vehicle
Variables
Number of traversing the edge by th vehicle in th trip and tth period
1 if edge is served by th vehicle in th trip and tth period, otherwise 0
1 if th vehicle is employed in tth period, otherwise 0
Total loading time of th vehicle in th trip and tth period
Total unloading time of th vehicle in th trip and tth period
- Total service time of th vehicle in tth period;
Now, the developed MILP formulation of the problem is as follows:
| 1 |
| 2 |
| 3 |
| 4 |
subject to
| 5 |
| 6 |
| 7 |
| 8 |
| 9 |
| 10 |
| 11 |
| 12 |
| 13 |
| 14 |
| 15 |
| 16 |
| 17 |
| 18 |
| 19 |
| 20 |
| 21 |
Objective functions (1), (2), and (3) and (4) stand for the economic, environmental and social aspects, respectively. Objective function (1) minimizes the total waste collection routing cost which is composed of the traversing costs and usage costs of vehicles. Objective function (2) minimizes the total pollution emission released by vehicles. Objective function (3) maximizes the number of hired labor in all periods. Constraint (5) indicates the flow balance in the network for vehicles. Objective function (4) minimizes the workload deviation by balancing the total service time of vehicles in all time periods. In other words, this objective tries to maximize the satisfaction level of workforce. Constraint (6) ensures that required edges are served only by one vehicle. Constraint (7) shows the capacity limitation of vehicles. Constraint (8) states that the required edge can be served by the vehicle traversing it; i.e., vehicles may just traverse an edge without serving it. Constraint (9) indicates that vehicles can be employed if only their usage costs are paid. Constraints (10) and (11) calculate the sum of loading and unloading times for vehicles in each period and trip, respectively. Constraint (12) expresses the maximum available service time for vehicles in each period. Constraint (13) prevents from the potential sub-tours for vehicles in each period and trip. Constraints (14) and (15) form the sequence of vehicles’ trips from 1 to P. Constraints (16) and (17) ensure that the beginning of first trips is the depot and the disposal site is the ending, respectively. Constraints (18) and (19) indicate that if more than one trip is required, the next trips (second, third, fourth, etc.) begin from the disposal site and end at there again. Constraints (20) and (21) display the domain of the variables.
Methodology
This section provides the proposed solution techniques to validate, solve and analyze the proposed problem. Accordingly, MOIWOA-MOSA is designed as a hybrid multi-objective optimization algorithm based on MOIWOA and MOSA. Moreover, the ε-constraint method is implemented to solve the model exactly using CPLEX solver/GAMS software.
Solution representation
In order to design any meta-heuristic algorithm, it is necessary to show how the solutions are represented via a set of vectors or matrices. In this research, a two-part vector is considered for routing of vehicles in each period. The first part includes a permutation of all demand points. In other words, if the number of edges is equal to n, a random order from 2 to n − 1 is created. The second part shows the selected vehicles for each created tour. If a vehicle is used several times, it means that the vehicle has multiple trips.
To interpret this two-part vector, the first vehicle is selected (according to the second part) and based on its capacity, it visits a number of edges (according to the first part) and moves to its final destination. Then the second vehicle is selected from second part and the same process occurs until all the edges are visited. An example with 8 edges and 2 vehicles are depicted in Fig. 2.
Fig. 2.
An example of the solution representation
Heuristic for generating initial solutions
In this section, a heuristic algorithm is developed to yield the initial solutions. The main implementation steps are given as follows:
Step 1 At the starting point of the algorithm, choose the first planning period. Otherwise, if there is any planning period remaining, choose the next planning period among the existing periods and go to Step 2. Otherwise, go to Step 6.
Step 2 Select a vehicle randomly among the existing vehicles to begin the first trip from the depot and go to Step 3.
Step 3 Among the existing required edges, take into account all the required edges that can be added to the trip based on the capacity and available service time limitations of the vehicle, then select one edge with the minimum distance from the depot and go to Step 5. Differently, if there is no eligible required edge fulfilling one of these limitations, move to the disposal site.
Step 4 If the maximum available service time allows the vehicle to build another trip, begin the next trip from the disposal site and go to Step 3, otherwise, go to Step 5.
Step 5 If there is a remaining required edge to be served, go to Step 3. Otherwise, select the shortest path to the disposal site and then go to Step 1.
Step 6 Move to the depot and complete the tour.
Step 7 Report the obtained solution.
MOSA
Simulated annealing (SA) is a local search algorithm with a great sufficiency to prevent from being trapped in local optima. It is very effective for solving non-convex or discrete problems. Therefore, SA is employed to solve integer programming problems efficiently (Glover et al., 2006). From its introduction to the present, SA has represented a high efficiency in solving large combinatorial optimization problems (Kubotani & Yoshimura, 2003). Furthermore, the simplicity of implementation, convergence and hill-climbing for eluding local optima are regarded as the main superiority criteria.
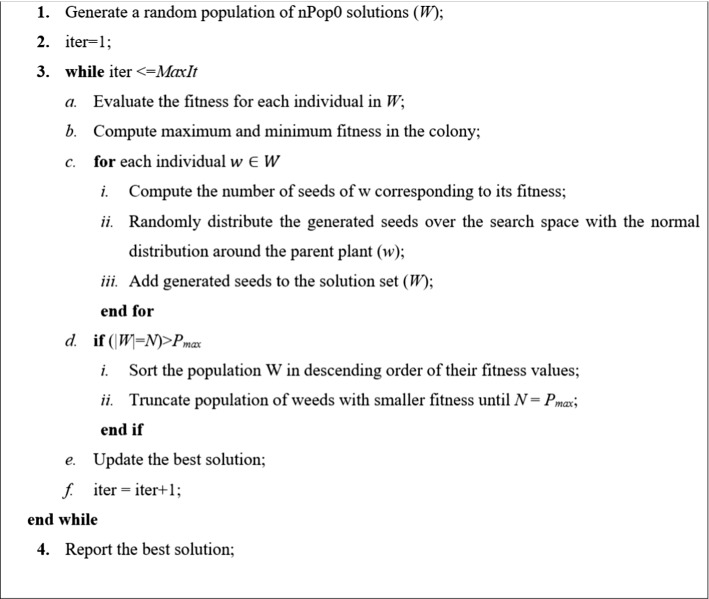
Accordingly, MOSA generates non-dominated solutions through a simple probability function that tries to provide the solutions constituting the Pareto optimal front. Based on this probability function, the total space of objective is covered uniformly generating as a wide range of possible well-dispersed and non-dominated solutions. These characteristics have made MOSA a fast reliable algorithm in comparison with the other existing multi-objective algorithms with a variety of applications. The mechanism of the suggested MOSA is adapted from Nam and Park (2000). The superiority of MOSA against other EAs is that there is no need to employ high memory for keeping the population information. The pseudo-code of the suggested MOSA algorithm is given in Fig. 3.
Fig. 3.
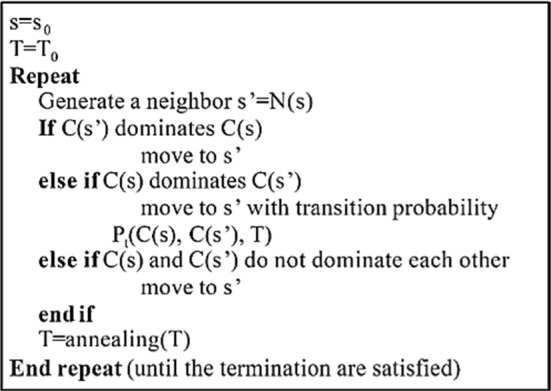
Pseudo-code of the suggested MOSA (Nam & Park, 2000)
In order to create a neighbor solution in the MOSA, first, one of the solution parts is selected randomly. Next, the current values are replaced with new random values. If the first part is selected, a new random permutation is performed. If the second part is selected, one of the vehicles is randomly selected and replaced in each cell. An example of these changes is shown in Fig. 4.
Fig. 4.
An example of creating a neighbor in the proposed MOSA
It should be noted that MOSA is implemented to each initial solution generated by the heuristic algorithm in Sect. 3.2. Finally, we can provide a set of the high-quality initial solutions.
MOIWO
Invasive Weed Optimization algorithm (IWO) is an evolutionary and intelligent algorithm which was inspired by the processes of propagation, adaptability and survival of weeds. It was first introduced by Mehrabian and Lucas (2006) and then has been employed by different researchers to tackle the complexity of optimization problems. The implementation of IWO has a suitable performance for all test functions. To simulate the colonizing behavior of weeds, the main principal features of the process are regarded as follows:
-
i.
A certain number of seeds is spread over the search space.
-
ii.
Each seed grows to a flowering plant and generates childs (seeds) with respect to the fitness value.
-
iii.
The generated seeds are randomly dispersed over the search space and become new plants.
This process is maintained until the maximum number of plants is provided. Thereafter, only the plants with lower fitness values can survive and generate new seeds and the others are ruined. Accordingly, this process maintained until reaching the maximum number of iterations. Finally, the plant with the best fitness value is regarded as the nearest solution to the optimum.
MOIWOA is a multi-objective variant of the IWO algorithm that was first introduced by Nikoofard et al. (2012) and has been extensively employed by researchers (Goli et al., 2019a; 2019b).
The execution steps of MOIWOA are given as follows:
-
Step 1 Generating initial seeds
The initial solutions are called initial seeds. These initial seeds are the output of the MOSA (Sect. 3.3) applied to the solutions generated by the heuristic algorithm (Sect. 3.2).
-
Step 2 Seed reproduction
In this phase, a member of the population is permissible to generate seeds regarding its own and colony’s lowest and highest fitness values according to Eq. (22):
where Smin and Smax denote the minimum and maximum number of seeds, respectively. Furthermore, and represent the worst and best fitness value, respectively. After specifying the number of seeds, reproduction is performed by executing the following sub-steps:22
Sub-step 1 Swap the routing plan for a certain trip of the vehicle by another vehicle in a period.
Sub-step 2 Select two various trips of two vehicles randomly. If there is a common edge/edges between these trips, choose one of them randomly, then divide these trips into two parts. The first part of the first trip is combined with the second part of the second trip and the other two parts of the trips are combined. Consequently, two new trips are generated.
Sub-step 3 Select two trips of a vehicle randomly. If there are two common edges among them, exchange the sequences of the common edges.
Sub-step 4 Select an edge in a trip of vehicle randomly and reverse its direction.
Sub-step 5 Select a part of a trip randomly and reverse the direction of the included edges.
An example of seed reputation in the proposed MOIWOA is provided in Fig. 5.
Fig. 5.
An example of seed reputation in MOIWOA
-
Step 3: Competitive exclusion
The maximum number of plants can be provided by fast reproduction after several iterations, nevertheless, it is expected that the desired plants are re-generated more than the undesired ones. Moreover, it is critical to reach the maximum number of plants (pmax) to efficiently handle the speed of MOIWOA (Goli et al., 2019a). In this stage, the solutions are sorted based on the non-dominate sorting technique that is described in the following. The weaker solutions are removed to keep pmax solutions for the next step.
-
Step 4: Non-dominate sorting
The following parameters are quantified for each solution in order to rank a set of solutions: np as the number of solutions and Sp as the set of solutions dominated by solution p.
According to this technique, the value of crowding distances is the basic factor for sorting the solutions, which is calculated by Eq. (23):
| 23 |
where and stand for the maximum and minimum value of mth objective. Here, and show the value of mth objective for the next and previous solution of jth solution according to the sorted value of mth objective function, respectively.
Finally, the pseudo-code of the suggested MOIWOA is given by Fig. 6.
Fig. 6.
Pseudo-code of the suggested MOIWOA (Goli et al., 2019a)
MOIWOA-MOSA
The hybrid algorithm of this study works by generating high-quality initial solutions using MOSA to be incorporated into the MOIWOA. Finally, the best possible solution will be found by MOIWOA.
Taguchi design method
As was clarified in the previous sections, MOSA and MOIWOA have several adjustable parameters that can affect the performance and final results. Hence, providing a suitable combination of these parameters can highly enhance the performance and efficiency of the algorithms. Two approaches for performing the test are known (Taguchi et al., 2005): (i) Standard analysis of variance (ANOVA) and (ii) Signal to noise (S/N) ratio. The value of S/N indicates the amount of dispersion around a certain value, or how the obtained solutions have altered over different experiments. To reduce the dispersion of the objective functions as far as possible, S/N ratio plays an important role. This ratio stands for noise factors accompanying controllable parameters.
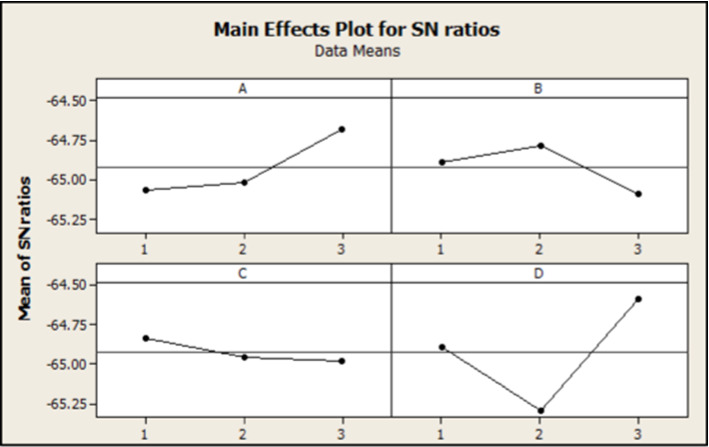
By investigating among different Taguchi tables, the relevant table to L9 is taken into account, which is implemented using Minitab statistical software. The input data is represented in Table 1 and the results of implementing Taguchi design method for MOSA are displayed in Table 2. After applying the test, the optimal values of the parameters of MOSA are given in Table 3 and Fig. 7.
Table 1.
Parameter of the MOSA algorithm
| Parameters | Initial Values | ||
|---|---|---|---|
| 1 | 2 | 3 | |
| Maximum number of Iterations (A) | 100 | 150 | 200 |
| Initial Temperature (B) | 700 | 800 | 900 |
| Temperature reduction rate (C) | 0.9 | 0.95 | 0.99 |
| Boltzman constant (D) | 30 | 50 | 70 |
Table 2.
Results of implementing Taguchi design method for MOSA algorithm
| Run | A | B | C | D | Response (MID) |
|---|---|---|---|---|---|
| 1 | 1 | 1 | 1 | 1 | 1760 |
| 2 | 1 | 2 | 2 | 2 | 1848 |
| 3 | 1 | 3 | 3 | 3 | 1770 |
| 4 | 2 | 1 | 2 | 3 | 1716 |
| 5 | 2 | 2 | 3 | 1 | 1758 |
| 6 | 2 | 3 | 1 | 2 | 1877 |
| 7 | 3 | 1 | 3 | 2 | 1794 |
| 8 | 3 | 2 | 1 | 3 | 1608 |
| 9 | 3 | 3 | 2 | 1 | 1750 |
Table 3.
Optimal value for the parameter of the MOSA algorithm
| Parameters | Optimal values |
|---|---|
| Maximum number of Iterations (A) | 200 |
| Initial temperature (B) | 800 |
| Temperature reduction rate (C) | 0.9 |
| Boltzman constant (D) | 70 |
Fig. 7.
Output results of the Taguchi design for the MOSA algorithm
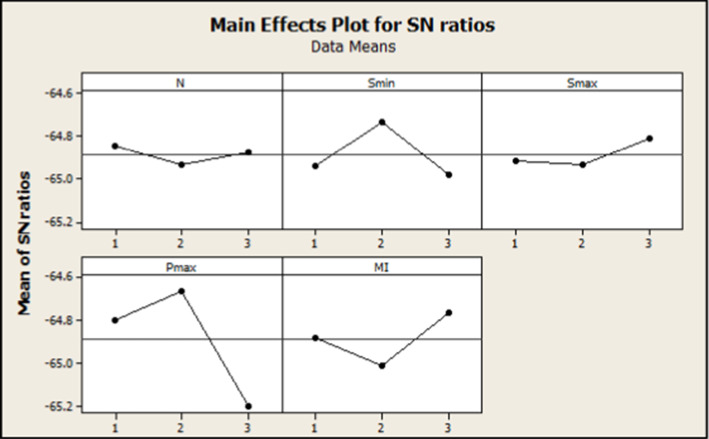
Next, the Taguchi tests applied with MOIWO algorithm using L27. The selected initial value for MOIWO parameters are shown in Table 4. The results of Taguchi method and the optimal values of MOIWO parameters are represented in Fig. 8 and Tables 5 and 6 and Fig. 8 respectively.
Table 4.
Parameter of the MOIWOA
| Parameters | Initial values | ||
|---|---|---|---|
| 1 | 2 | 3 | |
| Initial plant (N) | 10 | 20 | 30 |
| Minimum seed (Smin) | 7 | 9 | 12 |
| Maximum seed (Smax) | 100 | 150 | 200 |
| Maximum plant (Pmax) | 50 | 100 | 150 |
| Maximum iteration (MI) | 100 | 200 | 300 |
Fig. 8.
Output results of the Taguchi design for the MOIWOA algorithm
Table 5.
Results of implementing Taguchi design method for MOIWO algorithm
| Run | N | Smin | Smax | Pmax | MI | Response (MID) |
|---|---|---|---|---|---|---|
| 1 | 1 | 1 | 1 | 1 | 1 | 1861 |
| 2 | 1 | 1 | 1 | 1 | 2 | 1787 |
| 3 | 1 | 1 | 1 | 1 | 3 | 1603 |
| 4 | 1 | 2 | 2 | 2 | 1 | 1600 |
| 5 | 1 | 2 | 2 | 2 | 2 | 1825 |
| 6 | 1 | 2 | 2 | 2 | 3 | 1633 |
| 7 | 1 | 3 | 3 | 3 | 1 | 1812 |
| 8 | 1 | 3 | 3 | 3 | 2 | 1808 |
| 9 | 1 | 3 | 3 | 3 | 3 | 1826 |
| 10 | 2 | 1 | 2 | 3 | 1 | 1897 |
| 11 | 2 | 1 | 2 | 3 | 2 | 1769 |
| 12 | 2 | 1 | 2 | 3 | 3 | 1890 |
| 13 | 2 | 2 | 3 | 1 | 1 | 1688 |
| 14 | 2 | 2 | 3 | 1 | 2 | 1733 |
| 15 | 2 | 2 | 3 | 1 | 3 | 1685 |
| 16 | 2 | 3 | 1 | 2 | 1 | 1711 |
| 17 | 2 | 3 | 1 | 2 | 2 | 1859 |
| 18 | 2 | 3 | 1 | 2 | 3 | 1671 |
| 19 | 3 | 1 | 3 | 2 | 1 | 1699 |
| 20 | 3 | 1 | 3 | 2 | 2 | 1619 |
| 21 | 3 | 1 | 3 | 2 | 3 | 1801 |
| 22 | 3 | 2 | 1 | 3 | 1 | 1896 |
| 23 | 3 | 2 | 1 | 3 | 2 | 1765 |
| 24 | 3 | 2 | 1 | 3 | 3 | 1720 |
| 25 | 3 | 3 | 2 | 1 | 1 | 1653 |
| 26 | 3 | 3 | 2 | 1 | 2 | 1879 |
| 27 | 3 | 3 | 2 | 1 | 3 | 1766 |
Table 6.
Optimal value for the parameter of the MOIWOA
| Parameters | Optimal Values |
|---|---|
| Initial plant (N) | 10 |
| Minimum seed (Smin) | 9 |
| Maximum Seed (Smax) | 200 |
| Maximum plant (Pmax) | 100 |
| Maximum iteration (MI) | 300 |
ε-constraint approach
The ε-constraint approach is known as an effective way to cope with multi-objective optimization problems in the literature, which can generate Pareto solutions. Here, the Pareto front can be achieved by the ε-constraint approach based on Model (24) (Bérubé et al., 2009):
| 24 |
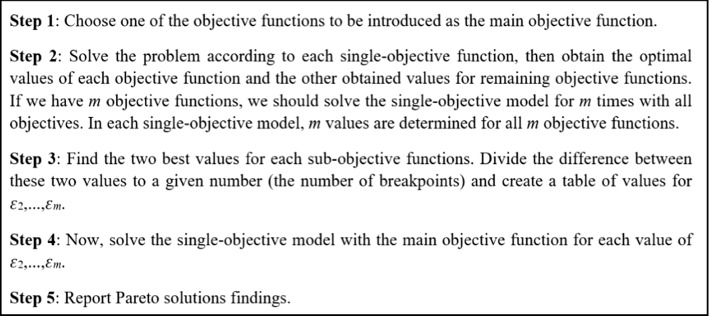
The execution steps of the ε-constraint approach are given in Fig. 9.
Fig. 9.
Execution steps of the proposed ε-constraint
According to the offered ε-constraint method, the first objective function is set to be the main one, and the other objective functions as sub-objective functions. Now, the final formulation relates to the suggested model of the study is displayed in Model (25):
| 25 |
Results
This section provides the model validation and comparisons between the proposed solution techniques through solving 10 problem instances in Tirkolaee et al. (2019b). The parameters took value using a uniform distribution. For example, the demand parameter follows a uniform distribution uniform (1, 4). Moreover, Table 7 shows the input information about the problem instances.
Table 7.
Information of the problem instances
| Problem | No. of nodes | No. of edges | No. of required edges | No. of periods | No. of vehicles |
|---|---|---|---|---|---|
| P1 | 8 | 14 | 9 | 2 | 3 |
| P2 | 10 | 19 | 15 | 3 | 4 |
| P3 | 13 | 29 | 21 | 4 | 5 |
| P4 | 14 | 39 | 27 | 5 | 6 |
| P5 | 15 | 46 | 34 | 6 | 7 |
| P6 | 17 | 56 | 41 | 8 | 8 |
| P7 | 19 | 76 | 55 | 11 | 9 |
| P8 | 21 | 101 | 71 | 13 | 11 |
| P9 | 23 | 151 | 111 | 16 | 13 |
| P10 | 26 | 201 | 151 | 21 | 16 |
The obtained results by the proposed solution techniques are shown in Table 8. With respect to the multi-objective essence of the suggested model, MOSA-MOIWOA and the ε-constraint approach are compared using the mean of ideal distance (MID), number of solutions (NOS), rate of achievement to several objectives (RASO), distancing (D), and CPU time metrics. MID is employed to calculate the mean distance of the Pareto solutions from the ideal solution or the origin of the coordinates. Based on Eq. (25), the lower value of MID indicates more efficiency for the solution methods. Moreover, RAS and D are calculated based on Eqs. (26)–(28).
| 26 |
| 27 |
| 28 |
where represents the mth objective value for the sth solution, and .
Table 8.
Comparisons between MOSA-MOIWOA and ε-constraint
| Problem | ε-constraint (EPC) | MOSA-MOIWOA | ||||||||
|---|---|---|---|---|---|---|---|---|---|---|
| MID | NOS | RASO | D | CPU Time | MID | NOS | RASO | D | CPU Time | |
| P1 | 1047 | 7 | 0.83 | 765.2 | 52.3 | 1100 | 13 | 0.43 | 809.9 | 3.6 |
| P2 | 1240 | 15 | 0.85 | 837.3 | 136.7 | 1370 | 26 | 0.52 | 925.6 | 6.0 |
| P3 | 1820 | 25 | 0.92 | 898.9 | 294.4 | 2081 | 57 | 0.59 | 964.5 | 13.6 |
| P4 | 2535 | 30 | 0.96 | 979.0 | 738.7 | 2870 | 85 | 0.68 | 1101.7 | 19.3 |
| P5 | 3276 | 32 | 0.98 | 1118.5 | 1507.2 | 3168 | 138 | 0.73 | 1149.6 | 25.9 |
| P6 | 4902 | 33 | 0.99 | 1436.2 | 2868.6 | 5481 | 139 | 0.76 | 1603.6 | 34.3 |
| P7 | 6401 | 36 | 0.99 | 1569.5 | 3747.9 | 7054 | 151 | 0.82 | 1560.5 | 44.9 |
| P8 | 7960 | 36 | 0.99 | 1692.2 | 6053.6 | 8069 | 151 | 0.89 | 1661.5 | 57.4 |
| P9 | 8788 | 41 | 0.99 | 2026.7 | 10,000 | 8491 | 151 | 0.99 | 2568.5 | 70.6 |
| P10 | –* | – | – | – | 10,301 | 151 | 0.99 | 3054.0 | 84.8 | |
| Average | 4218.62 | 28.28 | 0.94 | 1258.18 | 2822.15 | 4998.45 | 106.74 | 0.74 | 1539.95 | 36.03 |
*No solution found
Moreover, a run time limitation of 10,000 s is regarded to evaluate the performance of the solution techniques.
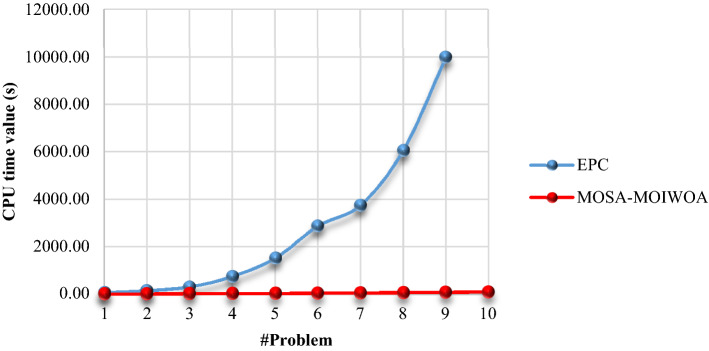
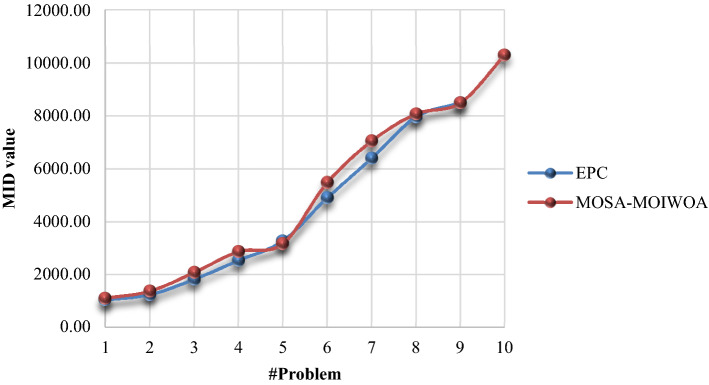
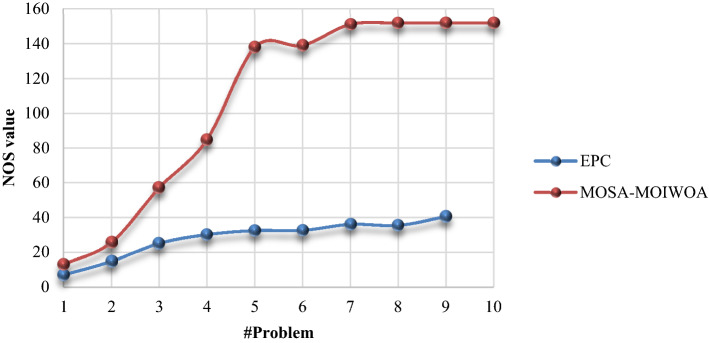
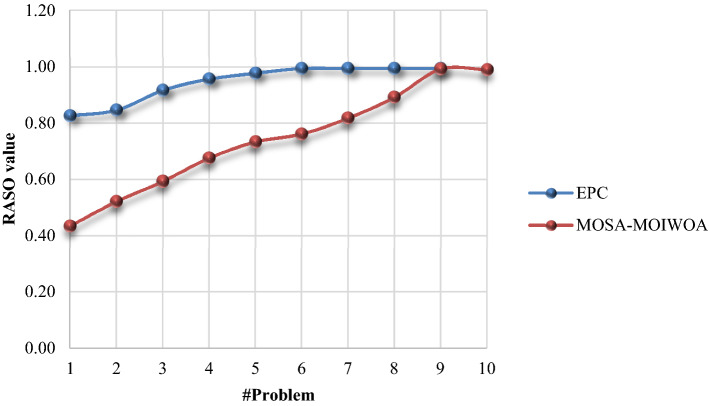
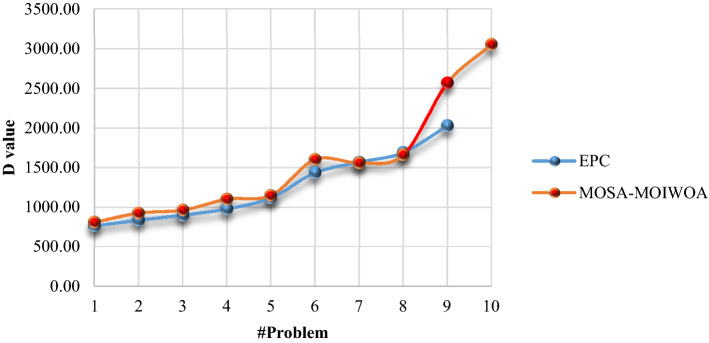
Figures 10, 11 and 12 depict the comparisons for the metrics between solution techniques in different problems.
Fig. 10.
Comparison of CPU time values
Fig. 11.
Comparison of MID values
Fig. 12.
Comparison of NOS values
As can be seen in Table 4, the ε-constraint approach couldn’t solve P10 within the run time limitation of 1000 s due to the complexity of the proposed problem in large sizes and the low efficiency of CPLEX solver to solve it. On the other hand, the suggested MOSA-MOIWOA solved the problem instances in less than 85 s. In fact, the comparison of the average CPU time values for these two solution techniques identifies that the MOSA-MOIWOA just spends about 1.2% of the CPU time required for the ε-constraint approach. Figure 5 represents this comparison trends for the CPU time values.
Moreover, by analyzing the values obtained for the two MID and NOS metrics, the quality of the final solutions can be evaluated. The lower MID and the more NOS reflect a more efficient solution technique. Figure 6 displays that these two solution techniques have a close behavior against each other in terms of MID value. Furthermore, the comparison of NOS values in Fig. 12 demonstrates that the MOSA-MOIWOA has a relatively higher efficiency in this index. In order to complete the comparisons, the trend of RASO and D are illustrated in Figs. 13 and 14.
Fig. 13.
Comparison of RASO values
Fig. 14.
Comparison of D values
As can be seen, the average RASO index in the EPC method and MOSA-MOIWO is 0.94 and 0.74, respectively. Accordingly, it is concluded that the MOSA-MOIWO algorithm has been able to achieve higher quality Pareto solutions. This is while the scattering of Pareto solutions is also of great importance in comparing multi-objective methods (Goli et al., 2020). Accordingly, index D determines the degree of scatter of Pareto solutions. As can be seen in Fig. 14, in all solved problems, the MOSA-MOIWO algorithm has a higher dispersion index than the EPC. Therefore, in general, it is concluded that the designed meta-heuristic algorithm, in addition to the high quality of Pareto solutions, has been able to provide complete coverage of the optimal boundary of the study optimization problem.
The numerical results demonstrate important findings from solving different samples. Due to the high CPU time of the EPC, it can be concluded that the problem is of high complexity. Therefore, MOSA-MOIWO is an efficient method that can solve large-scale problems in a reasonable time. It is also quite obvious that increasing the dimension of the problem leads to a larger value for each objective function. Therefore, it is observed that an upward trend is followed by MID index.
On the other hand, by increasing the dimension of the problem, the solution space also increases, and then, more Pareto solutions can be found. A closer look at RASO index in Fig. 13 and D index in Fig. 14 confirms that the diversity of Pareto solutions is directly related to the problem scale.
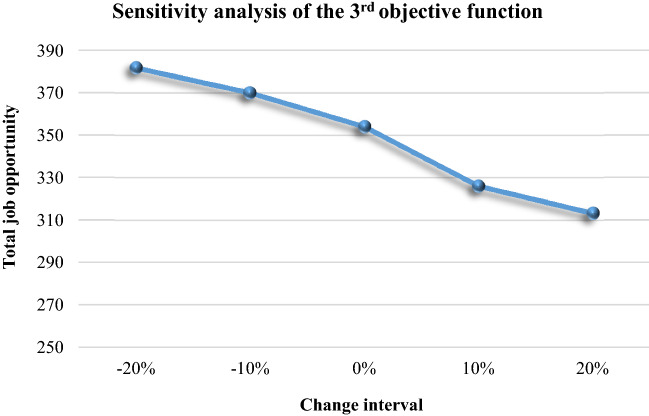
Sensitivity analysis
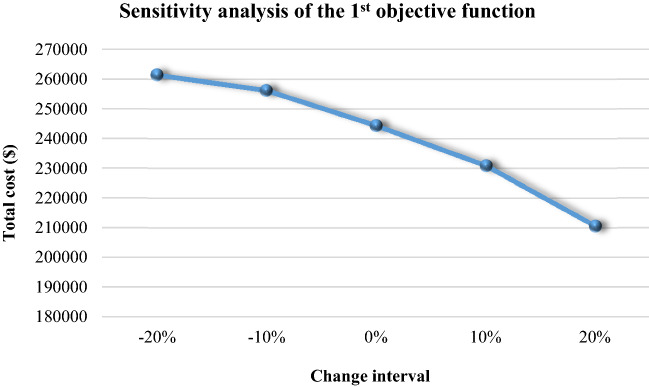
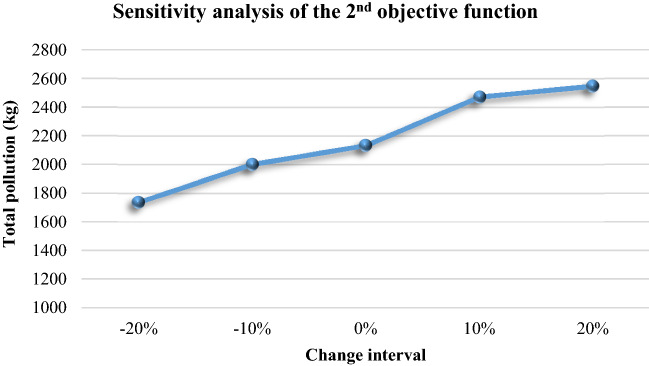
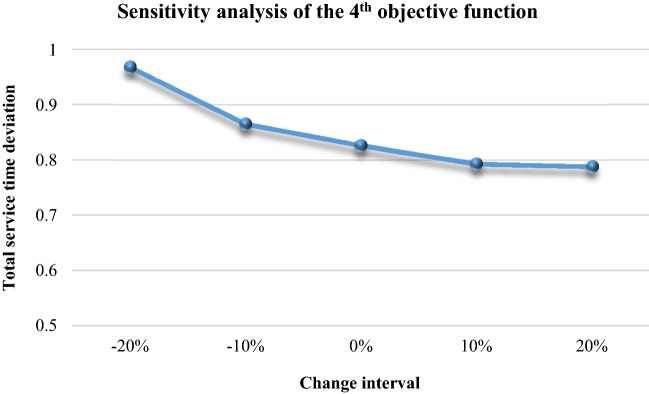
This section provides a sensitivity analysis on P10 as the largest-sized problem that is the closest one to the real-world scale. For this purpose, the parameter of the maximum available service time ( is studied under different change intervals and the behavior of the objective functions is assessed using MOSA-MOIWOA. The obtained results are shown in Table 9 and Figs. 15, 16, 17 and 18.
Table 9.
Obtained results for the sensitivity analysis
| Objective functions | Parameter’s change interval | ||||
|---|---|---|---|---|---|
| − 20% | − 10% | 0% | + 10% | + 20% | |
| Total cost | 261,414.57 | 256,181.05 | 244,315.24 | 230,837.82 | 210,551.35 |
| Total pollution emission | 1736.59 | 2000.18 | 2133.19 | 2472.44 | 2549.07 |
| Total job opportunity | 382 | 370 | 354 | 326 | 313 |
| Total service time deviation | 0.968 | 0.865 | 0.826 | 0.793 | 0.788 |
Fig. 15.
Sensitivity analysis of the 1st objective function
Fig. 16.
Sensitivity analysis of the 2nd objective function
Fig. 17.
Sensitivity analysis of the 3rd objective function
Fig. 18.
Sensitivity analysis of the 4th objective function
As can be seen in Table 9 and Figs. 15, 16, 17 and 18, all objective functions reflect remarkable fluctuations against the changes of , but in various behavioral directions. Accordingly, the 1st, 3rd and 4th objective functions decreased by the increase of . This is due to the generated decrease in the usage costs of vehicles and this reduction leads to a significant decrease in the number of hired labor and also deviation of workload. However, the 2nd objective directly increased by the increase of as it was expected due to more usage of vehicles and less movement from the disposal site to the operational zone.
Table 10 represent different change percentages of the objective functions against the four change intervals considered for . Accordingly, it is revealed that the most increase is related to the 2nd objective function; i.e., total pollution emission, where a 19.50% increase occurs for the 20% increase in . On the other hand, the most decrease is again related to this objective function, where a 18.59% decrease occurs for the 20% decrease in . Overall, increasing the parameter improves the 1st, 3rd and 4th objective functions but it leads to a worse value for the 2nd objective function.
Table 10.
Change percentages of the objective functions against parameter’s change intervals
| Objective functions | Parameter’s change interval | ||||
|---|---|---|---|---|---|
| − 20% | − 10% | 0% | + 10% | + 20% | |
| Total cost | 7.00% | 4.86% | – | − 5.52% | − 13.82% |
| Total pollution emission | − 18.59% | − 6.24% | – | 15.90% | 19.50% |
| Total job opportunity | 7.81% | 4.51% | – | − 7.94% | − 11.52% |
| Total service time deviation | 17.19% | 4.72% | – | − 4.00% | − 4.60% |
Based on the obtained results, managers can investigate these trade-offs to find the optimal level of the resources to be prepared and allocated in the waste collection system. In fact, sensitivity analysis is a useful tool to identify the optimal policy in a real-world situation.
The results of sensitivity analysis can provide useful managerial insights in the design of SWM systems. In the real world, the parameter Tmax is set experimentally and based on historical data. Managers set a specific value for the parameter Tmax according to vehicle fuel consumption, driver fatigue, etc. However, with respect to the analyses conducted in this research, this parameter can have several effects in terms of economic, environmental and social aspects to address the sustainable development. It is true that large values for this parameter reduce routing costs, but create unfavorable conditions in terms of pollution and job opportunities. Therefore, it is necessary to find and set the most appropriate value for Tmax before designing such a MWM system with a complete and accurate perspective.
Conclusions and outlook
This study designed an effective methodology to determine the optimal plans for waste-collection routes and the essential number of vehicles. For this purpose, a novel MILP model was developed to formulate a multi-objective multi-trip sustainable PCARP. The main goals of the problem were to concurrently minimize the total cost, total pollution emission and total workload deviation and also maximize total job opportunity. To validate the proposed mathematical model and cope with its tri-objectiveness, the ε-constraint approach was utilized by CPLEX solver/GAMS software. Moreover, to treat the problem efficiently in large scales, a multi-objective meta-heuristic algorithm, namely, MOSA-MOIWOA was then developed. To enhance the efficiency of the algorithm, the Taguchi design method was also applied to set the parameters. The performance of the MOSA-MOIWOA was then evaluated using various problem instances and three metrics of MID, NOS, D, RASO and CPU time in comparison with the ε-constraint method. The obtained results proved that the MOSA-MOIWOA can provide high-quality solutions within a much shorter CPU time. Moreover, the MID values were close to each other but the proposed algorithm could yield much better NOS value. Eventually, a number of sensitivity analyses were implemented on the maximum available service time of vehicles to assess the behavior of the objective functions and offer useful managerial decision aids. It was obvious that the total cost and total job opportunity have indirect relations with this parameter, but the total pollution emission reflects a direct relation.
According to the main limitations of the study, following suggestions are raised for future research directions:
-
(i)
Considering multiple depots and disposal sites within the network.
-
(ii)
Taking into account the locational decisions for depots and disposal sites, accordingly more environmental and social aspects can be incorporated into the model, such as minimizing proximity to inhabited areas and maximizing work safety at disposal sites, respectively (Sagnak et al., 2021).
-
(iii)
Extending the MSW management network by adding more facilities such as incinerators and recycling/recovery sites.
-
(iv)
Developing the social sustainability by minimizing the number of garbage pick-up to reduce social discomfort of odor presence time or under pandemics outbreak (e.g., COVID-19 (Tirkolaee et al., 2021)).
-
(v)
Studying the effect of milk-run strategy in the problem.
-
(vi)
Applying uncertainty modeling such as fuzzy theory (Tirkolaee et al., 2021), grey systems (Roy et al., 2017), robust optimization (Tirkolaee et al., 2019b), stochastic optimal control (Yılmaz et al., 2020), regime switching (Savku & Weber, 2018).
-
(vii)
Employing other multi-objective algorithms like non-dominated sorting genetic algorithm III (NSGA-III) (Sangaiah et al., 2020).
Footnotes
Publisher's Note
Springer Nature remains neutral with regard to jurisdictional claims in published maps and institutional affiliations.
Change history
3/1/2022
A Correction to this paper has been published: 10.1007/s10479-022-04557-y
Contributor Information
Erfan Babaee Tirkolaee, Email: erfan.babaee@istinye.edu.tr.
Alireza Goli, Email: goli.a@eng.ui.ac.ir.
Selma Gütmen, Email: selma.gutmen@doctorate.put.poznan.pl.
Gerhard-Wilhelm Weber, Email: gerhard.weber@put.poznan.pl.
Katarzyna Szwedzka, Email: katarzyna.szwedzka@put.poznan.pl.
References
- Bautista J, Fernández E, Pereira J. Solving an urban waste collection problem using ants heuristics. Computers & Operations Research. 2008;35:3020–3033. doi: 10.1016/j.cor.2007.01.029. [DOI] [Google Scholar]
- Bérubé JF, Gendreau M, Potvin JY. An exact ϵ-constraint method for bi-objective combinatorial optimization problems: Application to the traveling salesman problem with profits. European Journal of Operational Research. 2009;194(1):39–50. doi: 10.1016/j.ejor.2007.12.014. [DOI] [Google Scholar]
- Bolingbroke D, Ng KTW, Vu HL, Richter A. Quantification of solid waste management system efficiency using input–output indices. Journal of Material Cycles and Waste Management. 2021;23(3):1015–1025. doi: 10.1007/s10163-021-01187-7. [DOI] [Google Scholar]
- Cárdenas-Barrón LE, González-Velarde JL, Treviño-Garza G, Garza-Nuñez D. Heuristic algorithm based on reduce and optimize approach for a selective and periodic inventory routing problem in a waste vegetable oil collection environment. International Journal of Production Economics. 2019;211:44–59. doi: 10.1016/j.ijpe.2019.01.026. [DOI] [Google Scholar]
- Çodur, M.K., & Yılmaz, M. (2020). A time-dependent hierarchical Chinese postman problem. Central European Journal of Operations Research, 1–30.
- De Maio, A., Laganà, D., Musmanno, R., & Vocaturo, F. (2021). Arc routing under uncertainty: Introduction and literature review. Computers & Operations Research, 105442.
- de Armas J, Keenan P, Juan AA, McGarraghy S. Solving large-scale time capacitated arc routing problems: From real-time heuristics to metaheuristics. Annals of Operations Research. 2019;273(1–2):135–162. doi: 10.1007/s10479-018-2777-3. [DOI] [Google Scholar]
- Filipiak KA, Abdel-Malek L, Hsieh HN, Meegoda JN. Optimization of municipal solid waste collection system: Case study. Practice Periodical of Hazardous, Toxic, and Radioactive Waste Management. 2009;13(3):210–216. doi: 10.1061/(ASCE)1090-025X(2009)13:3(210). [DOI] [Google Scholar]
- Foulds L, Longo H, Martins J. A compact transformation of arc routing problems into node routing problems. Annals of Operations Research. 2015;226(1):177–200. doi: 10.1007/s10479-014-1732-1. [DOI] [Google Scholar]
- Ghannadpour SF, Zandieh F, Esmaeili F. Optimizing triple bottom-line objectives for sustainable health-care waste collection and routing by a self-adaptive evolutionary algorithm: A case study from tehran province in Iran. Journal of Cleaner Production. 2021;287:125010. doi: 10.1016/j.jclepro.2020.125010. [DOI] [Google Scholar]
- Glover, F. W., & Kochenberger, G. A. (Eds.). (2006). Handbook of metaheuristics (Vol. 57). Springer.
- Golden BL, Wong RT. Capacitated arc routing problems. Networks. 1981;11(3):305–315. doi: 10.1002/net.3230110308. [DOI] [Google Scholar]
- Goli A, Tirkolaee EB, Malmir B, Bian GB, Sangaiah AK. A multi-objective invasive weed optimization algorithm for robust aggregate production planning under uncertain seasonal demand. Computing. 2019;101(6):499–529. doi: 10.1007/s00607-018-00692-2. [DOI] [Google Scholar]
- Goli A, Zare HK, Tavakkoli-Moghaddam R, Sadegheih A. Multiobjective fuzzy mathematical model for a financially constrained closed-loop supply chain with labor employment. Computational Intelligence. 2020;36(1):4–34. doi: 10.1111/coin.12228. [DOI] [Google Scholar]
- Goli A, Zare HK, Tavakkoli-Moghaddam R, Sadeghieh A. Application of robust optimization for a product portfolio problem using an invasive weed optimization algorithm. Numerical Algebra, Control & Optimization. 2019;9(2):187. doi: 10.3934/naco.2019014. [DOI] [Google Scholar]
- Inghels D, Dullaert W, Vigo D. A service network design model for multimodal municipal solid waste transport. European Journal of Operational Research. 2016;254(1):68–79. doi: 10.1016/j.ejor.2016.03.036. [DOI] [Google Scholar]
- Keenan P, Panadero J, Juan AA, Martí R, McGarraghy S. A strategic oscillation simheuristic for the time capacitated arc routing problem with stochastic demands. Computers & Operations Research. 2021;133:105377. doi: 10.1016/j.cor.2021.105377. [DOI] [Google Scholar]
- Kubotani H, Yoshimura K. Performance evaluation of acceptance probability functions for multi-objective SA. Computers & Operations Research. 2003;30(3):427–442. doi: 10.1016/S0305-0548(01)00109-5. [DOI] [Google Scholar]
- Lin S, Kernighan BW. An effective heuristic algorithm for the traveling-salesman problem. Operations Research. 1973;21(2):498–516. doi: 10.1287/opre.21.2.498. [DOI] [Google Scholar]
- Lou CX, Shuai J, Luo L, Li H. Optimal transportation planning of classified domestic garbage based on map distance. Journal of Environmental Management. 2020;254:109781. doi: 10.1016/j.jenvman.2019.109781. [DOI] [PubMed] [Google Scholar]
- Mehrabian AR, Lucas C. A novel numerical optimization algorithm inspired from weed colonization. Ecological Informatics. 2006;1(4):355–366. doi: 10.1016/j.ecoinf.2006.07.003. [DOI] [Google Scholar]
- Mourão MC, Pinto LS. An updated annotated bibliography on arc routing problems. Networks. 2017;70(3):144–194. doi: 10.1002/net.21762. [DOI] [Google Scholar]
- Nam D, Park CH. Multiobjective simulated annealing: A comparative study to evolutionary algorithms. International Journal of Fuzzy Systems. 2000;2(2):87–97. [Google Scholar]
- Nikoofard AH, Hajimirsadeghi H, Rahimi-Kian A, Lucas C. Multiobjective invasive weed optimization: Application to analysis of Pareto improvement models in electricity markets. Applied Soft Computing. 2012;12(1):100–112. doi: 10.1016/j.asoc.2011.09.005. [DOI] [Google Scholar]
- Paletta G, Triki C. Solving the asymmetric traveling salesman problem with periodic constraints. Networks: an International Journal. 2004;44(1):31–37. doi: 10.1002/net.20011. [DOI] [Google Scholar]
- Pearn WL. Solvable cases of the k-person Chinese postman problem. Operations Research Letters. 1994;16(4):241–244. doi: 10.1016/0167-6377(94)90073-6. [DOI] [Google Scholar]
- Rodrigues AM, Soeiro Ferreira J. Waste collection routing—limited multiple landfills and heterogeneous fleet. Networks. 2015;65(2):155–165. doi: 10.1002/net.21597. [DOI] [Google Scholar]
- Roy SK, Maity G, Weber GW. Multi-objective two-stage grey transportation problem using utility function with goals. Central European Journal of Operations Research. 2017;25(2):417–439. doi: 10.1007/s10100-016-0464-5. [DOI] [Google Scholar]
- Sagnak M, Berberoglu Y, Memis İ, Yazgan O. Sustainable collection center location selection in emerging economy for electronic waste with fuzzy Best-Worst and fuzzy TOPSIS. Waste Management. 2021;127:37–47. doi: 10.1016/j.wasman.2021.03.054. [DOI] [PubMed] [Google Scholar]
- Sangaiah AK, Goli A, Tirkolaee EB, Ranjbar-Bourani M, Pandey HM, Zhang W. Big data-driven cognitive computing system for optimization of social media analytics. IEEE Access. 2020;8:82215–82226. doi: 10.1109/ACCESS.2020.2991394. [DOI] [Google Scholar]
- Savku E, Weber GW. A stochastic maximum principle for a markov regime-switching jump-diffusion model with delay and an application to finance. Journal of Optimization Theory and Applications. 2018;179(2):696–721. doi: 10.1007/s10957-017-1159-3. [DOI] [Google Scholar]
- Seadon JK. Sustainable waste management systems. Journal of Cleaner Production. 2010;18(16–17):1639–1651. doi: 10.1016/j.jclepro.2010.07.009. [DOI] [Google Scholar]
- Sniezek J, Bodin L. Using mixed integer programming for solving the capacitated arc routing problem with vehicle/site dependencies with an application to the routing of residential sanitation collection vehicles. Annals of Operations Research. 2006;144(1):33–58. doi: 10.1007/s10479-006-0006-y. [DOI] [Google Scholar]
- Taguchi G, Chowdhury S, Wu Y. Taguchi's quality engineering handbook. John Wiley and Sons; 2005. [Google Scholar]
- Tirkolaee EB, Abbasian P, Weber GW. Sustainable fuzzy multi-trip location-routing problem for medical waste management during the COVID-19 outbreak. Science of the Total Environment. 2021;756:143607. doi: 10.1016/j.scitotenv.2020.143607. [DOI] [PMC free article] [PubMed] [Google Scholar]
- Tirkolaee EB, Alinaghian M, Bakhshi Sasi M, Seyyed Esfahani MM. Solving a robust capacitated arc routing problem using a hybrid simulated annealing algorithm: A waste collection application. Journal of Industrial Engineering and Management Studies. 2016;3(1):61–76. [Google Scholar]
- Tirkolaee EB, Alinaghian M, Hosseinabadi AAR, Sasi MB, Sangaiah AK. An improved ant colony optimization for the multi-trip capacitated arc routing problem. Computers & Electrical Engineering. 2019;77:457–470. doi: 10.1016/j.compeleceng.2018.01.040. [DOI] [Google Scholar]
- Tirkolaee EB, Goli A, Pahlevan M, Malekalipour Kordestanizadeh R. A robust bi-objective multi-trip periodic capacitated arc routing problem for urban waste collection using a multi-objective invasive weed optimization. Waste Management & Research. 2019;37(11):1089–1101. doi: 10.1177/0734242X19865340. [DOI] [PubMed] [Google Scholar]
- Tirkolaee EB, Hosseinabadi A, Soltani M, Sangaiah A, Wang J. A hybrid genetic algorithm for multi-trip green capacitated arc routing problem in the scope of urban services. Sustainability. 2018;10(5):1366. doi: 10.3390/su10051366. [DOI] [Google Scholar]
- Tirkolaee EB, Mahdavi I, Esfahani MMS. A robust periodic capacitated arc routing problem for urban waste collection considering drivers and crew’s working time. Waste Management. 2018;76:138–146. doi: 10.1016/j.wasman.2018.03.015. [DOI] [PubMed] [Google Scholar]
- Tirkolaee EB, Mahdavi I, Seyyed Esfahani MM, Weber GW. A hybrid augmented ant colony optimization for the multi-trip capacitated arc routing problem under fuzzy demands for urban solid waste management. Waste Management & Research. 2020;38(2):156–172. doi: 10.1177/0734242X19865782. [DOI] [PubMed] [Google Scholar]
- Xu Y, Yeh CH. Sustainability-based selection decisions for e-waste recycling operations. Annals of Operations Research. 2017;248(1–2):531–552. doi: 10.1007/s10479-016-2269-2. [DOI] [Google Scholar]
- Yılmaz F, Bakan HÖ, Weber GW. Strong-order conditions of Runge–Kutta method for stochastic optimal control problems. Applied Numerical Mathematics. 2020;157:470–489. doi: 10.1016/j.apnum.2020.07.002. [DOI] [Google Scholar]


