

Abstract
Direct conversion of cardiac fibroblast into induced cardiomyocytes (iCMs) by forced expression of cardiac transcription factors, such as Mef2c, Gata4, and Tbx5 (MGT), holds great promise for regenerative medicine. The process of cardiac reprogramming consists of waves of transcriptome remodelling events. However, how this transcriptome remodelling is driven by the upstream chromatin landscape alteration is still unclear. In this study, we performed single-cell ATAC-seq (Assay for Transposase-Accessible Chromatin using sequencing) on early reprogramming iCMs given the known epigenetic changes as early as day 3. This approach unveiled networks of transcription factors (TFs) involved in the early shift of chromatin accessibility during cardiac reprogramming. Combining our analysis with functional assays, we identified Smad3 to be a bimodal TF in cardiac reprogramming, a barrier in the initiation of reprogramming and a facilitator during the intermediate stage of reprogramming. Moreover, integrative analysis of scATAC-seq with scRNA-seq data led to the identification of active TFs important for iCM conversion. Finally, we discovered a global rewiring of cis-regulatory interactions of cardiac genes along the reprogramming trajectory. Collectively, our scATAC-seq study and the integrative analysis with scRNA-seq data provided valuable resources to understand the epigenomic heterogeneity and its alteration in relation to transcription changes during early stage of cardiac reprogramming.
Keywords: iCM reprogramming, Cardiac reprogramming, scATAC-seq, Chromatin accessibility, Transcription factors
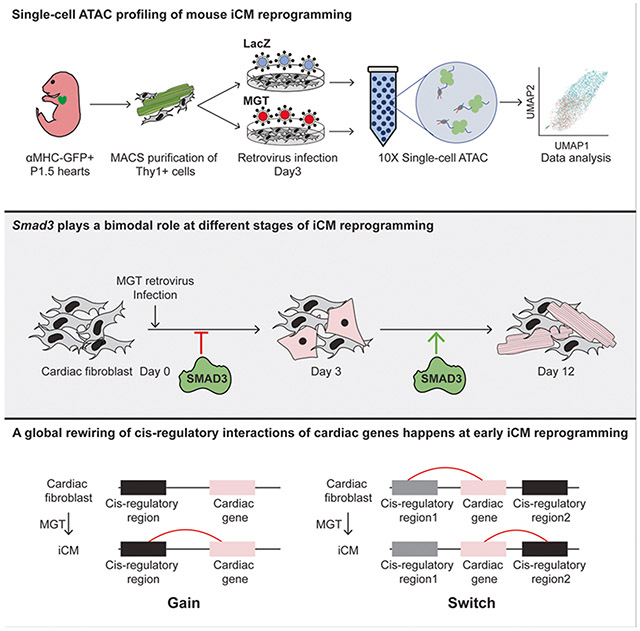
Graphical Abstract
Introduction
Myocardial infarction (MI), also known as heart attack, remains one of the leading causes of death worldwide. Due to the negligible regenerative capacity of the myocardium, the loss of cardiomyocytes is irreversible after MI1. By inducing the expression of three genes (Mef2c, Gata4, and Tbx5, also called MGT), the cardiac fibroblast could be reprogrammed into cardiomyocyte-like cells (iCM) in the infarcted heart, resulting in an improvement in heart function post-MI2,3. During recent years, great advances have been made to understand the molecular mechanism underlying cardiac reprogramming4,5. At the transcriptome level, cardiac reprogramming involves waves of transcription remodelling events, including the fast acquisition of cardiac gene program and the gradual loss of fibroblast molecular signature6-10. However, how this transcription remodelling was driven by the upstream chromatin landscape repatterning remains elusive.
Single-cell assay for transposase-accessible chromatin sequencing (scATAC-seq) is a powerful technology to dissect epigenomic heterogeneity at the single cell level, uncover the differentially accessible cis-regions, and identify the transcription factors that might be responsible for the variability in accessibility profiles during a biological process of interest. Due to the heterogenous and unsynchronized nature of cardiac reprogramming, scATAC-seq is well suited to delineate the chromatin accessibility trajectory of successful cardiac reprogramming and identify the driving force for the cell fate conversion in great details.
In the present study, we utilized scATAC-seq to profile the epigenomic heterogeneity of cardiac reprogramming at the early stage. Through principal curve-based pseudotime trajectory analysis, we observed a drastic reconfiguration of chromatin accessibility, including a rapid opening of cardiac-related cis-regions and the closing of fibroblast-related regions. Moreover, we also identified a set of transient open regions associated with the neurogenic process. Further motif enrichment analysis allowed the identification of a network of transcription factors driving these chromatin reconfigurations and unveiled a bimodal role of Smad3 at different stages of early cardiac reprogramming. In addition, combining scATAC-seq with scRNA-seq at day 3 of iCM conversion, we identified important regulators of cardiac reprogramming, including Tcf21 and Fos. Moreover, we identified gained cis-regulatory regions of cardiac genes along the reprogramming trajectory and revealed a rapid acquisition of H3K27ac-marked active cardiac enhancers at the early stage of reprogramming. Collectively, our scATAC-seq analysis delineated epigenomic remodelling of iCM reprogramming at single-cell level and identified the upstream transcription factors responsible to drive such epigenomic remodelling process.
Results
1.1. Single-cell ATAC profiling of mouse cardiac reprogramming
Previous publications have demonstrated a wide spectrum of cells, from fibroblast, iFib, pre-iCM to iCM, could co-exist in the cell population three days post-infection (d.p.i) of reprogramming factors6. Thus, we performed scATAC-seq on Day 3 MGT-infected (Reprogramming) cardiac fibroblasts (CFs) and LacZ-infected (Mock) CFs to profile the chromatin landscape at this early stage of cardiac reprogramming when fate conversion occurs (Figure 1a). The scATAC-seq libraries passed the quality control (QC) standard. After removing the low-quality cells, we obtained 10,839 MGT-infected and 8,558 LacZ-infected single-cell libraries (Supplementary Figure 1a, Supplementary Figure 1b).
Figure 1. Single-cell ATAC profiling of mouse cardiac reprogramming.

a) Schematic depiction of experiment design. b) UMAP visualization of the 18 clusters of cells. c) Gene activity score of cardiac and fibroblast genes of each cells superimposed onto UMAP visualization of our scATAC-seq libraries. Red represents high gene activity score. Blue represents low gene activity score. d) UMAP visualization labeled with the sample treatment groups (Reprogramming and Mock). e) Bar chart representing the percentage of each cluster in reprogramming and Mock samples.
To identify the cell populations that have been effectively infected with MGT and undergoing cell fate conversion, we combined libraries from the reprogramming and mock group and clustered them into 18 clusters using runKNN function from SnapATAC (Figure 1b)12. To further characterize the molecular feature of these clusters, we identified the differential accessible regions (DARs) specific to each cluster (Supplementary Table 1, Supplementary Figure 1d) and examined the gene activity scores of a list of signature genes of different cell types. Most of the cardiac genes showed increased gene activity score in Cluster 12 (Figure 1c, Supplementary Figure 1c). While for fibroblast genes, consistent with the previous study6, they are extensively enriched in all clusters including Cluster 12, suggesting a delayed shutdown of fibroblast program during early stage of cardiac reprogramming (Figure 1c)6. By superimposing the treatment information (MGT-infected or LacZ-infected) onto the Uniformed Manifold Approximation and Projection (UMAP) clusters, we found that Cluster 12 was mainly constituted of reprogramming cells (Figure 1d). The further comparison of sample composition within each cluster demonstrated a specific enrichment of MGT-infected CFs in Cluster 12 and a loss of these cells in Cluster 2 (Figure 1e). Therefore, for these two clusters, we defined them as the MGT-responsive clusters. To eliminate the uninfected cells in our downstream analysis, we removed all the other clusters with no significant difference in the ratio of MGT-infected cells to Lacz-infected cells within each cluster (Figure 1e). Apart from these two MGT-responsive clusters, we have also observed the presence of endothelial cells (Cluster 3), epi-cardial cells (Cluster 13), and neuron progenitor cells (Cluster 11) representing the heterogeneity of the starting cell population, consistent with previous reports(Supplementary Figure 1e)6,8.
1.2. Chromatin dynamics of cardiac reprogramming along pseudo-temporal trajectory
Next, to infer the chromatin dynamics of cardiac reprogramming process, we constructed the trajectory using cells from Cluster 2 and Cluster 12, the MGT-responsive clusters (Figure 2a) Then we identified the differentially accessible regions (DARs) along the reprogramming trajectory and clustered them into 6 primary trends (Figure 2b, Supplementary Table 2). Comparing to the background (total ATAC-seq peaks), the DARs showed higher enrichment at distal intergenic and introns regions suggesting that the chromatin reconfiguration happened during iCM induction is prone to take place at cis-regulatory elements (Supplementary Figure 2a). Among the 2056 significant DARs identified, 35% of them (Trend 2 and Trend 5) showed gained accessibility during reprogramming while 59% (Trend 3, Trend 4, and Trend 6) lost accessibility. We also identified a cluster of DARs (Trend 1) showing a transient opening during iCM reprogramming. Among the trends that lost accessibility, Trend 6 showed a delayed closing of chromatin compared to Trend 3 and Trend 4. Similarly, in trends that gained accessibility during reprogramming, Trend 5 showed a delayed opening compared to Trend 2. To assess the functions of each trend of DARs, we annotated DARs to their nearest genes and performed gene ontology (GO) analysis on these annotated DARs (Figure 2c). DARs that gained accessibility, such as the enhancers of Ryr2 and Hand1, showed high enrichment of GO terms related to cardiovascular development. DARs in Trend 3, which lost accessibility, were associated with wound healing and cell migration, such as Foxa1’s enhancer. Surprisingly, for DARs in Trend 4 and Trend 6 that also lost accessibility during cardiac reprogramming, we observed a closing down of regions related to neuron program, such as the enhancer of Gap43. Moreover, the transient opened DARs, Trend 1, were also associated with neuron program such as nerve impulse transmission. We then asked whether MGT were involved in the regulation of DARs with different trends. Utilizing a published MGT ChIP-seq dataset during cardiac reprogramming9, we plotted the enrichment of MGT on DARs of different trends separately(Figure 2d). For DARs that gained accessibility either transiently or stably, we observed the co-enrichment of MGT suggesting that MGT functions cooperatively to open up chromatin during cardiac reprogramming. While for DARs that lost accessibility, no or low enrichment of MGT was detected.
Figure 2. Chromatin dynamics of the cardiac reprogramming along Pseudo-temporal trajectory.

a) Pseudotime trajectory of cells from cluster 2 and cluster 12. b) Six trends of differentially accessible regions were identified along our reprogramming trajectory. The number beside each trend represents the number of DARs. c) Gene ontology analysis of differentially accessible regions with different trends. The gene ontology terms were combined based on the similarity of the gene set. Representative DARs of each trend and their accessibility along the pseudotime of cardiac reprogramming were shown on the right side of the plot. d) Average enrichment plot showing the binding of reprogramming factors, Mef2c(Up), Gata4(Mid), and Tbx5(Bottom), on each trend of DARs based on published datasets.
1.3. Networks of active transcription factor during early stage of cardiac reprogramming
Because the chromatin landscape variance is often systematically associated with specific transcription factors, we next set out to identify important transcription factors upstream of chromatin reconfiguration during cardiac reprogramming. First, we divided our reprogramming trajectory into 5 different pseudotime windows and performed motif enrichment analysis on DARs associated with these pseudotime windows (Supplementary table 3). After unsupervised hierarchical clustering, we obtained 6 clusters of motifs that can be split into two large categories, motifs to be lost (TBL, Cluster 1 and Cluster 2) and motifs to be enriched (TBE, Cluster 3, Cluster 4, Cluster 5, and Cluster 6) (Figure 3a, Supplementary Figure 3a). To further identify TF modules within these TBL and TBE motifs, we performed protein-protein interaction network analysis using STRING (Figure 3b)13. The TBL motifs mostly belonged to the FOS-JUN-AP1 complex. TBE motifs can be divided into four modules. Three of them closely interact with three reprogramming factors, such as Gata4 and Smad family TFs, Mef2c and BHLH family TFs. TEAD family proteins, key TFs in the Hippo signalling pathway, belong to the fourth modules identified with no significant interaction to the other three. Notably, both the TEAD and bHLH family TFs were previously reported to promote cardiac reprogramming when overexpressed14,15. Interestingly, in both TBL and TBE motifs, we observed the enrichment of SMAD family TFs (Figure 3a, 3b). SMAD5 is only enriched in the TBE motifs, while both SMAD3 and SMAD4 were identified in both categories. By analysing a published RNA-seq dataset of cardiac reprogramming8, we found that Smad 3/4/5’s expression showed little fluctuation throughout the reprogramming process (Supplementary Figure 3b). To test SMAD family TFs’ role at various stages of early cardiac reprogramming, we performed a time-course knockdown assay of SMAD family TFs at Day 0, Day 3, and Day 5 of iCM reprogramming (Supplementary Figure 3c). Knocking down Smad4 at Day 0 promoted the cardiac reprogramming efficiency suggesting its barrier function. Knocking down Smad5 at Day 3 significantly inhibited iCM reprogramming. Interestingly, knocking down Smad3 at Day 0 resulted in an increase in reprogramming efficiency while knocking down at Day 3 reduced the reprogramming efficiency, suggesting that Smad3 plays a bimodal role at different stages of cardiac reprogramming. To further validate the bimodal role of Smad3, we utilized the dox-inducible shRNA knockdown system. By treating the cells with dox from D0 to D3 or D3 to D12 during the cardiac reprogramming, we found that knocking down of Smad3 from D0 to D3 boosted the cardiac reprogramming efficiency, while knocking down Smad3 from D3 to D12 reduced the reprogramming efficiency (Figure 3c).
Figure 3. Transcription factor networks of cardiac reprogramming.

a) Heatmap showing the motif enrichment along the reprogramming trajectory. The reprogramming trajectory was divided into five bins and then the motif enrichment score was calculated for all the vertebrate motifs in the JASPAR database. Red represents high motif enrichment. Blue represents low motif enrichment. b) Two TF networks important for the fibroblast program and cardiac program. Subnetworks within each TF network were circled by a different color and shaded by gray. c) c) Temporal knockdown of Smad3 reveal its bimodal role during cardiac reprogramming . Y-axis represents Actinin+/cTnT+ Fold Change normalized to empty shRNA vector (shNT). Experiments were performed in biological replicates, n=3. Error-bar represents the standard deviation. Student’s t-test was used for statistical analysis. ** represents p-value <0.01.
1.4. Integrative scATAC-seq and scRNA-seq analysis identified active TFs functioning in cardiac reprogramming.
To further delineate the cell states along reprogramming process, we integrated the Day 3 scATAC-seq data with our published scRNA-seq using SnapATAC (Figure 4a)6,16. By calculating a prediction score of ATAC-seq and reprogramming states identified using scRNA-seq (Fib, iFib, and iCM) for each cell, we applied a stringent cut off (>=0.35) to focus our downstream analysis only on the cells that have a good correlation between two datasets (Supplementary Figure 4a). After integration, each cell was labelled with its reprogramming state. As expected, cells in Fib state were enriched at the beginning of the reprogramming trajectory, while cells in the iCM state were more concentrated at the end of the trajectory (Figure 4b, Supplementary Figure 4b). To determine which TF actively functions during iCM conversion, we extracted both the RNA expression and motif enrichment score of each TF along the reprogramming trajectory and calculated the correlation between these two parameters. Only TFs with a correlation score larger than 0.5 were considered a putative active TF (Figure 4c). The fact that three reprogramming factors are among the identified active TFs strengths the confidence of our analysis. To test whether these putative active TFs are functionally involved in cardiac reprogramming, we performed a knockdown screen using validated shRNAs and assessed reprogramming outcomes using both immunostaining and flow cytometry (Figure 4d, 4e; Supplementary Figure 4c, 4d, 4e). Apart from Smad3 and Smad4 that have been discussed above, knocking down Tcf21, a cardiac fibroblast TF, and Fos, a subunit of the AP-1 complex, drastically boosted iCM generation (Figure 4d and 4e; Supplementary Figure 4d). Similar results were verified via flow cytometry, with a significant increase in the percentage of cTnT+/αActinin+ cells in the shFos group compared to the non-targeted control. Importantly, both Tcf21 and Fos showed a gradually decreased expression starting from the initiation of iCM conversion, suggesting both factors could be barriers to iCM formation by safeguarding the fibroblast cell identity (Supplementary Figure 4f). Interestingly, unlike Tcf21, Fos expression was partially restored at the late stage of reprogramming, which may worth future investigation of a possibly distinct role for Fos at late stage of iCM reprogramming. Taken together, our analysis suggested that through integrative analysis of scATAC-seq and scRNA-seq, it was possible to identify active TFs underlying chromatin reconfigurations during cardiac reprogramming.
Figure 4. Integrative scATAC-seq and scRNA-seq analysis identified active TFs of cardiac reprogramming.

a) Schematic depiction of scRNA-seq and scATAC-seq integration. b) The distribution of three cell states (Fib as grey dots, iFib as yellow dots , and iCM as red dots) identified with scRNA-seq on the scATAC-seq reprogramming trajectory. c) The pipeline for identifying putative active TFs during cardiac reprogramming. Briefly, for each TF, Pearson correlation was calculated between its expression and its motif enrichment along the reprogramming trajectory. Motifs showing a correlation coefficient of more than 0.5 are considered as putative active TFs. d) Bar chart showing the fold change of reprogramming efficiency (αActinin+ percentage) when knocking down these putative active TFs comparing to shNT (empty pLKO vector). shRNA showing the significant difference to shNT was colored with green. Each dot represents one image being analysed. The red dashed line is added at a fold change of 1 for easy comparison between treatment groups. Experiments were performed in biological replicates, n=4. For each biological replicates, 5 images were analysed. Error-bar represents the standard deviation. Student’s t-test was used for statistical analysis. *** represent a p-value less than 0.001. **** represent a p-value less than 0.0001. e) Representative ICC showing the percentage of αActinin+ cells after knocking down putative active TFs using shRNA. Scale bar: 275 μm.
1.5. Rewiring of cis-regulatory interactions during cardiac reprogramming
The next question we intend to address is how these differentially accessible regions we identified using scATAC-seq orchestrate cardiac gene expression during iCM reprogramming. We first obtained a list of cardiac genes by comparing the bulk RNA-seq of cardiac fibroblast to cardiomyocytes7. The shortlisted cardiac genes showed enrichment on key cardiac functions such as oxidative phosphorylation, cardiac muscle contraction (Figure 5a). Next, we predicted distal cis-regulatory elements linking to these cardiac genes using SnapATAC12. By overlapping the identified gene-regulatory element interactions to DARs along the reprogramming trajectory, we were able to identify the cis-regulatory regions of cardiac genes (cardiac CRRs) gained during iCM reprogramming (Figure 5b, Supplementary Table 4). Most cardiac CRRs were established at pseudotime window 3,4,5 in parallel with the enrichment of cardiac TF motif (Figure 3a). More than 80% of the cardiac CRRs were located at distal intergenic and introns of genes across the pseudotime windows with no significant difference (Figure 5c). To further elucidate the functions of these cardiac CRRs, we examined the enrichment of H3K27ac, a mark for active enhancer, on the cardiac CRRs in both reprogramming and mock groups (Figure 5d) using a published bulk H3K27ac ChIP-seq dataset acquired during cardiac reprogramming9. Strong enrichment of H3K27ac was observed on these CRRs in reprogramming samples, suggesting cardiac CRRs mostly function as active enhancers to activate cardiac genes’ expression. Motif enrichment analysis on these cardiac CRRs showed a similar result as enriched DARs of the corresponding time window (Figure 5d, Figure 3a). AP-1 motif was enriched at early reprogramming time windows. Mef2c, Gata4, and Tead motifs were enriched at late time windows.
Figure 5. Rewiring of cis-regulatory interactions during cardiac reprogramming.

a) Schematic showing the criteria used to identify differentially expressed genes (DEGs) in mCM. Gene ontology analysis showing the enrichment of cardiac-related pathways of these DEGs. b) By overlap the gene-regulatory element interaction networks of DEGs together with DARs along the reprogramming trajectory identified the cis-regulatory regions of cardiac genes during cardiac reprogramming. Bar chart showing the numbers of the cardiac cis-regulatory regions along the pseudotime. c) The barplot showing the genomic feature composition of cardiac cis-regulatory regions in each pseudotime window. Each color represents one genomic feature. d) The enrichment of H3K27ac on these cardiac cis-regulatory regions in reprogramming(red) and mock(black) samples. Enriched motifs on these cardiac cis-regulatory regions were shown on the right side of the plot. e) Genome browser track of Ttn (top) and Actc1(bottom) with their cis-accessibility networks. Each track represents the aggregate ATAC signal from pseudotime window. Bar chart showing the ChIP-qPCR result of H3K27ac on the genomic regions with grey shade. Y-axis represents the normalized input percentage to negative control regions. The ChIP-qPCR Experiments were performed in biological replicates, n=3. Error-bar represents the standard deviation. Student’s t-test was used for statistical analysis. * represent a p-value less than 0.05. The arc plot represents the cis-interaction pairs identified using the predictGenePeakPair function from SnapATAC package. The cis-interactions gained during cardiac reprogramming are labelled as red arcs, while the lost cis-interactions are labelled as blue arcs.
Finally, to gain a better picture of these cardiac CRRs’ dynamic during reprogramming, we selected two genes, Actc1 and Ttn, to represent two different patterns of cis-regulatory region reconfiguration, “gain” and “switch”. Actc1, the cardiac muscle-specific actin, gained two CRR-promoter interactions during iCM reprogramming (Figure 5e). By performing a H3K27ac ChIP-qPCR at Day 1 and Day 3 of the cardiac reprogramming, we found that both cis-regulatory regions showed increased H3K27ac enrichment along iCM reprogramming suggesting their role as activated enhancers. While for Ttn, an important sarcomere protein, it switched from one CRR-promoter interaction to another CRR-promoter interaction when iCM fate starts to be established (Figure 5e). Consistently, from our H3K27ac ChIP-qPCR validation experiment, the lost interaction showed decreased H3K27ac enrichment, and the gained interaction showed increased H3K27ac enrichment. Interestingly, although Ttn’s promoter interacted with cis-regulatory region marked by H3K27ac at the early reprogramming stage, its expression was only activated at late stage of iCM conversion, suggesting the existence of other mechanisms to repress the expression of Ttn in early reprogramming.
Discussion
In this study, we presented the chromatin dynamics of early cardiac reprogramming at single cell level, which revealed transcription factor regulatory networks involved in successful cell fate conversion. By integrating published scRNA-seq of cardiac reprogramming to our newly acquired scATAC-seq data, we were able to identify active TFs that function as barriers in the early stage of reprogramming. Fos was one of the active TFs identified, knockdown of which during iCM conversion boosted cardiac reprogramming efficiency. Fos is a subunit of a ubiquitously expressed heterodimeric transcription factor, AP-1. Recently, AP-1 has been found to play a pivotal role in cell fate establishment17. In our analysis, accessible regions with the motifs of FOS-AP1 were rapidly closed upon the induction of iCM fate, which is consistent with the downregulation of its gene expression at early stage of reprogramming. Thus, understanding the mechanism of how AP-1 safeguards the fibroblast cell identity will reveal new reprogramming strategies to erase fibroblast features and achieve a more complete cell fate conversion.
Interestingly, in our loss-of-function assay, Smad3 showed a bimodal role at different stages of cardiac reprogramming. knocking down Smad3 from day 0 of cardiac reprogramming enhanced reprogramming efficiency, which is consistent with the motif enrichment of Smad3 during the initiation of cardiac reprogramming. Previous research has shown the cooperative binding of Smad3 with AP-1 transcription factors18. By comparing the motif sequences of AP-1 and Smad3::Smad4 from JASPER database, we found them to be highly similar. Thus, we hypothesize that at the initiation stage of cardiac reprogramming, Smad3 might interact with AP-1 to maintain the fibroblast program. Knockdown of Smad3 at the early stage could disrupt their cooperative binding with AP-1 and therefore disrupt AP-1’s activation/maintainace of the fibroblast program. Downregulation of Smad3 at day 3 of reprogramming reduced iCM reprogramming efficiency suggests that Smad3 could have different sets of target genes at different stages of iCM reprogramming and such differential targeting could be due to the switch of its interacting partners during the reprogramming process. Conventionally, in TGF-beta signalling pathway, Smad3 and Smad4 form a complex to regulate target gene expression. However, in our loss-of-function assay, KD Smad4 at Day 3 did not affect the cardiac reprogramming (Supplementary Figure 3c), suggesting that Smad3 exerts its function independent of Smad4 during the cardiac reprogramming. Smad3 IP-MS (Immunoprecipitation-Mass Spectrometry) experiment could be performed in the future to precisely pinpoint Smad3’s interactome during the cardiac reprogramming, which is likely to be distinct from its interactome during other biological processes.
Next, we identified cis-regulatory regions gained by cardiac genes through predicting the gene-regulatory element interactions using our scATAC-seq dataset. These cardiac cis-regulatory regions contain motifs of reprogramming factors and Tead family protein and function as enhancers due to the enrichment of H3K27ac during cardiac reprogramming. Notably, Tead4 has been proven to be a facilitator of somatic cell reprogramming19. Thus, given the increased motif occurrence of the Tead family during cardiac reprogramming and the enrichment of Tead motif on cardiac cis-regulatory regions, Tead family protein could also function as a facilitator of cardiac reprogramming.
Unlike scRNA-seq, the chromatin accessibility alterations at genetic loci acquired from scATAC-seq data do not always suggest or are positively correlated with changes in expression of the given genes. Therefore we need to be cautious when solely utilizing scATAC-seq data for cell population clustering. Whenever possible, consulting other datasets including the ones generated using RNA-seq at bulk or single cell level could be helpful for confirmation or hypothesis generation. The combined analysis of scRNA-seq and scATAC-seq within the same cell offers additional power and advantages in this regard.
In summary, our study demonstrates the feasibility of using scATAC-seq to identify novel regulatory TFs involved at different stages of cardiac reprogramming, which can be targeted for manipulation to improve the efficiency and quality of cardiac reprogramming. The analytical pipelines we present here may also be used for scATAC-seq approach applied in studying other biological processes.
Materials and Methods
Mouse lines
Wild type CD1 mice were used for primary neonatal cardiac fibroblast isolation. Animal care was provided in accordance with guidelines established by University of North Carolina Chapel Hill.
Isolation of neonatal cardiac fibroblasts
Neonatal cardiac fibroblasts were isolated by enzyme digestion method as previously described20. Briefly, 40-50 hearts were removed from P0-P2 mice and minced into small pieces. Then the heart tissues were incubated with 0.5% Trypsin for 10min at 37°C. The supernatant was removed and the heart tissue was then digested with Collagenase II(0.5mg/ml) at 37°C for 5 X 7 minutes. The supernatant was collected and centrifuged at 1000rpm for 5min to collect the dissociated cells. The pelleted cells were then resuspended in 100μl MACS buffer(DPBS with 0.5% BSA and 2mM EDTA) and stained with anti-Thy1 antibody. After 30 minutes of incubation at 4°C, the cell was washed once with 10ml MACS buffer and then incubated with 20μl anti-biotin microbeads in 80μl MACS buffer for another 30min at 4°C. Then the cell solution was washed with 10ml MACS buffer and passed through the LS column to enrich the Thy1 positive cells. The Thy1-positive cells were then eluted from the LS column, pelleted, and resuspended in the mouse fibroblast medium (500 mL IMEM with 100 mL Fetal Bovine Serum (FBS), 6 mL penicillin/streptomycin) for seeding.
Direct cardiac reprogramming
For direct cardiac reprogramming, pMXs retrovirus encoding Mef2c, Gata4, Tbx5, and LacZ were packaged by transfecting platE cells with Trans-IT as the manufacturer suggested. Viruses were collected from one 10-cm dish were resuspended in 100μl iCM medium(400ml DMEM, 100ml M199, and 50ml FBS). All virus transductions were performed in the iCM medium containing 4 μg/ml of polybrene. For single-cell ATAC-seq, cardiac fibroblasts were transduced with M, G, and T viruses for reprogramming sample or equal amounts of LacZ for mock sample. For shRNA knockdown assay, cardiac fibroblast was seeded in the 24-well plate at a density of 80,000 cells/ml. Each well of cardiac fibroblast was transduced with 5 μl of each reprogramming virus at Day 0 and selected with 2 μg/ml puromycin from Day 2 to Day 3. iCM medium was changed every two days until Day 12. Then the reprogrammed cells were digested for downstream assays, such as Flow cytometry and immunofluorescence.
scATAC-seq library construction
scATAC-seq libraries were constructed for both MGT-infected and LacZ-infected cells at Day 3 post infection. scATAC-seq libraries were prepared following the chromium single cell ATAC user guide. Briefly, cell nuclei were prepared following the Nuclei isolation for Single Cell ATAC sequencing. 3000 nuclei/ul were loaded in a C1 Chromium Instrument (10X Genomics) to generate single-cell gel beads in emulsion (GEMs) aiming for 5000 nuclei recovery. scATAC-Seq libraries were prepared using the Chromium Single Cell ATAC Kit, Gel Bead Kit v2, and Chromium i7 Multiplex Kit (10X Genomics). Sequencing was performed on the Illumina Novaseq SP platform. To minimize the batch effect between our scATAC-seq libraries, these libraries were constructed at same time and sequenced on the same lane of the sequencer.
shRNA Knockdown
The shRNAs targeting out putative active transcription factors were designed using the TRC shRNA Design Tool (https://portals.broadinstitute.org/gpp/public/gene/search). For each gene, three shRNAs were designed. Then the shRNAs were cloned into pLKO.1-puro vector for lentivirus production. The empty pLKO.1-puro vector was used as negative control (shNT) throughout the manuscript. For dox-inducible shRNA knockdown assay, shRNAs were cloned into Tet-pLKO-puro vector. The fresh neonatal cardiac fibroblast was harvested and seeded 40,000 cells into each well of the 24-well plate. These cells were transduced with 10 μl of MGT virus and 10μl of shRNA virus. Then the cells were maintained in iCM medium until Day 12 for flow cytometry or immunofluorescence. All the knockdown experiments were carried out in biological triplicates.
Immunofluorescence
Cells were fixed with 4% paraformaldehyde for 10 min, permeabilized with 0.2% Triton X-100 for 10 min, and blocked with 1% BSA in PBS for 30 min at room temperature. After blocking, cells were stained with primary antibody (anti-cTnT, Sigma, F1804; anti-αActinin, Abcam, ab68176) followed by Fluorophore-conjugated secondary antibody (Thermo Fisher) and counterstained with Hoechst 33342 (Thermo Fisher). Images were captured with EVOS FL Auto Cell imaging system. For quantification, 20 images were randomly taken for each well at the same exposure setting. Cell Profiler was used to count the number of positive cells and nuclei in each image.
Flow cytometry
Flow cytometry was performed as previously described11. Briefly, cells were fixed and permeabilized with Fix/Permeabilization buffer for 30 minutes at 4°C and washed once with Wash/Perm buffer. Then the fixed cells were stained with primary antibody for 30 min at 4°C and washed once with Wash/Perm buffer. Cells were incubated with secondary antibody for another 30 min at 4°C. Then the cell was loaded on the BD LSRII flow cytometer. FlowJo software was used to analyze the flow cytometry data.
Chromatin-Immunoprecipitation (ChIP)-qPCR
Cell fixation and chromatin shearing were performed using truChIP Chromatin Shearing Kit with Formaldehyde(Covaris) following the manufacturer’s protocol. Three million cells were cross-linked with 1% formaldehyde for 10 minutes at room temperature; formaldehyde was then quenched by the addition of quenching solution and cells were washed three times with ice-cold PBS. Cell lysis was carried out with a lysis buffer B containing protease inhibitors for 10 mins at 4°C. The intact nuclei was collected by centrifuging at 1,700 g for 5 minutes at 4°C. Then the nuclei pellet was washed two times in Wash Buffer C. Nuclei was resuspended in 1ml of Shearing buffer D3 and transfer to AFA microTUBEs. Sonication was conducted in covaries E220 sonicator (6 mins per sample). The chromatin solution was clarified by centrifugation at 20,000 g at 4°C for 45 minutes and then pre-cleared with Dynabeads Protein G (Life Technologies) for 2 hours at 4°C. The pre-cleared chromatin sample was incubated with 50 μl of Dynabeads protein G loaded with 5 μg antibody (anti-H3K27ac) overnight at 4°C. The beads were washed three times with 0.1% SDS lysis buffer, once with 0.1% SDS lysis buffer/0.35 M NaCl, once with 10 mM Tris-Cl (pH 8)/1 mM EDTA/0.5% NP40/0.25% LiCl/0.5% NaDOC, and once with TE buffer (pH8.0). The immunoprecipitated material was eluted from the beads by heating for 45 minutes at 68°C in 50 mM Tris-Cl (pH 7.5), 10 mM EDTA, 1% SDS. To reverse the crosslinks, samples were incubated with 1.5 μg/ml Pronase at 42°C for 2 hr followed by 67°C for 6 hr. The ChIP-DNA were then extracted with a PCR purification kit (QIAGEN) and used for qRT-PCR. qRT-PCR was performed on the QuantStudio™ 6 Pro Real-Time PCR System, using an SYBR Green PCR Master Mix (Applied Biosystem).
Computational analysis
Pre-processing of scATAC-seq libraries
Sequencing reads of scATAC-seq were aligned to mouse mm10 reference genome using Cell Ranger ATAC v.1.1.0 software. The outcomes of MGT and LacZ samples were aggregated following cellranger-atac aggr pipeline and then converted into a snap (Single-Nucleus Accessibility Profiles) file for downstream analysis using SnapATAC package21.For quality control, the low-quality barcodes whose 1) log10(UMI) <= 3.5 or >= 5; or 2) promoter ration <= 0.05 or >= 0.25 were filtered out from the dataset.
Motif enrichment analysis
The genome regions were segmented into 5-kb bins and the features within each bin were counted and binarized. In addition, to ensure accuracy, the bins were removed if they are located on the mitochondrial chromosome, overlapped with the ENCODE blacklist or overlapped with invariant features (the top 5% bins). Diffusion maps were employed for dimension reduction. Peaks were called for the clusters with > 200 cells, respectively, using MACS222, and the variability of 746 non-redundant vertebrate motifs (downloaded from JASPAR database (the latest 8th release (2020)23) were inferred among cells using chromVAR24.
Psuedotemporal trajectory analysis
To infer the cardiac reprogramming process, we performed the trajectory analysis for the cells from Cluster 2 and Cluster 12 by fitting a principal curve through their UMAP coordinates25. Then, the cells were projected onto the curve, and the distance along the curve was computed for each cell as the pseudotime. Regions differentially accessible (DARs) across pseudotime were identified using fit_models function from Monocle 3 package26. DARs were then clustered based on their trends of accessibility along the trajectory using Mfuzz package27. The trends that significantly differ from the null hypothesis of uniform distribution were identified using Fisher’s exact test with a p-value threshold of 0.05. We further divided the cells along the trajectory into 5 bins, and DARs among bins were detected using findDAR function from SnapATAC package. The peaks with FDR < 0.05 were considered as significant DARs. For the cell type/subtype containing < 2000 DARs, we ranked the peaks according to their p-values and selected the top 2000 most significant peaks as representative DARs.
Integration of scRNA-seq and scATAC-seq
The integrative analysis of the scATAC-seq data for Cluster 2 and 12 and the scRNA-seq data from Liu et al was conducted following SnapATAC’s pipeline with minor modifications6. Because the published sc-RNA-seq dataset was generated with fewer cells and also using a different sequencing platform, we do face technical challenges when integrating our sc-ATAC-seq dataset with the scRNA-seq dataset. To overcome these challenges, instead of performing a cell-to-cell integration, we correlated our ATAC-seq cells to the three reprogramming states (Fib, iFib, and iCM) identified using the scRNA-seq dataset. By calculating a prediction score of ATAC-seq and reprogramming states for each cell, we excluded the nuclei with a low predict score (<= 0.35) from the further analysis. To account for the different levels of sparseness, we looked at the frequency of three transcription states along the five pseudotime windows. For the TFs, correlations between their RNA expression level and motif enrichment level were computed by Pearson’s correlation, where the TFs with a correlation coefficient > 0.5 are considered as putative active TFs. Furthermore, we predicted promoter-enhancer pairs for the cardiac genes via predictGenePeakPair function from SnapATAC package. The genome tracks of peaks and/or predicted promoter-enhancer pairs were visualized by the WashU Epigenome Browser v52.0.0.
ChIP-seq analysis
ChIP-Seq libraries (Histones9(GEO: GSE112315), Transcription Factors9(GEO: GSE112315) ) were mapped using bbmap28 to mm10. Then peaks were called using the parameter consistent with each library’s related publication using MACS222. To determine their average enrichment of the ChIP-seq signal on our regions of interest, deepTools’ computeMatrix and plotHeatmap were used. Identified H3K27ac peaks during iCM reprogramming were listed in supplementary Table 5.
Identification of enriched motifs on the dynamic cis-regulatory regions sites
findMotifsGenome.pl script of HOMER was used to determine the motifs found in the identified cardiac cis-regulatory regions sites29.
Supplementary Material
Highlights.
scATAC-seq revealed chromatin accessibility dynamics of early iCM reprogramming
Smad3 plays a bimodal role at different stages of iCM reprogramming
Fos, a subunit of AP-1, may function as a barrier to efficient iCM reprogramming
The cis-interactions of cardiac genes are rewired during early iCM reprogramming
Acknowledgements
We would like to thank the members of the Qian and Liu labs for the helpful discussions and valuable input. This work is supported by AHA 18TPA34180058, 20EIA35310348 NIH/NHLBI R35HL155656 to L.Q. This work is all supported by NIH/NHLBI R01HL139976 and R01HL139880, and American Heart Association grant 20EIA35320128 to J.L.
Footnotes
Publisher's Disclaimer: This is a PDF file of an unedited manuscript that has been accepted for publication. As a service to our customers we are providing this early version of the manuscript. The manuscript will undergo copyediting, typesetting, and review of the resulting proof before it is published in its final form. Please note that during the production process errors may be discovered which could affect the content, and all legal disclaimers that apply to the journal pertain.
Disclosures
None
Data availability
The data that support the findings of this study are openly available in GEO with accession number GSE171525.
Reference
- 1.Laflamme MA & Murry CE Heart regeneration. Nature 473, 326–335 (2011). [DOI] [PMC free article] [PubMed] [Google Scholar]
- 2.Ieda M et al. Direct Reprogramming of Fibroblasts into Functional Cardiomyocytes by Defined Factors. Cell 142, 375–386 (2010). [DOI] [PMC free article] [PubMed] [Google Scholar]
- 3.Qian L et al. In vivo reprogramming of murine cardiac fibroblasts into induced cardiomyocytes. Nature 485, 593–598 (2012). [DOI] [PMC free article] [PubMed] [Google Scholar]
- 4.Farber G & Qian L Reprogramming of Non-myocytes into Cardiomyocyte-like Cells: Challenges and Opportunities. Curr. Cardiol. Rep 22, 54 (2020). [DOI] [PubMed] [Google Scholar]
- 5.Wang H, Yang Y, Liu J & Qian L Direct cell reprogramming: approaches, mechanisms and progress. Nat. Rev. Mol. Cell Biol 1–15 (2021). doi: 10.1038/s41580-021-00335-z [DOI] [PMC free article] [PubMed] [Google Scholar]
- 6.Liu Z et al. Single-cell transcriptomics reconstructs fate conversion from fibroblast to cardiomyocyte. Nature 551, 100–104 (2017). [DOI] [PMC free article] [PubMed] [Google Scholar]
- 7.Zhou Y et al. Single-Cell Transcriptomic Analyses of Cell Fate Transitions during Human Cardiac Reprogramming. Cell Stem Cell 0, (2019). [DOI] [PMC free article] [PubMed] [Google Scholar]
- 8.Stone NR et al. Context-Specific Transcription Factor Functions Regulate Epigenomic and Transcriptional Dynamics during Cardiac Reprogramming. Cell Stem Cell (2019). doi: 10.1016/j.stem.2019.06.012 [DOI] [PMC free article] [PubMed] [Google Scholar]
- 9.Hashimoto H et al. Cardiac Reprogramming Factors Synergistically Activate Genome-wide Cardiogenic Stage-Specific Enhancers. Cell Stem Cell (2019). doi: 10.1016/J.STEM.2019.03.022 [DOI] [PMC free article] [PubMed] [Google Scholar]
- 10.Liu Z et al. Re-patterning of H3K27me3, H3K4me3 and DNA methylation during fibroblast conversion into induced cardiomyocytes. Stem Cell Res. 16, 507–518 (2016). [DOI] [PMC free article] [PubMed] [Google Scholar]
- 11.Wang L et al. Stoichiometry of Gata4, Mef2c, and Tbx5 influences the efficiency and quality of induced cardiac myocyte reprogramming. Circ. Res 116, 237–244 (2015). [DOI] [PMC free article] [PubMed] [Google Scholar]
- 12.Fang R et al. Comprehensive analysis of single cell ATAC-seq data with SnapATAC. Nat. Commun 12, 1–15 (2021). [DOI] [PMC free article] [PubMed] [Google Scholar]
- 13.Franceschini A et al. STRING v9.1: protein-protein interaction networks, with increased coverage and integration. Nucleic Acids Res. 41, D808–D815 (2012). [DOI] [PMC free article] [PubMed] [Google Scholar]
- 14.Song K et al. Heart repair by reprogramming non-myocytes with cardiac transcription factors. Nature 485, 599–604 (2012). [DOI] [PMC free article] [PubMed] [Google Scholar]
- 15.Singh VP et al. Hippo Pathway Effector TEAD1 Promotes Direct Cardiac Reprogramming. Circulation 140, (2019). [Google Scholar]
- 16.Butler A, Hoffman P, Smibert P, Papalexi E & Satija R Integrating single-cell transcriptomic data across different conditions, technologies, and species. Nat. Biotechnol 36, 411–420 (2018). [DOI] [PMC free article] [PubMed] [Google Scholar]
- 17.Madrigal P & Alasoo K AP-1 Takes Centre Stage in Enhancer Chromatin Dynamics. Trends in Cell Biology 28, 509–511 (2018). [DOI] [PubMed] [Google Scholar]
- 18.Wong C et al. Smad3-Smad4 and AP-1 Complexes Synergize in Transcriptional Activation of the c-Jun Promoter by Transforming Growth Factor β. Mol. Cell. Biol 19, 1821–1830 (1999). [DOI] [PMC free article] [PubMed] [Google Scholar]
- 19.Xing QR et al. Diversification of reprogramming trajectories revealed by parallel single-cell transcriptome and chromatin accessibility sequencing. Sci. Adv 6, 18 (2020). [DOI] [PMC free article] [PubMed] [Google Scholar]
- 20.Garbutt TA, Zhou Y, Keepers B, Liu J & Qian L An Optimized Protocol for Human Direct Cardiac Reprogramming. STAR Protoc. 1, 100010 (2020). [DOI] [PMC free article] [PubMed] [Google Scholar]
- 21.Fang R et al. SnapATAC: A Comprehensive Analysis Package for Single Cell ATAC-seq. bioRxiv 615179 (2019). doi: 10.1101/615179 [DOI] [Google Scholar]
- 22.Zhang Y et al. Model-based analysis of ChIP-Seq (MACS). Genome Biol. 9, (2008). [DOI] [PMC free article] [PubMed] [Google Scholar]
- 23.Fornes O et al. JASPAR 2020: Update of the open-Access database of transcription factor binding profiles. Nucleic Acids Res. 48, D87–D92 (2020). [DOI] [PMC free article] [PubMed] [Google Scholar]
- 24.Schep AN, Wu B, Buenrostro JD & Greenleaf WJ chromVAR: inferring transcription-factor-associated accessibility from single-cell epigenomic data. Nat. Methods 14, 975–978 (2017). [DOI] [PMC free article] [PubMed] [Google Scholar]
- 25.McInnes L, Healy J & Melville J UMAP: Uniform Manifold Approximation and Projection for Dimension Reduction. arXiv (2018). [Google Scholar]
- 26.Trapnell C et al. The dynamics and regulators of cell fate decisions are revealed by pseudotemporal ordering of single cells. Nat. Biotechnol 32, 381–386 (2014). [DOI] [PMC free article] [PubMed] [Google Scholar]
- 27.Kumar L & E Futschik M Mfuzz: a software package for soft clustering of microarray data. Bioinformation 2, 5–7 (2007). [DOI] [PMC free article] [PubMed] [Google Scholar]
- 28.Bushnell B BBMap: A Fast, Accurate, Splice-Aware Aligner. Lawrence Berkeley National Lab.(LBNL), Berkeley, CA (United States) (2014). Available at: https://www.osti.gov/biblio/1241166. (Accessed: 3rd April 2021) [Google Scholar]
- 29.Heinz S et al. Simple Combinations of Lineage-Determining Transcription Factors Prime cis-Regulatory Elements Required for Macrophage and B Cell Identities. Mol. Cell 38, 576–589 (2010). [DOI] [PMC free article] [PubMed] [Google Scholar]
Associated Data
This section collects any data citations, data availability statements, or supplementary materials included in this article.
Supplementary Materials
Data Availability Statement
The data that support the findings of this study are openly available in GEO with accession number GSE171525.