

Abstract
Background & Aims:
Methionine adenosyltransferase 1A (MAT1A) is responsible for S-adenosylmethionine (SAMe) biosynthesis in the liver. Mice lacking Mat1a have hepatic SAMe depletion, develop non-alcoholic steatohepatitis (NASH) and hepatocellular carcinoma (HCC) spontaneously. Several kinases are activated in Mat1a knockout (KO) mice livers. However, the phosphos-proteome has not been characterized and whether they contribute to liver pathology is largely unknown. Our study aimed to fill this gap.
Approach & Results:
We performed phospho-proteomics in Mat1a KO mice livers with and without SAMe treatment to identify SAMe-dependent changes that may contribute to liver pathology. Our studies used Mat1a KO mice at different ages treated with and without SAMe, cell lines, in vitro translation and kinase assays, and human liver specimens. We found the most striking change was hyperphosphorylation and increased content of La-Related Protein 1 (LARP1), which in the unphosphorylated form negatively regulates translation of 5'-terminal oligopyrimidine (TOP)-containing mRNAs. Consistently, multiple TOP proteins are induced in the KO livers. The translation of TOP mRNAs RPS3 and RPL18 was enhanced by LARP1 overexpression in liver cancer cells. We identified LARP1-T449 as a novel, SAMe-sensitive phospho-site of cyclin-dependent kinase 2 (CDK2). Knocking down CDK2 lowered LARP1 phosphorylation and prevented LARP1 overexpression mediated increase in translation. LARP1-T449 phosphorylation induced global translation, cell growth, migration, invasion, and expression of oncogenic TOP-ribosomal proteins in HCC cells. LARP1 expression is increased in human NASH and HCC.
Conclusion:
Our results reveal a novel SAMe-sensitive mechanism of LARP1 phosphorylation that may be involved in the progression of NASH to HCC.
Keywords: Methionine adenosyltransferase 1A, Hepatocellular carcinoma, 5'-terminal oligopyrimidine containing mRNAs, Non-alcoholic fatty liver disease, Cyclin-dependent kinase 2
Methionine adenosyltransferase 1A (MAT1A) encodes for MATα1, that synthesizes the biological methyl donor, S-adenosylmethionine (SAMe), in the liver.(1) MAT1A is downregulated in patients with non-alcoholic fatty liver disease (NAFLD) and advanced fibrosis.(2) Patients with NAFLD with or without cirrhosis are at higher risk for hepatocellular carcinoma (HCC) development.(3) Such patients have impaired methionine metabolism as demonstrated by hypermethioninemia and reduced levels of SAMe.(3)
Mice lacking Mat1a have chronic hepatic SAMe deficiency, spontaneous development of non-alcoholic steatohepatitis (NASH) at 8 months of age and HCC by 18 months.(1,4) Treatment of Mat1a-knockout (KO) mice with SAMe not only prevents NASH progression, it also inhibits the development of proliferative nodules5. Importantly nearly 50% of NAFLD patients have a serum metabolomics signature similar to that of Mat1a-KO mice.(5) We previously observed Mat1a-KO livers have activation of multiple kinases, some of which may be involved in the liver pathology observed1. However, how deficiency of the methyl donor impacts on the phospho-proteome has not been examined.
La Ribonucleoprotein Domain Family Member 1 (also known as La-Related Protein 1, LARP1) belongs to a family of La-motif containing proteins that regulate the translation of a class of mRNAs containing a 5’-terminal oligopyrimidine tract (TOP) such as those encoding ribosomal proteins (RPs) and translation initiation/elongation factors.(6) LARP1 inhibits translation of TOP mRNAs by simultaneously binding to their 5’-TOP and 3’-UTR elements.(7,8) Recently LARP1 was identified as the missing link between mammalian target of rapamycin C1 (mTORC1) and ribosome biogenesis. Phosphorylation of LARP1 by mTORC1 (at S689 and T692) and AKT/S6K1 (at S770 and S979) induces its dissociation from the oligopyrimidine tract relieving its inhibitory activity on RP mRNA translation.(7,9) LARP1 stabilizes TOP mRNAs because its silencing is known to induce TOP mRNA decay.(6,10) In essence, LARP1 acts as a control point for RP mRNA translation. The switch of LARP1 between phosphorylated and unphosphorylated states regulates RP mRNA translation and subsequent ribosome biogenesis.(7)
During ribosomal biogenesis, RPs are synthesized in the cytoplasm and assembled with ribosomal RNA in the nucleolus.(11) Free RPs that are not part of ribosome protein assembly are rapidly turned over. However, stimuli such as nutrient deprivation, gene mutations and chemical agents may cause ribosomal stress leading to accumulation of free RPs.(11) Accumulating evidence suggests that free RPs exhibit extra-ribosomal functions associated with oncogenesis or tumor suppression,(12) and their dysregulation has been reported in NAFLD and HCC.(13,14) LARP1 as well as many oncogenic RPs are induced in HCC.(12,14,15) HCC patients with high LARP1 expression have lower survival.(16)
In this work we identified LARP1 protein is hyperphosphorylated at specific sites in Mat1a-KO livers and SAMe-deficient cell line derived from Mat1a-KO HCC (SAMe-D). These SAMe deficiency models exhibit enhanced LARP1 content and TOP mRNA-encoded protein expression. SAMe treatment in these models inhibits LARP1 expression, LARP1 phosphorylation, and TOP-protein expression. Importantly, LARP1 content and several TOP-proteins are upregulated in human NASH and HCC. LARP1 overexpression induces TOP mRNA translation, growth, migration and invasiveness of liver cancer cell lines. Taken together, our results suggest activation of LARP1 by hyperphosphorylation during SAMe deficiency may cause dysregulation of oncogenic TOP protein synthesis favoring progression of NASH to HCC.
EXPERIMENTAL PROCEDURES
Cell culture and treatments
See Supplemental Methods for cell lines, mouse hepatocytes, and treatments. SAMe-D cell line was derived from HCC of a Mat1a-KO mouse.(17) All cell lines were authenticated as previously published(18) using short tandem repeat profiling (ATCC).
Mat1a-KO mouse model
Mat1a-KO mice and wild type (WT) littermates were described previously.(19) 4-month old KOs were treated with SAMe at 100mg/kg/day by oral gavage for 7 days, which normalized hepatic SAMe levels.(20) 8-month old KOs with NASH were treated with vehicle or SAMe (30mg/kg/day by gavage 5 days per week) for 8 weeks, which nearly normalized liver histology.(5) All procedures for the care and use of mice were reviewed and approved by the Institutional Animal Care and Use Committee at Cedars-Sinai Medical Center (CSMC) and the CIC bioGUNE, Spain.
Human liver specimens
Normal human liver, NAFLD, HCC and adjacent non-tumorous tissues were procured from the Biobank and Translational Discovery Core at CSMC through an approved Institutional Review Board. All tissues were pathologically verified, snap frozen in liquid nitrogen and stored at −80°C. Some were also provided as unstained paraffin-embedded slides. Human tissue microarrays were from US Biolab Inc., Rockville, MD (Cat. No. DLV20812a) and Sekisui Xenotech, Kansas City (TMA.NASH #2010171).
Plasmid Vectors and siRNA
Myc-DDK tagged LARP1 vector or empty vector (EV) controls were purchased from Origene (Rockville, MD). Silencer select validated siRNAs for LARP1, cyclin-dependent kinase 2 (CDK2) and negative control (NC) were purchased from ThermoFisher Scientific.
Site-directed mutagenesis
Phospho-site mutations of serine/threonine to alanine (S/T to A) or phospho-mimetics of serine/threonine to glutamic acid (S/T to E) were generated in the WT LARP1 vector using the Quick Change II XL Site-Directed Mutagenesis Kit (Stratagene, La Jolla, CA) as previously published.(21)
Transient transfection assays
Details in Supplemental Methods.
Real-time RT-PCR
Total RNA was subjected to real-time RT-PCR using a published protocol.(22) See Supplemental Methods for details.
Western blotting
Total protein from cells or tissues was subjected to western blotting(21) with antibodies (Supplemental Table 1). Images were quantified by densitometry using the ImageJ densitometry program (NIH).
Co-Immunoprecipitation (Co-IP)
Co-IP of phospho-LARP1 from Huh7 cells with anti-phospho serine (PSer) antibodies was performed by according to previously established protocols.(22)
O-propargyl-puromycin (OPP) translation rate assay
Details in Supplemental Methods.
Polysome profiling assay.
Polysome profiling was performed according to the scheme in Supplemental Figure 1 as previously reported.(23)
Azido-homoalanine (AHA) labeling of newly synthesized proteins
Details in Supplemental Methods. We followed the protocol described.(24)
Cell Proliferation Assay
Cell proliferation was measured by bromodeoxyuridine (BrDU) incorporation into DNA as we described.(25)
Cell migration and invasion assays
Migration and invasion assays were done as we described.(25)
Immunohistochemistry
Details in Supplemental Methods.
In vitro kinase assays
Recombinant human LARP1 protein (100ng, Novus Biologicals, Littleton, CO) was incubated with 225ng of active CDK2 or 8.3ng of active CK2 enzyme (Millipore-Sigma) in the presence of a magnesium/ATP cocktail (Millipore-Sigma) at 0°C or 30°C for 1 hour. The reaction mixture was immunoprecipitated with 0.5μg PSer antibody and immunoblotted with LARP1 antibody. In vitro kinase reactions were subjected to mass spectrometry to identify LARP1 residues phosphorylated by CDK2 or CK2.
Data independent acquisition mass spectrometry analysis
See Supplemental Methods for details. Data independent acquisition mass spectrometry analysis was performed by preparing Lys PTM enriched peptide assay libraries as we recently reported.(26) For quantification of individual specimen DIA files, raw intensity data for peptide fragments was extracted from DIA files using the open source openSWATH workflow against the sample specific strong cation exchange (SCX) fractionated peptide assay as previously described.(27) The total ion current (TIC) associated with the MS2 signal across the chromatogram was used to adjust the transition intensity of each peptide in a corresponding file and further processed using the mapDIA software(28) to perform pair-wise comparisons between groups.
Phosphorylation mass spectrometry analysis
Titanium Dioxide (TiO2) phospho enrichment was performed as previously described.(29) See Supplemental Methods for details. Results from spectral searching through Trans-Proteomic Pipeline (TPP)(30) with a probability score of > 95% were imported into Skyline software for quantification of precursor extracted ion intensities (XICs).(31) The Skyline documents containing precursor XICs are available at Panorama (https://panoramaweb.org/Larp1) or ProteomeXchange (ID PXD020015).
SAMe and triglyceride levels measurement
See Supplemental Methods for details.
Statistical analysis
Based on our previously published work(19,22), the effect size (difference between groups/standard deviation) for each study was calculated, and sample sizes were calculated using G*Power (v3.1.9.4). Biologically independent replicates combined from at least three individual experiments are represented as mean ± standard error (Mean±S.E.). Real-time PCR and densitometric analysis (as shown with each western blot) are expressed as percentage of controls. Statistical analysis was performed using analysis of variance followed by Fisher's test for multiple comparisons, and two-tailed Student’s t-test for paired comparisons. Significance was defined as P<0.05.
RESULTS
SAMe deficiency results in an increase in protein synthesis machinery and hyperphosphorylation of LARP1
We identified specific serine/threonine phospho-sites altered in 4-month or 10-month old WT, 4-month or 10-month Mat1a-KO treated with SAMe or vehicle. Phosphorylation of unique peptides was normalized to total protein and the fold change of KO versus WT or KO+SAMe versus KO was calculated. Out of a repertoire of 4,172 phospho-peptides quantified, 355 phospho-peptides exhibited an induction in Mat1a KO compared to WT and were reversed upon SAMe administration. Skyline documents containing extracted XIC from phospho-peptide enrichment experiments are available at Panorama (https://panoramaweb.org/Larp1) and proteome Xchange ID PXD020015 (http://proteomecentral.proteomexchange.org/cgi/GetDataset?ID=PXD020015). We found that LARP1 phospho-sites were significantly represented in this repertoire. These phosphorylation sites were conserved between mouse and human (Table 1). Out of nine LARP1 sites identified, four (T449, S471, S697, S250) exhibited significant enhancement of phosphorylation in 4-month (pre-disease condition) and 10-month (NASH condition) compared to their respective WT controls (Table 1). Moreover, the phosphorylation of these sites was strongly inhibited by SAMe administration (Table 1). Since many phosphorylation sites in vivo may not be abundant enough to accurately detect by mass spectrometry, we mapped SAMe-sensitive LARP1 phosphorylation sites in SAMe-D cells overexpressing LARP1 (Supplemental Table 2). The T449, S471, and S697 phospho-sites were inhibited by 40-70% upon SAMe treatment; however, in this system the S250 site was not significantly inhibited by SAMe (Supplemental Table 2). Other novel phospho-sites, S843 and S444 that were not accurately detectable in the Mat1a-KO system (Table 1), were found to be significantly inhibited by SAMe in LARP1-overexpressing SAMe-D cells (Supplemental Table 2). The T101-LARP1 phospho-site that exhibited strong induction (9-fold versus WT) in 10-month KO and was inhibited by SAMe (Table 1), could not be detected in the LARP1-overexpressing SAMe-D cells. Out of the nine sites, seven are novel sites not reported previously. Using prediction algorithms,(32) four of these novel sites were predicted to be phosphorylated by cyclin-dependent kinase 2 (CDK2), two by casein kinase 2 (CK2) and one site could not be assigned to a kinase. A previously published mTOR phospho-site (S689)(7) was neither responsive to SAMe deficiency nor inhibited by SAMe treatment (Tables 1 and Supplemental Table 2). Consistent with LARP1 hyperphosphorylation, we found an enrichment in the total proteome of translational factors (RPs and translation initiation/elongation) that were normalized by SAMe treatment. (https://panoramaweb.org/Larp1,http://proteomecentral.proteomexchange.org/cgi/GetDataset?ID=PXD020015), some of these are known to be regulated by LARP1.(6)
Table 1:
Phospho-proteome analysis of LARP1 in 4-month and 10-month old WT and Mat1a-KO treated with SAMe or vehicle.Livers were processed for mass spectrometry analysis as described under Experimental Procedures. The intensity of phospho-enriched peptides was normalized to that of total LARP1. Results represent Mean±SE from 5 experiments expressed as a percentage of WT.
| 4-month | 10-month | |||||||
|---|---|---|---|---|---|---|---|---|
| Conserved phospho-site (mouse/human) |
Phospho-peptide sequence |
Kinase prediction |
WT |
Mat1a KO vs. WT |
Mat1a KO+SAMe vs. KO |
WT |
Mat1a KO vs. WT |
Mat1a KO+SAMe vs. KO |
| T503/T449-LARP1 | AVTPVPTKTEEVSNLK | CDK2 | 100±30 | 250±59 | 63±35 | 100±24 | *190±37 | **85±11 |
| S525/S471-LARP1 | GLSASLPDLDSEQIEVK | Unknown | 100±3 | *234±39 | **54±10 | 100±31 | *113±13 | **51±8 |
| S751/S697-LARP1 | SLPTTVPESPNYR | CDK2 | 100±15 | *199±24 | **75±18 | 100±25 | *182±6 | **54±8 |
| S302/S250-LARP1 | VEPAWHDQDETSSVKSDGAGGAR | CK2 | 100±49 | 146±32 | 114±27 | 100±14 | *283±14 | **40±12 |
| T151/T101-LARP1 | VGDFGDAINWPTPGEIAHK | CDK2 | ND | ND | ND | 100 | *900±8.63 | **19±9 |
| S897/S843-LARP1 | FWSFFLR | CK2 | ND | ND | ND | ND | ND | ND |
| S498/S444-LARP1 | ETESAPGSPR | CDK2 | 100±2 | 85±41 | 124±88 | ND | ND | ND |
| #S743/S689-LARP1 | SLPTTVPESPNYR | mTOR | 100±8 | 70±26 | 80±21 | 100±11 | 175±101 | 74±39 |
| #S824/S770-LARP1 | TASISSSPSEGTPTVGSYGCTPQSLPK | AKT | ND | ND | ND | ND | ND | ND |
p<0.05 vs. WT.
p<0.05 vs. KO. #=known phosphorylation events7. ND=not detectable.
LARP1 protein expression is increased during SAMe deficiency and reduced by SAMe treatment through proteasomal degradation
Total LARP1 protein and mTOR activity (pSer-2448 phosphorylation) were higher in Mat1a-KO livers compared to WT and were inhibited by SAMe administration (Figure 1A). SAMe deficiency did not influence Larp1 mRNA levels (Figure 1A). Increased expression of LARP1 in Mat1a-KO compared to WT was confirmed by immunohistochemistry (Figure 1B). Treatment of liver cancer cell lines, SAMe-D, HepG2 or Huh7 with SAMe inhibited LARP1 protein quantity by 45-60% compared to control (Figure 1C). LARP1 mRNA levels remained unchanged upon SAMe treatment (Figure 1C). SAMe did not alter LARP1 protein or mRNA levels in normal mouse hepatocytes (Figure 1C). Since SAMe inhibited LARP1 protein but not its mRNA content, we evaluated a plausible translational or post-translational mechanism. SAMe did not alter the translation of LARP1 mRNA (Supplemental Figure 2). Using CHX chase assays, we found that SAMe reduced the stability of LARP1-DDK tagged protein compared to control (calculated half-life or T1/2-control>22 hours, T1/2-SAMe=12 hours, Figure 1D). SAMe-mediated inhibition of the LARP1-DDK tagged protein in Huh7 cells was completely rescued by co-treatment with the proteasome inhibitor, MG132, indicating that SAMe enhanced proteasomal degradation of LARP1 (Figure 1E).
Figure 1. LARP1 protein expression is increased during SAMe deficiency and reduced by SAMe treatment through proteasomal degradation.

A. Left panel: LARP1 and phospho-mTOR (pSer 2448) protein levels in 10-month WT and Mat1a-KO livers±SAMe were measured by western blotting. Right panel: Total RNA was analyzed by real-time RT-PCR for Larp1 or Gapdh (normalizing control). Mean±SE expressed as percentage of WT from 4 experiments. *p<0.05 vs. WT, #p<0.05 vs. WT and KO. B. Three WT or Mat1a-KO livers were stained with LARP1 antibody. Normal IgG was used as a control for staining. C. SAMe-D, HepG2, Huh7, and primary mouse hepatocytes were treated with 0.5mM SAMe for 16 hours. Left panel: Total protein was analyzed by western blotting for LARP1 or actin (normalizing control). Right panel: LARP1 mRNA was measured by real-time PCR. Mean±SE expressed as percentage of control from 3 experiments, *p<0.05 vs. control. D. Huh7 cells were transfected with LARP1-DDK vector and treated with CHX in the absence or presence of SAMe for different times as described under Experimental Procedures. Total protein was western blotted with LARP1 or actin control antibody. Results represent the level of LARP1 from three independent experiments expressed as percentage of the 0 hour control. Densitometric ratios of LARP1 to actin control were plotted against time to determine the T1/2 of LARP1. *p<0.05, #p<0.01 vs. time 0 control. E. Huh7 cells were transfected with LARP1-DDK vector and treated with 0.5 mM SAMe with or without 10 uM MG132 as described under Experimental Procedures. Total protein was western blotted with DDK tag or actin control antibody. Mean±SE expressed as percentage of control from 4 experiments. *p<0.05 vs. control, #p<0.01 vs. SAMe.
LARP1 expression is induced in human NAFLD and HCC
LARP1 protein was induced by 4-15-fold in NAFLD tissues compared to normal liver (Figure 2A) and by 10-fold in human HCC compared to adjacent non-tumorous liver without a change in mRNA (Figure 2B). This was associated with an induction of several TOP-proteins (RPL15, RPS3 and RPL18) (Figure 2B). Tissue microarray of human hepatitis, nodular cirrhosis and HCC showed a 3-5-fold induction in LARP1 staining compared to normal controls (Figure 2C). A complete microarray of 192 tissues is shown in supplemental Figure 3. LARP1 staining was also increased by 3-fold in NASH and alcoholic-steatohepatitis (ASH) tissue microarrays compared to normal liver (Figure 2D).
Figure 2.

A. Top panel: LARP1 is induced in human NAFLD. Sections of NAFLD tissues (n=2 each) were stained for LARP1 protein using immunohistochemistry as described under Supplemental Methods. Bottom panel: Western blotting of LARP1 was performed from liver extracts of different NAFLD stages and compared to normal liver. Mean±SE from 4 normal, 4 simple steatosis, 2 NASH and 2 cirrhosis livers are expressed as percentage of normal. *p<0.05 vs. normal. B. LARP1 and TOP-encoded proteins are induced in human HCC. Human HCC tissue and adjacent non-tumorous liver (NL) extracts were subjected to western blotting for LARP1, TOP-encoded proteins (RPL15, RPS3, RPL14, EEF1A1) and actin loading control (left panel) or real-time PCR for LARP1 mRNA using HPRT1 as a normalizing control (right panel). Mean±SE from 6 normal and 6 HCC tissues is expressed as a percentage of NL. *p<0.05 vs. NL. Three representative sets are shown in the figure. C. LARP1 is induced in liver tissue arrays of human hepatitis, nodular cirrhosis and HCC. Tissue arrays were stained with LARP1 antibody as in ‘A’ above. #p<0.001 vs. normal liver. D. LARP1 is induced in NASH and ASH tissue arrays. Arrays were stained as in ‘C’ above. #p<0.001 vs. normal liver.
SAMe treatment inhibits global and LARP1-mediated translation induction in liver cancer cell lines
SAMe treatment did not exert any toxicity in cancer cell lines or primary hepatocytes (Supplemental Figure 4). SAMe treatment lowered translation rate (OPP fluorescence) by 58% in SAMe-D cells and by 83% in Huh7 cells compared to control but had no influence in normal mouse hepatocytes (Figure 3A). Basal SAMe levels in human and mouse hepatocytes were 15-fold and 100-fold higher respectively, than those of cancer cell lines, SAMe-D and Huh7 (Figure 3B). SAMe treatment inhibited endogenous and over-expressed LARP1 protein expression in Huh7 cells by 60-70% compared to EV without a change in mRNA level (Figure 3C). LARP1 overexpression in Huh7 cells increased translation rate by 1.7-fold compared to EV+control (Figure 3D). SAMe treatment inhibited basal translation by 88% when compared to EV and LARP1-mediated translation by 75% when compared to LARP1-overexpression vector (OV) (Figure 3D).
Figure 3. SAMe treatment inhibits global and LARP1-mediated translation induction in liver cancer cell lines.
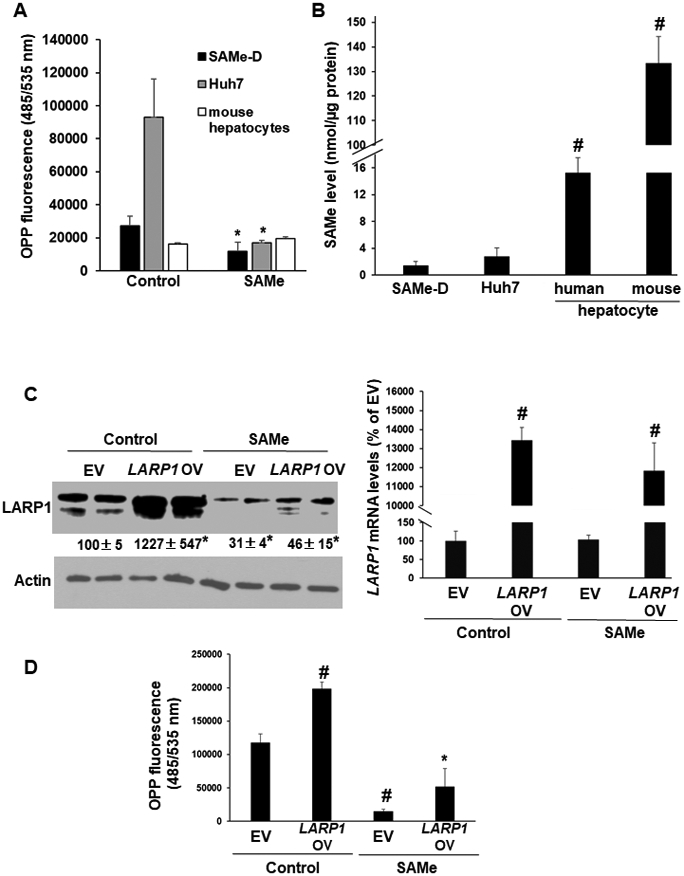
A. Translation rate in SAMe-D, Huh7, and primary mouse hepatocytes was measured by O-propargyl-puromycin (OPP) fluorescence as described under Experimental Procedures. The incorporation of OPP into the C-terminus of translating polypeptides and its fluorescence detection using FAM-Azide as a readout of protein synthesis rate was measured using a plate reader. Mean±SE of OPP fluorescence from 4 experiments, *p<0.05 vs. control. B. Endogenous SAMe level was measured as described under Experimental Procedures. Mean±SE of nmoles of SAMe/μg protein from 8-10 experiments. #p<0.01 vs. SAMe-D or Huh7, **p<0.01 vs. SAMe-D, Huh7 or human hepatocytes. C. Huh7 cells were transfected with LARP1-DDK vector in the absence or presence of SAMe treatment as described under Experimental Procedures. Left panel: Western blot of LARP1 overexpression (LARP1 OV). Mean±SE as percentage of empty vector (EV) from 4 experiments, *p<0.05 vs. EV; Right panel: Real-time PCR of LARP1 OV. Mean±SE as percentage of empty vector (EV) from 4 experiments, #p<0.01 vs. EV. D. Translation rate in Huh7 cells by OPP florescence measurement as in ‘A’ above. Mean±SE of OPP fluorescence from 4 experiments. #p<0.01 vs. EV, *p<0.05 vs. EV or LARP1 vector.
LARP1 induces TOP mRNA translation, TOP-encoded proteome, growth, migration and invasiveness of liver cancer cells
Phosphorylated LARP1 is known to induce translation of mRNAs containing TOP sequences.(7) Since we found LARP1 phosphorylation to be induced during SAMe deficiency and inhibited by SAMe treatment (Tables 1 and Supplemental Table 2), we examined whether TOP mRNA-encoded protein expression was influenced under these conditions. Proteomics of Mat1a-KO livers showed a 1.4-1.5-fold induction of several TOP-proteins. A representative heat map is shown in Supplemental Figure 5A and source data is available at https://panoramaweb.org/Larp1, http://proteomecentral.proteomexchange.org/cgi/GetDataset?ID=PXD020015. SAMe administration strongly inhibited TOP-protein expression compared to both WT and Mat1a-KO samples (Supplemental Figure 5A). LARP1 overexpression in SAMe-D cells enhanced TOP-protein expression and SAMe treatment inhibited LARP1-mediated TOP induction compared to EV or LARP1 OV (Supplemental Figure 5B). We tested LARP1’s translational activity on some TOP mRNAs. By profiling the polysome fraction of Huh7 cells, we found that LARP1-overexpression induced the translation of TOP mRNAs RPS3 and RPL18, by 2.5-fold compared to EV but did not influence the translation of RPL15 (Figure 4A). LARP1 overexpression increased growth of Huh7 and Hep3B cells by 1.2-1.3-fold compared to EV whereas 70-90% silencing of LARP1 versus NC had the opposite effect (Figure 4B, see silencing efficiency in supplemental Figure 6). LARP1 overexpression induced the migration of Huh7 and Hep3B cells by 1.3-fold compared to EV, whereas LARP1 silencing inhibited migration by 30-40% compared to negative control siRNA (NC) (Figure 4C). The invasiveness of Huh7 and Hep3B cells was induced upon LARP1 overexpression (2-2.5-fold vs. EV) and reduced by 45-65% upon LARP1 silencing (Figure 4D). LARP1 silencing in human hepatocytes did not regulate the production of triglycerides induced by palmitate treatment (Supplemental Figure 7).
Figure 4. LARP1 induces TOP mRNA translation, TOP-encoded proteome, growth, migration and invasiveness of liver cancer cells.
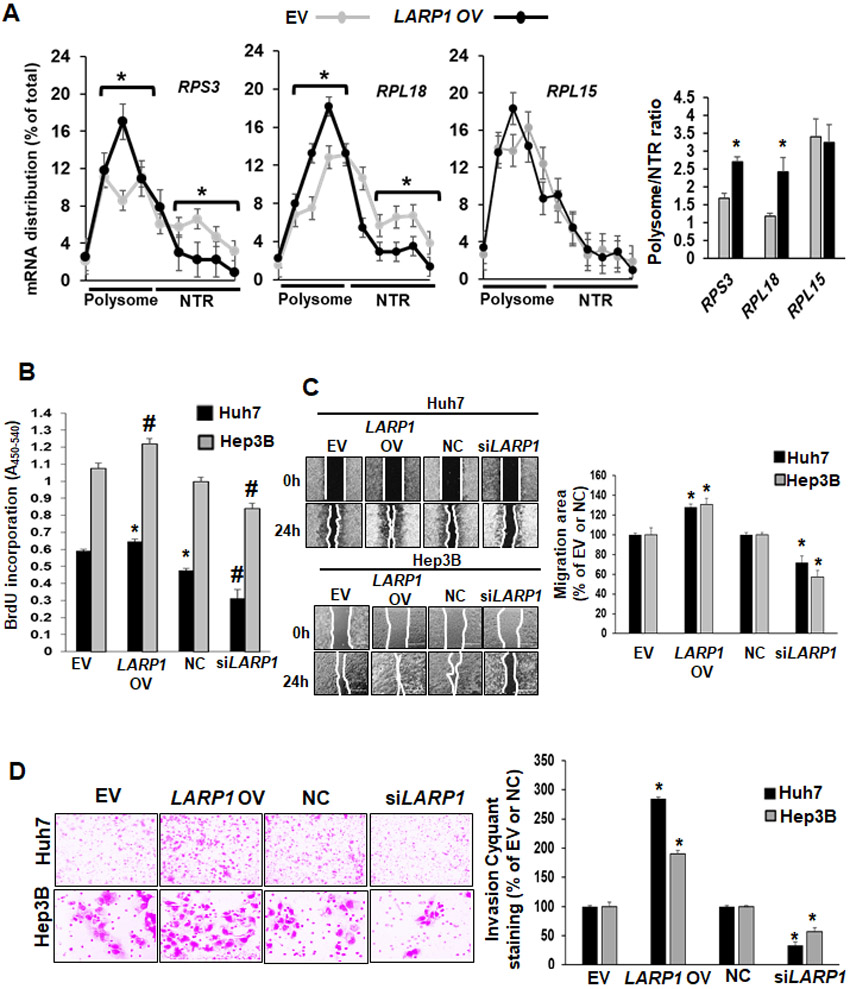
A. Huh7 cells were transfected with EV or LARP1 vector and total RNA was fractionated for polysome profiling and real-time PCR for RPS3, RPL18 and RPL15 mRNAs as described under Experimental Procedures. Data represent the mRNA distribution and polysome/NTR ratio from three experiments. *p<0.05. vs. EV. B. Huh7 or Hep3B cell lines were transfected with EV, LARP1 vector (LARP1 OV), negative control siRNA (NC) or LARP1 siRNA (siLARP1) as described under Experimental Procedures. Cell growth was assayed by the incorporation of bromodeoxyuridine (BrDU) into DNA as described under Experimental Procedures. Mean±SE expressed as percentage of control from 3 experiments in duplicates. #p<0.01 vs. EV or NC, **p<0.01 vs. EV. C. Huh7 and Hep3B cells were transfected as in ‘A’ and 2-D migration was assayed as described under Experimental Procedures. Mean±SE expressed as percentage of control from 3 experiments in duplicates. *p<0.05 vs. EV or NC. D. Huh7 and Hep3B cells were transfected as in ‘A’ and invasion assays were performed as described under Experimental Procedures. Mean±SE expressed as percentage of control from 3 experiments in duplicates. *p<0.05 vs. EV or NC.
Site-specific phosphorylation of LARP1 regulates translation, growth, migration, and TOP protein expression in liver cancer cells
Out of several LARP1 phosphorylation sites that were responsive to SAMe treatment, we identified four sites (T449, S471, S697, and S250) whose phosphorylation was induced both in 4-month Mat1a-KO (pre-disease condition) and 10-month Mat1a-KO (NASH condition). All four sites were sensitive to SAMe treatment. These sites were tested for their functional effect on translation, growth, migration capacity and TOP-protein expression of liver cancer cell lines. We found that WT LARP1 induced translation as detected by AHA labeling of newly synthesized proteins but not the T449A and S471A phospho-mutants (Figure 5A). In contrast, S697A and S250A mutations did not significantly alter the translational activity of WT LARP1 (Figure 5A). Compared to WT LARP1, the T449A mutation was unable to induce growth in Huh7 and Hep3B cells (Figure 5B). The S471A mutation was still able to induce growth comparable to WT in Huh7 cells and was not as inductive as WT in Hep3B (Figure 5B). Consistent with its effect on growth, the T449A mutation significantly inhibited LARP1-mediated cell migration by 25-30% in both Huh7 and Hep3B cells (Figure 5C). Like the pattern observed for cell growth, the S471A mutation inhibited LARP1-mediated migration of Hep3B but not of Huh7 cells (Figure 5C). We further evaluated the effect of T449A/S471A phospho-mutations and their corresponding phospho-mimetics (T449E/S471E) on expression of oncogenic TOP RPs, RPS3 and RPL15 in SAMe-D cells. The protein level of RPL15 was unaffected by LARP1 OVs; however, the T449E phospho-mimetic mutant induced whereas a T449A phospho-mutation inhibited RPL15 expression (Figure 5D). The S471A mutation did not alter RPL15 expression (Figure 5D). Over-expression of LARP1 increased RPS3 protein level by 1.5-2-fold compared to EV. The S471A, but not the T449A mutation, inhibited LARP1-mediated RPS3 induction whereas S471E, the phospho-mimetic mutant, sustained RPS3 expression (Figure 5D). No changes in RP mRNA levels were observed with either WT or mutant over-expression (Figure 5D). The TOP target, RPL18 whose translation was enhanced by LARP1 (Figure 4A), was not responsive to T449 or S471 LARP1 phospho-site modifications (data not shown).
Figure 5. Site-specific phosphorylation of LARP1 regulates translation, growth, migration, and TOP protein expression in liver cancer cells.
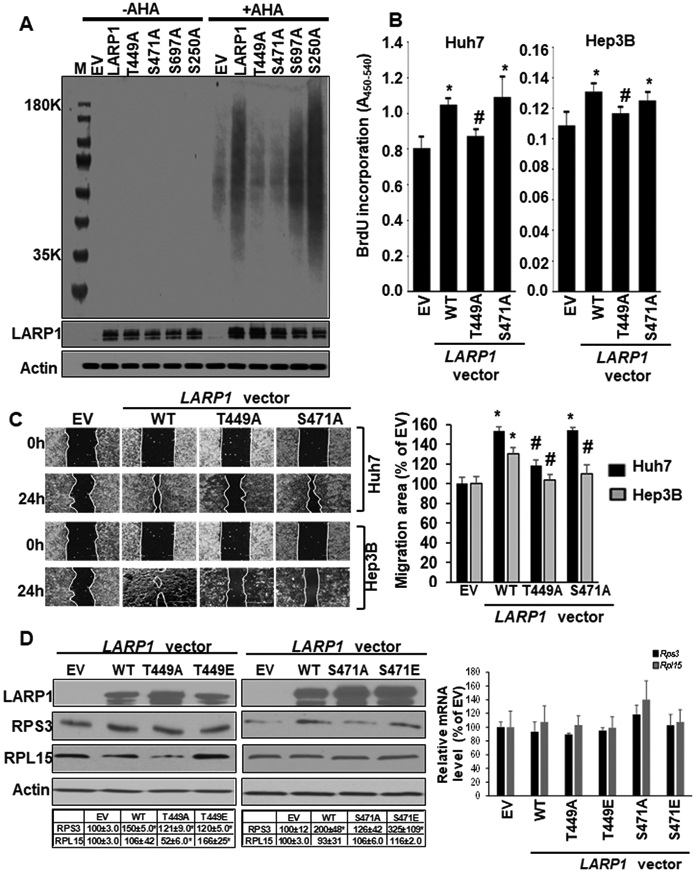
A. Huh7 cells were transfected with empty vector (EV), WT LARP1 vector or its phospho-site mutants, T449A, S471A, S697A, and S250A for 48 hours during which AHA was added to the culture medium. AHA-labeled proteins were detected as described under Experimental Procedures. A representative western blot of AHA labeled proteins from 3 experiments is shown. B. Huh7 or Hep3B cells were transfected with EV, WT LARP1, T449A, and S471A mutants and BrDU incorporation was measured as described under Experimental Procedures. Mean±SE expressed as percentage of EV from 4 experiments, *p<0.05 vs. EV, #p<0.05 vs. WT LARP1. C. Huh7 or Hep3B cells were transfected as in ‘B’ above and migration assays were performed as described under Experimental Procedures. Mean±SE expressed as percentage of EV from 3 experiments in duplicates. *p<0.01 vs. EV, #p<0.01 vs. WT LARP1. D. SAMe-D cells were transfected with EV, LARP1 or its phospho-site mutant vectors as described in Experimental Procedures. Left panel: LARP1, TOP proteins (RPS3 and RPL15) and Actin were measured by western blotting. Right panel: LARP1 or Gapdh (normalizing control) mRNA was measured by real-time PCR. Mean±SE expressed as percentage of EV from 3 experiments, *p<0.05 vs. EV.
CDK2 phosphorylates LARP1 protein, regulates TOP-protein expression and LARP1’s translational activity
Since CDK2 and CK2 are predicted to phosphorylate LARP1 at the sites that are SAMe sensitive (Table 1 and Supplemental Table 2), we next investigated these kinases in direct phosphorylation of LARP1. Phosphorylation of recombinant LARP1 was significantly enhanced in the presence of active CDK2 or CK2 enzymes at 30°C compared to 0°C controls or in the absence of active kinases (Figure 6A). The in vitro kinase reactions of LARP1-CDK2 and LARP1-CK2 were further analyzed by mass spectrometry to identify CDK2 and CK2 phospho-sites. Out of five sites identified, four were confirmed to be CDK2 sites and one site was a CK2 site (Supplemental Table 3). Silencing of CDK2 in Huh7 cells lowered phospho-immunoprecipitated LARP1 by 65% compared to NC with a 23% decrease in total LARP1. The phospho/total ratio was decreased by 60% compared to NC (Figure 6B). The phospho-proteome of CDK2-silenced cells showed an inhibition of several LARP1 phospho-sites compared to NC (Figure 6C). This was associated with a decrease in expression of several TOP-encoded proteins (Figure 6D, supplemental Table 4). Even though CK2 phosphorylated recombinant LARP1 (Figure 6A and Supplemental Table 3), silencing CK2 did not alter the phosphorylation or content of LARP1 in Huh7 cells (data not shown). Forced expression of LARP1 induced translation as judged by induction in AHA labeling of newly synthesized proteins (Figure 7A). Silencing CDK2 did not inhibit translation at baseline but inhibited LARP1-mediated translation by 30% compared to NC or EV and by 60% compared to LARP1 OV (Figure 7A). The activity of CDK2 and the expression of its associated cyclin, cyclin E1, was induced in Mat1a-KO livers (Figure 7B), correlating with the induction of LARP1 phosphorylation (Table 1).
Figure 6. CDK2 phosphorylates LARP1 protein and regulates TOP-protein expression.

A. Recombinant, full-length LARP1 protein (rLARP1) was incubated with active CDK2 or CK2 enzymes in an in vitro kinase reaction at 0°C or 30°C (optimal kinase reaction temperature) as described under Experimental Procedures. Samples without kinase were used as controls. The western blot represents phospho-serine (PSer) antibody immunoprecipitated LARP1 from three determinations. B. Huh7 cells were transfected with a negative control or CDK2 siRNA for 48 hours as described under Experimental Procedures. Phosphorylation of LARP1 (PSer immunoprecipitation), LARP1 and CDK2 expression was measured by western blotting. Mean±SE expressed as percentage of negative control from 3 experiments, *p<0.05, #p<0.01 vs. negative control. C. The phospho-proteome of negative control or CDK2 siRNA-transfected Huh7 cells was evaluated by mass spectrometry for changes in LARP1 phospho-sites as described under Experimental Procedures. The heat map represents fold changes versus negative control (NC) from 4 experimental groups. P value less than 0.05 defines significance vs. NC. D. The total proteome from negative control or CDK2 siRNA-transfected cells was compared for TOP protein expression as described under Experimental Procedures. The heat map is representative of fold changes vs. NC from 4 experiments. P value less than 0.05 defines significance vs. NC.
Figure 7.

A. CDK2 regulates LARP1’s translational activity. Huh7 cells were transfected with EV or LARP1 vector with or without co-treatment with NC or CDK2 siRNA followed by AHA labeling and detection as described in Experimental Procedures. Mean±SE expressed as percentage of EV from 3 experiments. *p<0.05 vs. NC, EV or NC+EV, #p<0.01 vs. NC, EV or NC+EV, §p<0.05 vs. LARP1 OV. B. CDK2 activity is induced during SAMe deficiency in the Mat1a-KO livers. Phospho-T160-CDK2, total CDK2 and cyclin E1 in 10-month WT and Mat1a-KO livers were measured by western blotting. Mean±SE expressed as percentage of WT from 4 experiments. #p<0.01 vs. WT. C. Summary scheme. LARP1 activation and its effect on HCC progression in the setting of SAMe deficiency.
DISCUSSION
Downregulation of MAT1A in human NAFLD, HCC, and in mouse models causes depletion of liver SAMe reserves.(1,3,4) We have previously observed several kinases become activated when SAMe level falls and inhibited upon SAMe repletion.(1) This prompted us to investigate the liver phospho-proteome under SAMe deficiency to better understand the consequences of SAMe deficiency. We focused our investigation on LARP1 because the most striking pathway upregulated is translation and LARP1 hyperphosphorylation, both of which were inhibited by SAMe. We therefore focused on the phospho-sites of LARP1 that are SAMe sensitive.
LARP1 is the link between mTORC1 and protein synthesis, as phosphorylation of LARP1 by mTORC1 releases the inhibition that LARP1 exerts on translation. Subsequently phospho-LARP1 facilitates mTORC1-dependent translation initiation.(7) We have found LARP1 hyperphosphorylation and increased quantity of proteins that are part of the translational machinery in the Mat1a-KO model. LARP1 modulation during SAMe deficiency has not been examined before but recent work provided a link between SAMe levels and mTORC1 signaling.(33) Using in vitro HEK293-overexpression systems, it was shown that SAMTOR is a novel regulator of mTORC1 signaling. SAMe directly interacts with SAMTOR at a dissociation constant of ~ 7μM. SAMe concentrations lower than 7μM facilitate SAMTOR binding to GATOR1 (GTPase activating protein for RagA/B, that translocates mTORC1 to the lysosomal surface when activated by amino acids). Binding of GATOR1 to SAMTOR inhibits mTORC1 signaling.(33) According to this scenario, low SAMe reserves may inhibit whereas high SAMe level may enhance mTORC1 signaling. However, from our data in the Mat1a-KO liver, it appears that mTORC1 activity (Ser-2448 phosphorylation) is higher during SAMe deficiency and is strongly inhibited by increasing SAMe levels in the liver. We speculate that the mechanism of SAMe-sensing described by Gu et al(33) may not be applicable in the liver because the MATα1 enzyme provides a much higher steady state SAMe level of 50-100μM in hepatocytes.(34) This would cause constitutive mTORC1 activation in hepatocytes and this is not true under normal conditions. In fact, chronic mTORC1 activation results in HCC development due to ER stress and autophagy dysregulation.(35) We have discovered that LARP1 phosphorylation as well as protein content is induced during SAMe deficiency and not only does SAMe lower LARP1 phosphorylation and protein level via proteasomal degradation, it also inhibits LARP1’s translational activity. SAMe strongly suppressed LARP1 protein in multiple HCC cell lines but did not seem to alter its content in normal hepatocytes. One plausible explanation is that normal hepatocytes have high SAMe level(34) so that SAMe treatment may not be effective in regulating LARP1 as in the SAMe-deficient conditions of HCC cell lines. Consistently, the SAMe level in normal hepatocytes was 100-fold higher than that of HCC cell lines, SAMe-D and Huh7, and also higher than human hepatocytes. We speculate the reason human hepatocytes had lower SAMe levels is because they had been stored frozen in liquid nitrogen for some time. We found LARP1 content to be higher in human NASH, which has not been reported. We also found LARP1 to be enhanced in human HCC, consistent with published findings.(15) LARP1 induction was not limited to NASH, as we found it higher in chronic viral hepatitis and ASH. This finding is not surprising, as MAT1A expression falls in a variety of chronic liver diseases, cirrhosis, and HCC.(1)
Novel phospho-sites of LARP1 that are responsive to SAMe deficiency under pre-disease conditions (4-month Mat1a-KO) or in NASH (10-month KO) include T449, S471, S697, and S250. These sites were inhibited by SAMe treatment and most of them were predicted to be phosphorylated by CDK2 or CK2 kinases. We did not find any novel, mTOR-predicted phospho-site in this repertoire. Despite a global induction in mTOR activity during SAMe deficiency, we could not find previously published mTOR-responsive sites of LARP1 (S689)(7) to exhibit altered phosphorylation during SAMe depletion or replenishment. However other novel kinases such as CDK2 and CK2 were predicted to phosphorylate the SAMe-dependent sites of LARP1. We later confirmed that LARP1 site-specific phosphorylation was strongly induced by CDK2. The similarity between the CDK2 and mTOR sites is that their phosphorylation is associated with increased translation.(7) In contrast to the CDK2 sites, mTOR sites were not SAMe-sensitive and may differentially regulate LARP1’s translational ability for specific RNA targets. Consistent with induction of phospho-LARP1 by CDK2, we found that activation of CDK2 through p-T160 phosphorylation and expression of the CDK2 effector, cyclin E1, was enhanced during SAMe deficiency.
We tested the hypothesis that higher LARP1 content and functionality during SAMe deficiency may increase oncogenic activity. LARP1 overexpression induced the TOP-encoded proteome, TOP mRNA translation, growth, migration, and invasiveness of liver cancer cell lines. This data substantiated previously published work, which showed LARP1 positively regulated protein translation, cell division and migration in Hela cells.(36) Despite being induced in human NASH, we found that LARP1 silencing had no influence on palmitate-induced triglyceride accumulation, suggesting that LARP1 may not be involved in lipid metabolism. Instead, LARP1 is likely involved as an early driver of oncogenesis in the liver. Phosphorylation by mTOR or AKT is known to increase LARP1’s translational activity on TOP mRNAs.(7) We therefore examined whether the novel LARP1 phospho-sites that we found during SAMe deficiency modulated its translational activity. Phospho-site mutations of LARP1-T449 and S471 to alanine dramatically reduced its ability to induce global translation whereas other sites such as S697 and S250 had no effect. We examined the effect of LARP1 phosphorylation on growth and migration in Huh7 cell line that grows aggressively with a doubling time of 23-27 hours and a slow growing Hep3B cell line with a doubling time of 41-53 hours.(37) The T449A mutation completely prevented LARP1’s ability to induce growth and migration in both Huh7 and Hep3B cells. Despite its strong influence on global translation, the S471A mutation did not influence growth or migration in Huh7 cells and only partially inhibited growth and migration in Hep3B cells compared to WT LARP1. The S471 phospho-site appeared to regulate growth/migration of slow growing Hep3B cells but was ineffective in modulating the phenotype of aggressively growing Huh7 cells. In contrast, the T449 phospho-site regulated HCC properties regardless of the cell’s baseline growth characteristics.
In conjunction with LARP1 hyperphosphorylation, we found an overall surge in TOP mRNA-encoded protein expression under SAMe-deficient conditions (Mat1a-KO) that was sensitive to SAMe treatment. The data suggest a role of LARP1 hyperphosphorylation in inducing TOP-protein expression during SAMe deficiency and is further supported by the fact that forced expression of LARP1 in SAMe-D cells enhanced TOP protein expression. Based on these data, we hypothesized that LARP1 phospho-sites control TOP translation activity causing increased expression of oncogenic RPs during SAMe deficiency. To evaluate the effect of LARP1 phosphorylation on TOP expression we chose some oncogenic TOPs (RPS3, RPL15 and RPL18) that we and others found to be highly induced in human HCC tissues.(38) Recently, these TOPs were found to be part of a 24-gene pro-oncogenic ribosomal gene signature that could be used for prognosis of resectable HCC.(14) We found that LARP1 overexpression increased translational of RPS3 and RPL18 mRNAs compared to EV but did not influence RPL15 mRNA. This is consistent with our subsequent experiments showing RPS3 but not RPL15 protein induction after LARP1 overexpression.
RPS3 has been found by other researchers to be induced in HCC and correlated with aggressive phenotype.(39) LARP1 overexpression increased RPS3 protein level. The S471A but not the T449A mutant, inhibited LARP1-mediated RPS3 induction whereas S471E, the phospho-mimetic mutant, sustained RPS3 expression, suggesting that the LARP1-S471 site is important in regulating the translation of RPS3. RPL15 protein was not induced by LARP1 itself. One probable explanation for this could be that the phosphorylation of the T449 site in SAMe-D cells may not be enough to enhance RPL15 translation, allowing unphosphorylated LARP1 to interfere with RPL15 translation through 5'-UTR binding. This notion was supported by the finding that sustained phosphorylation caused by a T449E phospho-mimetic mutant induced RPL15 expression and a T449A phospho-mutant had the reverse effect. Despite its effect on the RPS3 protein, S471A mutations did not significantly influence RPL15 expression. Also, some other TOPs induced in HCC (RPL18) did not seem to be influenced by LARP1 phospho-sites. Hence only a subset of oncogenic TOPs appeared to be responsive to site-specific LARP1 phosphorylation.
By in vitro kinase assay followed by mass spectrometry evaluation of phosphorylated sites, we confirmed that predicted kinases, CDK2 and CK2, phosphorylated LARP1. The T449 along with S697, T101, and S444 sites were confirmed as CDK2 sites. Only one site (S843) of LARP1 was phosphorylated by CK2 kinase. CDK2 emerged as a novel kinase phosphorylating LARP1 at multiple sites. In line with this result, CDK2 silencing in Huh7 cells reduced overall LARP1 phosphorylation and site-specific phosphorylation at several sites including T449 that is a functional CDK2 site. Silencing CDK2 also inhibited LARP1’s translational activity in Huh7 cells. This was associated with a dramatic drop in several oncogenic TOPs that we found to be induced in HCC. Interestingly, CDK2 is overexpressed in HCC and along with its cyclin, cyclin E1, was recently shown to be essential for HCC initiation.(40) CK2 silencing did not significantly alter LARP1 phosphorylation. This could be explained by the smaller number of phosphorylation events mediated by this kinase.
Our overall results summarized in Figure 7C show that modulation of the LARP1-T449 phospho-site and its associated kinase, CDK2, under SAMe deficient conditions regulates a subset of pro-oncogenic RPs. The LARP1-T449 phosphorylation event is highly induced during SAMe deficiency, a condition known to be associated with NASH, ASH, chronic viral hepatitis and HCC pathologies.(1-3) The T449 site positively regulates HCC parameters of growth, migration, and invasiveness in liver cancer cells. Taken together, increased LARP1 content and activation during SAMe deficiency may be an important driver of NASH to HCC progression and lowering LARP1 or inhibiting its phosphorylation may delay the progression of NASH to HCC in the setting of SAMe deficiency.
Supplementary Material
Financial Support:
This work was supported by NIH grants R01DK123763 (K Ramani, JE Van Eyk, JM Mato, and SC Lu) and P01CA233452 (SC Lu), Plan Nacional of I+D SAF2017-88041-R (JM Mato). The funders had no role in study design, data collection and analysis, decision to publish, or preparation of the manuscript.
Abbreviations used (alphabetical order):
- TOP
5'-terminal oligopyrimidine
- ACN
acetonitrile
- AHA
azido-homoalanine
- ATCC
American Type Cell Collection
- BrDU
bromodeoxyuridine
- CDK2
cyclin-dependent kinase 2
- CHX
cycloheximide
- CK2
casein kinase 2
- Co-IP
co-immunoprecipitation
- CSMC
Cedars-Sinai Medical Center
- EV
empty vector
- FBS
fetal bovine serum
- FA
formic acid
- GAPDH
glyceraldehyde 3-phosphate dehydrogenase
- HCC
hepatocellular carcinoma
- HPRT1
Hypoxanthine Guanine Phosphoribosyltransferase 1
- KO
knockout
- LARP1
La-Related Protein 1
- mTORC1
mammalian target of rapamycin C1
- MAT1A
methionine adenosyltransferase 1A
- NAFLD
non-alcoholic fatty liver disease
- NASH
non-alcoholic steatohepatitis
- NC
negative control
- OPP
O-propargyl-puromycin
- OV
overexpression vector
- PCR
polymerase chain reaction
- RIPA
radioimmunoprecipitation assay buffer
- RP
ribosomal protein
- SAMe
S-adenosylmethionine
- SAMe-D
SAMe-deficient
- SC
scramble siRNA
- SCX
strong cation exchange
- TFA
trifluoroacetic acid
- TiO2
titanium dioxide
- TIC
total ion current
- TPP
Trans-Proteomic Pipeline
- WT
wild type
- XIC
extracted ion intensity
REFERENCES
- 1.Lu SC, Mato JM. S-adenosylmethionine in liver health, injury, and cancer. Physiol. Rev 2012;92:1515–1542. [DOI] [PMC free article] [PubMed] [Google Scholar]
- 2.Murphy SK, Yang H, Moylan CA, Pang H, Dellinger A, Abdelmalek MF, et al. Relationship between methylome and transcriptome in patients with nonalcoholic fatty liver disease. Gastroenterology 2013;145:1076–1087. [DOI] [PMC free article] [PubMed] [Google Scholar]
- 3.Michelotti GA, Machado MV, Diehl AM. NAFLD, NASH and liver cancer. Nat. Rev. Gastroenterol. Hepatol 2013;10:656–665. [DOI] [PubMed] [Google Scholar]
- 4.Noureddin M, Mato JM, Lu SC. Nonalcoholic fatty liver disease: update on pathogenesis, diagnosis, treatment and the role of S-adenosylmethionine. Exp. Biol. Med (Maywood) 2015;240:809–820. [DOI] [PMC free article] [PubMed] [Google Scholar]
- 5.Alonso C, Fernández-Ramos D, Varela-Rey M, Martínez-Arranz I, Navasa N, Van Liempd SM, et al. Metabolic identification of subtypes of nonalcoholic steatohepatitis. Gastroenterology 2017;152:1449–1461. [DOI] [PMC free article] [PubMed] [Google Scholar]
- 6.Fonseca BD, Zakaria C, Jia JJ, Graber TE, Svitkin Y, Tahmasebi S, et al. La-related Protein 1 (LARP1) represses terminal oligopyrimidine (TOP) mRNA translation downstream of mTOR complex 1 (mTORC1). J. Biol. Chem 2015;290:15996–16020. [DOI] [PMC free article] [PubMed] [Google Scholar]
- 7.Hong S, Freeberg MA, Han T, Kamath A, Yao Y, Fukuda T, et al. LARP1 functions as a molecular switch for mTORC1-mediated translation of an essential class of mRNAs. eLife 2017;6:e25237. [DOI] [PMC free article] [PubMed] [Google Scholar]
- 8.Philippe L, Vasseur JJ, Debart F, Thoreen CC. La-related protein 1 (LARP1) repression of TOP mRNA translation is mediated through its cap-binding domain and controlled by an adjacent regulatory region. Nucleic Acids Res. 2018;46:1457–1469. [DOI] [PMC free article] [PubMed] [Google Scholar]
- 9.Tcherkezian J, Cargnello M, Romeo Y, Huttlin EL, Lavoie G, Gygi SP, et al. Proteomic analysis of cap-dependent translation identifies LARP1 as a key regulator of 5'TOP mRNA translation. Genes Dev. 2014;28:357–371. [DOI] [PMC free article] [PubMed] [Google Scholar]
- 10.Aoki K, Adachi S, Homoto M, Kusano H, Koike K, Natsume T. LARP1 specifically recognizes the 3' terminus of poly(A) mRNA. FEBS Lett. 2013;58:7:2173–2178. [DOI] [PubMed] [Google Scholar]
- 11.Zhou X, Liao WJ, Liao JM, Liao P, Lu H. Ribosomal proteins: functions beyond the ribosome. J. Mol. Cell Biol 2015;7:92–104. [DOI] [PMC free article] [PubMed] [Google Scholar]
- 12.Xie X, Guo P, Yu H, Wang Y, Chen G. Ribosomal proteins: insight into molecular roles and functions in hepatocellular carcinoma. Oncogene 2018;37:277–285. [DOI] [PubMed] [Google Scholar]
- 13.Wang R, Wang X, Zhuang L. Gene expression profiling reveals key genes and pathways related to the development of non-alcoholic fatty liver disease. Ann. Hepatol 2016;15:190–199. [DOI] [PubMed] [Google Scholar]
- 14.Grinchuk OV, Yenamandra SP, Iyer R, Singh M, Lee HK, Lim KH, et al. Tumor-adjacent tissue co-expression profile analysis reveals pro-oncogenic ribosomal gene signature for prognosis of resectable hepatocellular carcinoma. Mol. Oncol 2018;12:89–113. [DOI] [PMC free article] [PubMed] [Google Scholar]
- 15.Roessler S, Jia HL, Budhu A, Forgues M, Ye QH, Lee JS, et al. A unique metastasis gene signature enables prediction of tumor relapse in early-stage hepatocellular carcinoma patients. Cancer Res. 2010;70:10202–10212. [DOI] [PMC free article] [PubMed] [Google Scholar]
- 16.Xie C, Huang L, Xie S, Xie D, Zhang G, Wang P, et al. LARP1 predict the prognosis for early-stage and AFP-normal hepatocellular carcinoma. J. Transl. Med 2013;11:272. [DOI] [PMC free article] [PubMed] [Google Scholar]
- 17.Vázquez-Chantada M, Ariz U, Varela-Rey M, Embade N, Martínez-Lopez N, Fernández-Ramos D, et al. Evidence for LKB1/AMP-activated protein kinase/endothelial nitric oxide synthase cascade regulated by hepatocyte growth factor, S-adenosylmethionine, and nitric oxide in hepatocyte proliferation. Hepatology 2009;49:608–617. [DOI] [PMC free article] [PubMed] [Google Scholar]
- 18.Mavila N, Tang Y, Berlind J, Ramani K, Wang J, Mato JM, et al. Prohibitin 1 acts as a negative regulator of Wingless/Integrated-Beta-Catenin signaling in murine liver and human liver cancer cells. Hepatol. Commun 2018;2:1583–1600. [DOI] [PMC free article] [PubMed] [Google Scholar]
- 19.Lu SC, Alvarez L, Huang ZZ, Chen L, An W, Corrales FJ, et al. Methionine adenosyltransferase 1A knockout mice are predisposed to liver injury and exhibit increased expression of genes involved in proliferation. Proc. Natl Acad. Sci. USA 2001;98:5560–5565. [DOI] [PMC free article] [PubMed] [Google Scholar]
- 20.Tomasi ML, Ramani K, Lopitz-Otsoa F, Rodríguez MS, Li TW, Ko K, et al. S-adenosylemthionine regulates dual-specificity MAPK phosphatase expression in mouse and human hepatocytes. Hepatology 2010;51:2152–2161. [DOI] [PMC free article] [PubMed] [Google Scholar]
- 21.Ramani K, Donoyan S, Tomasi ML, Park S. Role of methionine adenosyltransferase α2 and β phosphorylation and stabilization in human hepatic stellate cell trans-differentiation. J. Cell. Physiol 2015;230:1075–1085. [DOI] [PMC free article] [PubMed] [Google Scholar]
- 22.Ramani K, Tomasi ML, Berlind J, Mavila N, Sun Z. Role of A-Kinase anchoring protein phosphorylation in alcohol-induced liver injury and hepatic stellate cell activation. Am. J. Pathol 2018;188:640–655. [DOI] [PMC free article] [PubMed] [Google Scholar]
- 23.Stastna M, Thomas A, Germano J, Pourpirali S, Van Eyk JE, Gottlieb RA. Dynamic Proteomic and miRNA Analysis of Polysomes from Isolated Mouse Heart After Langendorff Perfusion. J Vis Exp.2018;138:58079. [DOI] [PMC free article] [PubMed] [Google Scholar]
- 24.Schiapparelli LM, McClatchy DB, Liu HH, Sharma P, Yates JR 3rd, Cline HT. Direct detection of biotinylated proteins by mass spectrometry. J. Proteome Res 2014;13:3966–3978. [DOI] [PMC free article] [PubMed] [Google Scholar]
- 25.Li Y, Lu L, Tu J, Zhang J, Xiong T, Fan W, et al. Reciprocal regulation between forkhead Box M1/NF-kB and methionine adenosyltransferase 1A drives liver cancer. Hepatology 2020;72:1682–1700. [DOI] [PMC free article] [PubMed] [Google Scholar]
- 26.Robinson AE, Binek A, Venkatraman V, Searle BC, Holewinski RJ, Rosenberger G, et al. Lysine & arginine protein post-translational modifications by enhanced DIA libraries: quantification in murine liver disease. J Proteome Res 2020;19:4163–4178. [DOI] [PubMed] [Google Scholar]
- 27.Parker SJ, Venkatraman V, Van Eyk JE. Effect of peptide assay library size and composition in targeted data-independent acquisition-MS analyses. Proteomics 2016;16:2221–2237. [DOI] [PubMed] [Google Scholar]
- 28.Teo G, Kim S, Tsou CC, Collins B, Gingras AC, Nesvizhskii AI, et al. mapDIA: Preprocessing and statistical analysis of quantitative proteomics data from data independent acquisition mass spectrometry. J. Proteomics 2015;129:108–120. [DOI] [PMC free article] [PubMed] [Google Scholar]
- 29.Stachowski MJ, Holewinski RJ, Grote E, Venkatraman V, Van Eyk JE, Kirk JA. Phospho-proteomic analysis of cardiac dyssynchrony and resynchronization therapy. Proteomics 2018;18:e1800079. [DOI] [PMC free article] [PubMed] [Google Scholar]
- 30.Deutsch EW, Mendoza L, Shteynberg D, Farrah T, Lam H, Tasman N, et al. A guided tour of the Trans-Proteomic Pipeline. Proteomics 2010;10:1150–1159. [DOI] [PMC free article] [PubMed] [Google Scholar]
- 31.MacLean B, Tomazela DM, Shulman N, Chambers M, Finney GL, Frewen B, et al. Skyline: an open source document editor for creating and analyzing targeted proteomics experiments. Bioinformatics 2010;26:966–968. [DOI] [PMC free article] [PubMed] [Google Scholar]
- 32.Shamsaei B, Chojnacki S, Pilarczyk M, Najafabadi M, Niu W, Chen C, et al. piNET: a versatile web platform for downstream analysis and visualization of proteomics data. Nucleic Acids Res. 2020;48:W85–W93. [DOI] [PMC free article] [PubMed] [Google Scholar]
- 33.Gu X, Orozco JM, Saxton RA, Condon KJ, Liu GY, Krawczyk PA, et al. SAMTOR is an S-adenosylmethionine sensor for the mTORC1 pathway. Science 2017;358: 813–818. [DOI] [PMC free article] [PubMed] [Google Scholar]
- 34.Cai J, Mao Z, Hwang JJ, Lu SC. Differential expression of methionine adenosyltransferase genes influences the rate of growth of human hepatocellular carcinoma cells. Cancer Res. 1998;58:1444–1450. [PubMed] [Google Scholar]
- 35.Menon S, Yecies JL, Zhang HH, Howell JJ, Nicholatos J, Harputlugil E, et al. Chronic activation of mTOR complex 1 is sufficient to cause hepatocellular carcinoma in mice. Sci. Signal 2017;5:ra24. [DOI] [PMC free article] [PubMed] [Google Scholar]
- 36.Burrows C, Abd Latip N, Lam SJ, Carpenter L, Sawicka K, Tzoiovsky G, et al. The RNA binding protein Larp1 regulates cell division, apoptosis and cell migration. Nucleic Acids Res. 2010;38:5542–5553. [DOI] [PMC free article] [PubMed] [Google Scholar]
- 37.Waldherr M, Mišík M, Ferk F, Tomc J, Žegura B, Filipič M, et al. Use of HuH6 and other human-derived hepatoma lines for the detection of genotoxins: a new hope for laboratory animals? Arch. Toxicol 2018;92:921–934. [DOI] [PMC free article] [PubMed] [Google Scholar]
- 38.Yoshihama M, Uechi T, Asakawa S, Kawasaki K, Kato S, Higa S, et al. The human ribosomal protein genes: sequencing and comparative analysis of 73 genes. Genome Res. 2002;12:379–390. [DOI] [PMC free article] [PubMed] [Google Scholar]
- 39.Zhao L, Cao J, Hu K, Wang P, Li G, He X, et al. RNA-binding protein RPS3 contributes to hepatocarcinogenesis by post-transcriptionally up-regulating SIRT1. Nucleic Acids Res. 2019;47:2011–2028. [DOI] [PMC free article] [PubMed] [Google Scholar] [Retracted]
- 40.Sonntag R, Giebeler N, Nevzorova YA, Bangen JM, Fahrenkamp D, Lambertz D, et al. Cyclin E1 and cyclin-dependent kinase 2 are critical for inhibition, but not for progression of hepatocellular carcinoma. Proc Natl. Acad Sci USA 2018; 115:9282–9287. [DOI] [PMC free article] [PubMed] [Google Scholar]
Associated Data
This section collects any data citations, data availability statements, or supplementary materials included in this article.