Abstract
Right ventricular (RV) pressure-volume (PV) analysis characterizes ventricular systolic and diastolic properties independent of loading conditions like volume status and afterload. While long-considered the gold-standard method for quantifying myocardial chamber performance, it was traditionally only performed in highly specialized research settings. With recent advances in catheter technology and more sophisticated approaches to analyze PV data, it is now more commonly used in a variety of clinical and research settings. Herein, we review the basic techniques for PV loop measurement, analysis, and interpretation with the aim of providing readers with a deeper understanding of the strengths and limitations of PV analysis. In the second half of the review, we detail key scenarios in which RV PV analysis has influenced our understanding of clinically relevant topics and where the technique can be applied to resolve additional areas of uncertainty. All told, PV analysis has an important role in advancing our understanding of RV physiology and its contribution to cardiovascular function in health and disease.
Subject Terms: Heart failure, hemodynamics, physiology
Introduction
Right ventricular (RV) function is a major determinant of morbidity and mortality for a variety of cardiovascular diseases.1 Despite its importance, RV function is challenging to characterize and quantify. Two-dimensional (2D) imaging modalities like echocardiography struggle to negotiate the ventricle’s irregular position in the chest and its asymmetric geometry. As a result, 2D-based echocardiographic measurements like tricuspid annular systolic plane excursion (TAPSE) and RV free wall longitudinal strain (FWLS) only characterize contractile function in a single direction or from a particular aspect of the ventricle. More sophisticated modalities like cardiac magnetic resonance (CMR) and three dimensional (3D) echocardiographic imaging, while able to overcome some of these limitations, provide predominantly volume-centric descriptions of RV function. Invasive assessments like right heart catheterization (RHC) are also limited in that they provide a pressure-centric perspective of RV function. Furthermore, all of these metrics of RV function – whether derived from imaging modalities or RHC – are subject to the influence of loading conditions.
Pressure-volume (PV) analysis addresses these shortcomings by combining simultaneous measurements of pressure and volume to generate load-independent measures of systolic and diastolic chamber properties, and is considered the gold-standard method for characterizing ventricular systolic and diastolic function, as well as ventricular-vascular interactions (Figure 1).2 Moreover, it is able to capture the dynamic changes in these relationships throughout the cardiac cycle in a way that pump function curves, which relate mean ventricular pressure to stroke volume, cannot.3 Recent advances in catheter technology and analysis of PV data have made the technique more accessible and easier to perform. While these techniques have been widely applied to understanding left ventricular (LV) mechanics in health and disease, they have only recently been applied in the RV with greater frequency. Herein we review the basic principles underlying RV PV analysis, as well as appropriate clinical and research-related applications that can advance our understanding of RV function and RV-pulmonary artery (PA) interactions.
Figure 1. Basic elements of the right ventricular pressure-volume diagram.
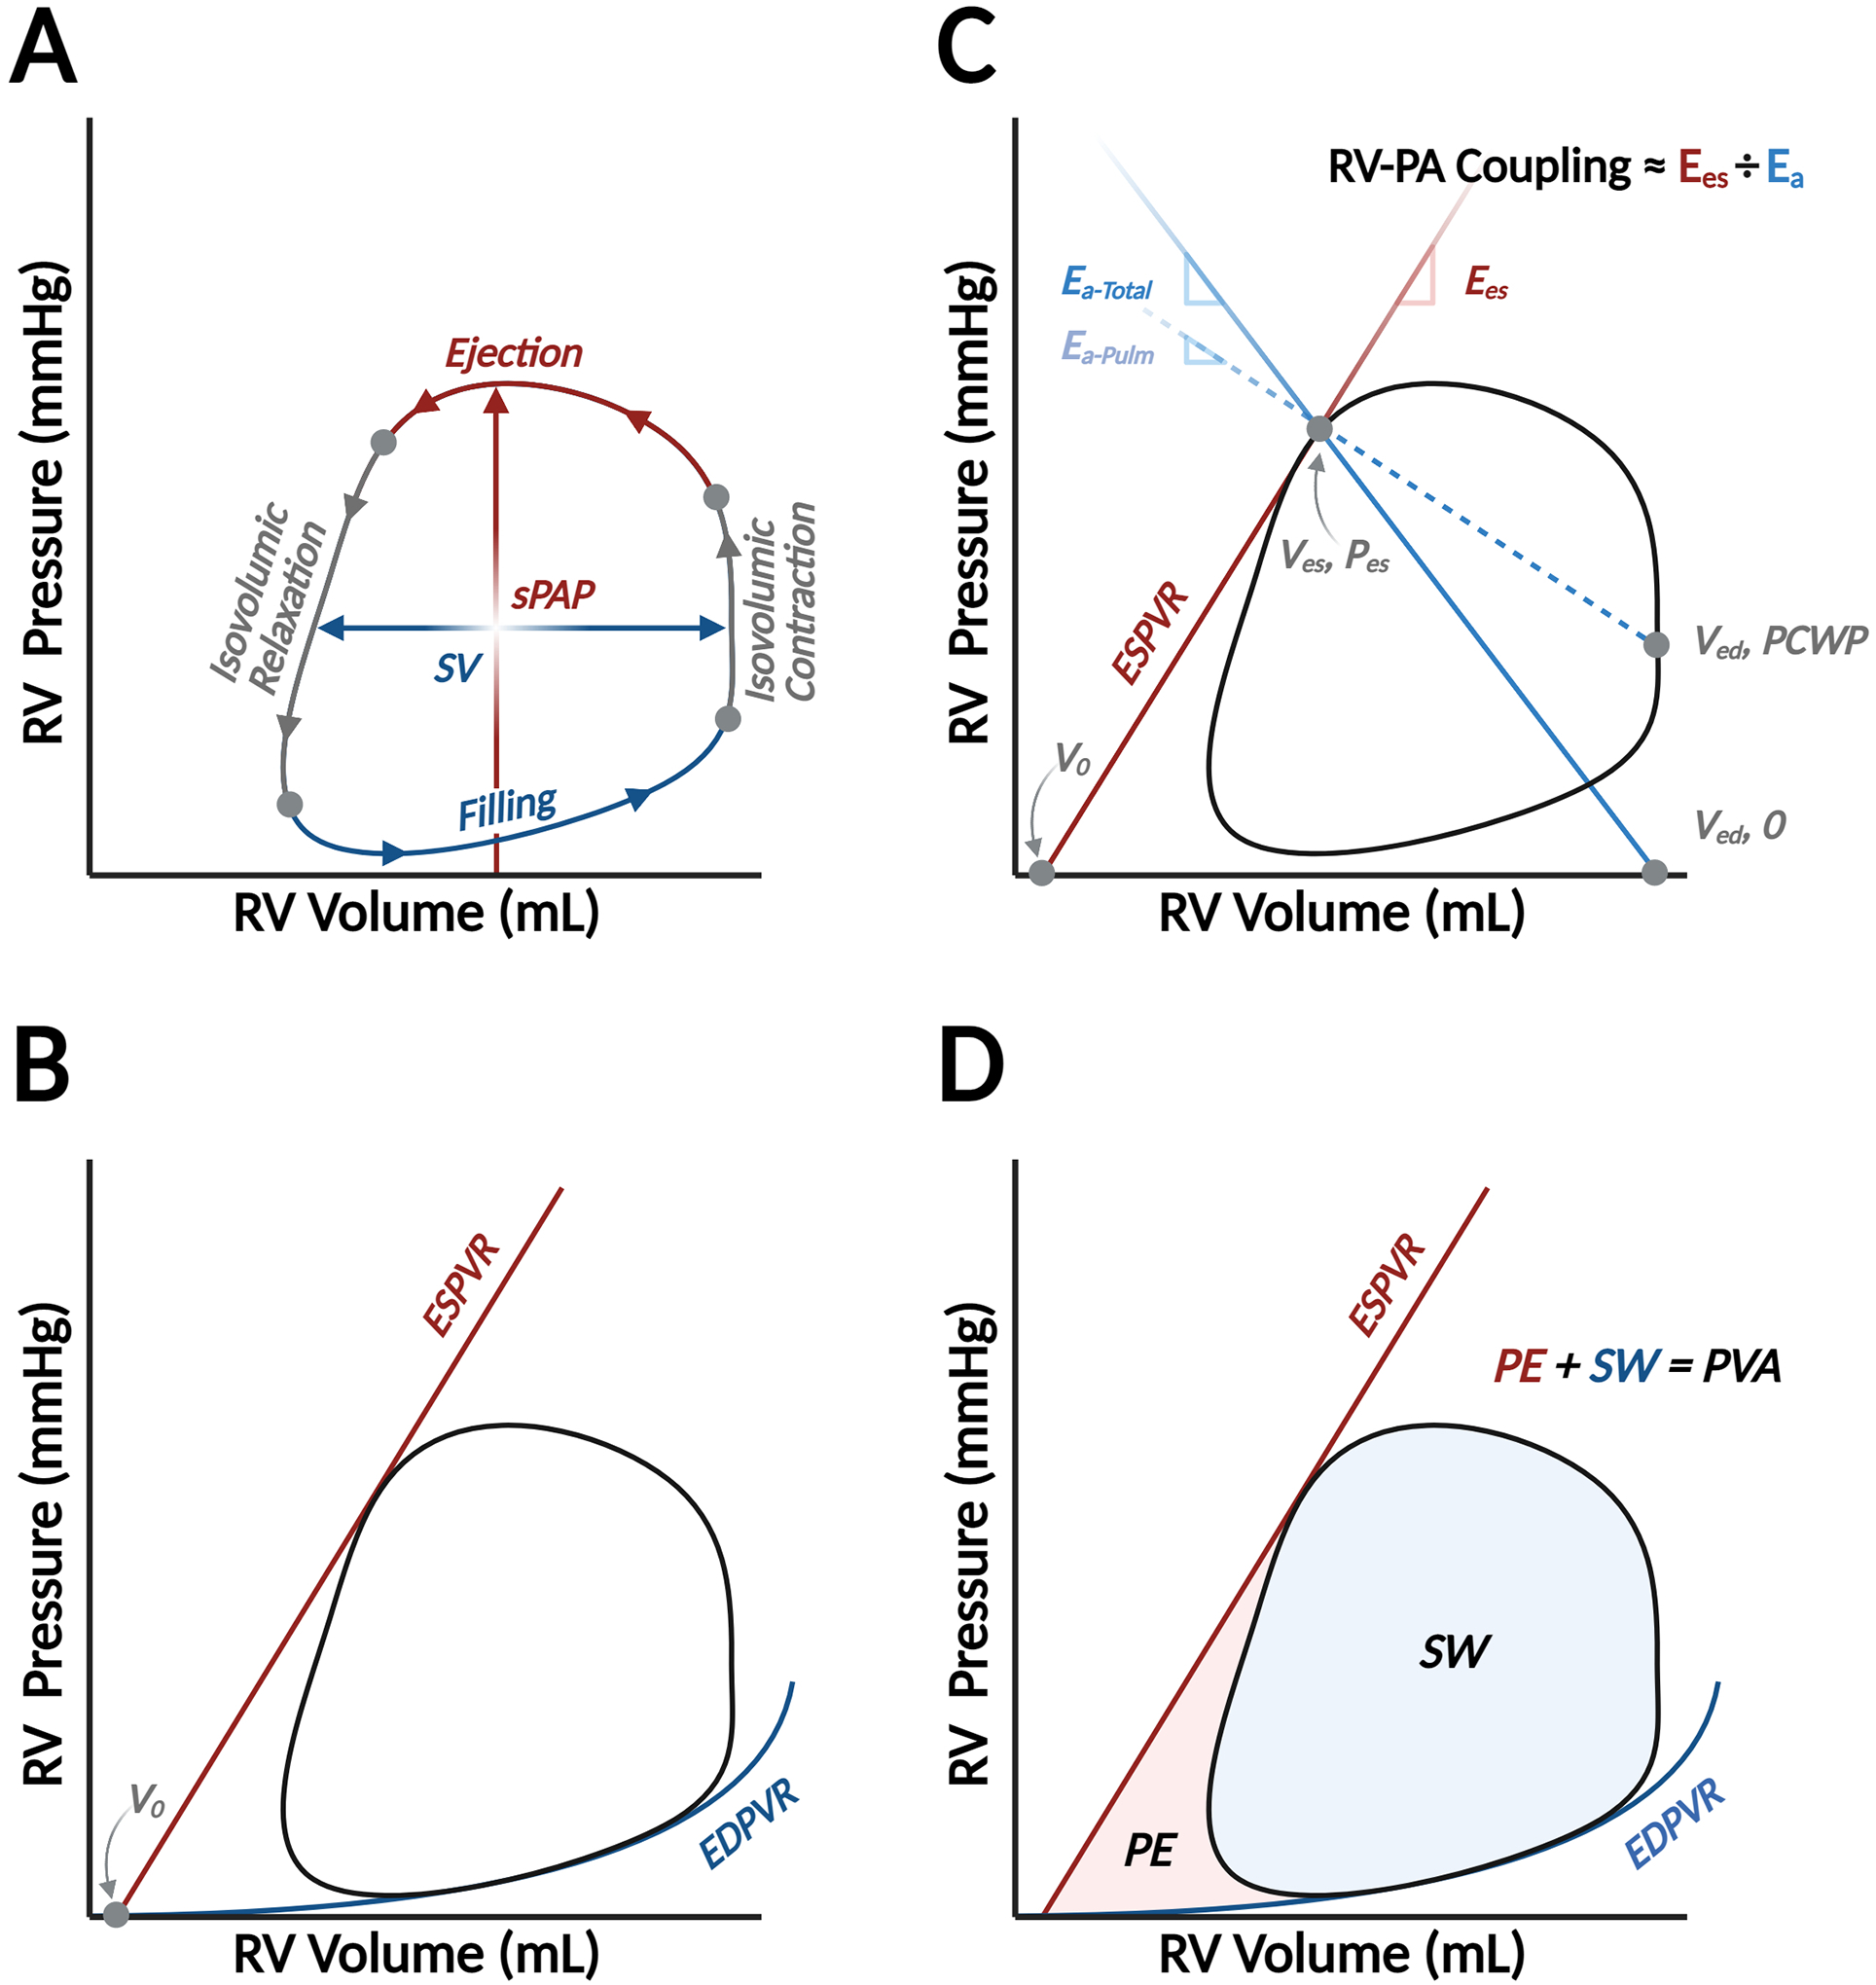
The pressure-volume (PV) diagram summarizes hemodynamic changes during one cardiac cycle, which is divided into four phases: ventricular filling, isovolumic contraction, ejection, and isovolumic relaxation (Panel A). The width of the loop represents ventricular stroke volume (SV), and the peak pressure is right ventricular or pulmonary artery systolic pressure (sPAP). Two fundamental relationships create boundaries for the PV loop: the end-systolic PV relationship, which describes ventricular contractile properties, and the end-diastolic PV relationship (EDPVR), which describes ventricular diastolic function (Panel B). ESPVR is reasonably linear and connects the end-systolic PV coordinate with the volume-axis intercept (V0), or the unstressed blood volume of the ventricle. The PV loop is also a valuable platform to relate vascular properties. Afterload can be characterized by effective arterial elastance, which is a lumped parameter (Ea-Total) reflecting the influence of downstream pressure (i.e., pulmonary capillary wedge pressure, PCWP) and intrinsic properties of the pulmonary vasculature (Ea-Pulm). Ea-Pulm is reflected by the slope of the line connecting the end-systolic PV coordinate with (Ved, PCWP), while Ea-Total connects the end-systolic coordinates and the volume-axis intercept at end-diastolic volume (Ved, 0).2 Relating systolic function, summarized by the slope of ESPVR (also known as end-systolic elastance, Ees), to Ea is the foundation of a concept called right ventricular (RV)-pulmonary arterial (PA) coupling (Panel C). Finally, myocardial energetics can also be inferred from the PV diagram. The space within the loop is stroke work (SW) and the potential space bound within the ESPVR and EDPVR but outside the loop is the potential energy (PE). The sum of SW and PE is PV area (PVA), which is linearly related to myocardial oxygen consumption (Panel D).
Methods Used to Measure RV PV Loops
PV analysis is performed with a specialized high-fidelity conductance catheter. While multiple catheter designs exist, currently, only CD Leycom (Hengelo, the Netherlands) manufactures a conductance catheter for clinical PV analysis that can be used in either the RV or LV. The principles of operation have been detailed previously4 and are illustrated in Figure 2. The catheter terminates with a pig-tail loop. Two sizes are produced: a 7Fr version that is inserted over a wire via Seldinger technique and a 4Fr version without a lumen. The catheter features a solid-state pressure sensor in the middle of an array of twelve equally spaced electrodes at its tip (three versions of the conductance catheter are produced with electrodes spaced either 8, 10, or 12 mm apart). A high frequency alternating electrical current of known amplitude passing between the most proximal and most distal electrodes sets up an electric field within the RV. Voltage drops measured between successive pairs of electrodes are inversely proportional to the cross-sectional RV area at the level of each electrode; segmental volumes are estimated by the product of that cross-sectional area and the known, fixed distance between electrodes. Total ventricular volume is then calculated by summation of the segmental volumes of each electrode pair resting within the RV chamber.
Figure 2. Conductance volumetry for pressure-volume analysis in the right ventricle.
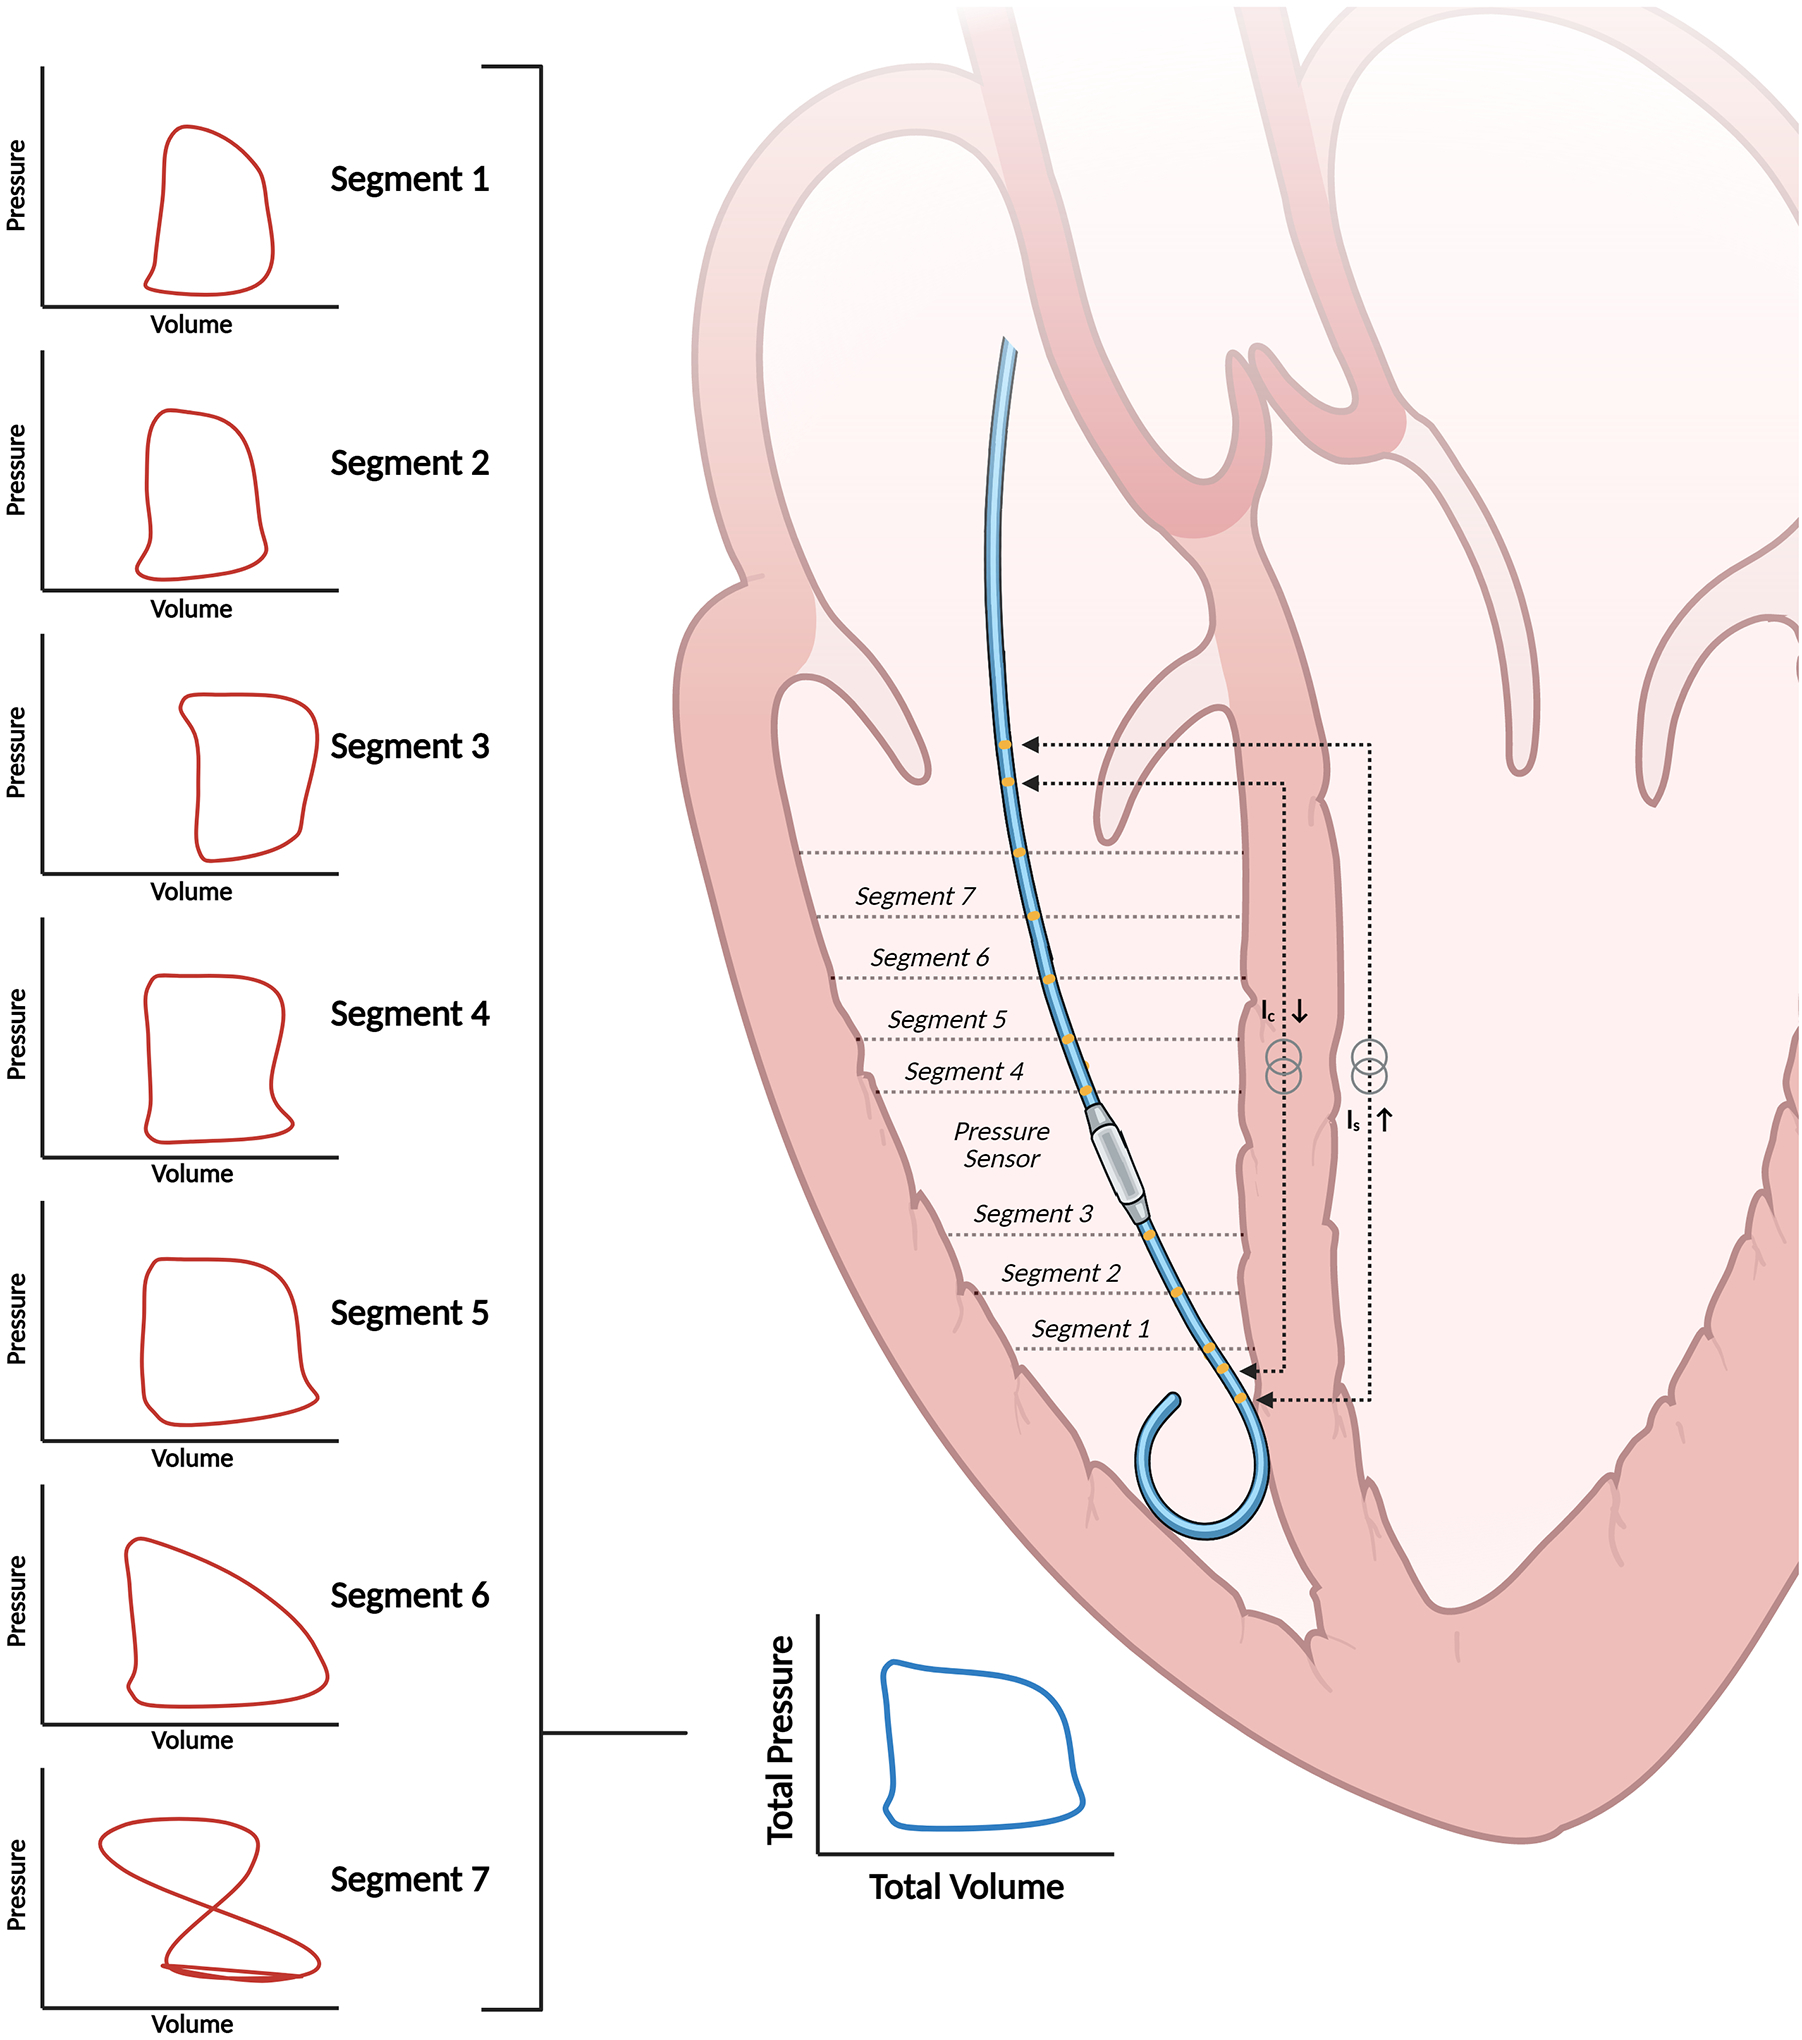
The catheter estimates ventricular volumes through the principle of conductance volumetry. Volumes from segments one through six in this case are used to calculate overall ventricular volume because the loop in segment seven is not counterclockwise, indicating that the electrode is extra-ventricular.
RV PV Loop Measurement Technique
RV PV loop measurements are traditionally obtained from either a right internal jugular or common femoral venous approach, depending on investigator preference. Maneuvering the conductance catheter into the RV apex from a femoral approach may be challenging under certain circumstances, but a frontrunning wire loop in the right atrium, a long sheath, and/or use of a steerable sheath can help overcome most difficulties.5 The 7Fr catheter is generally preferred because the over-the-wire technique maximizes the chances of successfully manipulating the catheter into the RV apex. Unique scenarios, e.g., patients with LV assist devices (LVAD) on anticoagulation, may warrant use of the smaller 4Fr catheter. Insertion of a sheath that is at least one French size larger than the conductance catheter allows operators to use the sheath’s side-port for blood draws and infusions. While a standard exchange-length 0.025” J-tipped guidewire usually suffices for routine insertion, escalation to a stiffer guidewire (i.e., Platinum Plus 0.025” guidewire, Boston Scientific, Marlborough, MA) may be necessary to facilitate appropriate placement of the catheter. All catheter manipulations should be performed under fluoroscopic guidance, and studies in patients with a recently implanted pacemaker or defibrillator lead should be avoided.
PV loops should be analyzed at end-expiration to minimize the contribution of intrathoracic pressure to RV pressure measurements (Figure S1). Accordingly, it is important to record clips that include a minimum of two respiratory cycles to be able to clearly identify loops at end-expiration. For patients who are intubated, PV loops may be acquired during a breath-hold maneuver to minimize variance in hemodynamics that occur throughout the respiratory cycle. Furthermore, data segments should be free of extra-systoles or other arrhythmias since they are not representative of the chamber`s mechanical state and may interfere with interpretation of the PV loop.6 The conductance catheter must be occasionally retracted off the RV wall to quell arrhythmias. In patients with atrial fibrillation, beats with similar R-R intervals are preferred for analysis. Finally, it should be noted that the conductance catheter may tether the tricuspid valve and introduce tricuspid regurgitation (TR), especially when additional catheters (i.e., Swan-Ganz catheter) are also crossing the valve. This phenomenon can be detected on the PV loop by exaggerated volume loss during the isovolumetric relaxation phase and can be resolved by either manipulating the catheter or attempting an alternative approach to enter the RV (i.e., switch from femoral to internal jugular venous access).
Conduction Catheter Calibration
The raw time varying signal provided by the conductance catheter, i.e., the conductance signal, C(t), is proportional to absolute RV volume over time. A gain factor (α) and an offset factor (Vp, called the parallel conductance offset) are required to convert this signal into absolute volume. There are different techniques for obtaining these calibration factors. α is typically calculated by dividing the stroke volume (SV) measured from other modalities by the difference between end-systolic and end-diastolic volume measurements from the conductance catheter (Ced-Ces) such that α = SV/(Ced-Ces).7 SV is typically determined from RHC (i.e., thermodilution or Fick determination of cardiac output divided by heart rate) or from an imaging modality. One method for determining Vp involves a rapid, 10 mL intravenous injection of hypertonic saline (5–10% NaCl) upstream from the conductance catheter (e.g., through the sheath side port). Hypertonic saline changes the conductivity of blood and, despite a constant time course of volume change during the cardiac cycle, the recorded C(t) signal increases progressively until returning to baseline as the hypertonic saline is cleared (Figure S2). Baan and colleagues outlined a method where the parallel conductance offset is determined by the intersection between the line of identity with a regression line derived when catheter-derived end-systolic pressure is plotted against end-diastolic pressure.8 However, the slope of the regression line, and therefore the location where the regression line intersects with the line of identity, is subject to error when derived from only a few PV loops recorded under the influence of hypertonic saline. These limitations, as well as the implications of administering a salt load patients with ventricular dysfunction, can be bypassed entirely by an alternative approach to determining Vp, which relies on an imaging modality, typically either CMR (which has the advantage of accurate volumetric assessment) or three-dimensional (3D) echocardiography (which has the advantage of being able to be performed in real-time as the PV loops are recorded) to obtain end-diastolic ventricular volume (Ved). After adjusting the conductance signal by the gain factor, Vp is simply determined by subtraction: Vp = α∙Ced – Ved. These gain factors are sensitive to conductance catheter position and the number of segments included in the estimation of total RV volume (discussed further below). Accordingly, new values of calibration factors are required each time the conductance catheter is moved and this should be considered when designing experiments where measurements required for repeated calibrations are not feasible.
PV Loop Analysis
The first step in the analysis involves choosing which of the available seven segments to include in the determination of total ventricular volume. Recall that the conductance catheter produces segmental PV loops from each adjacent pair of electrodes, and these segmental volumes are summated to produce the overall ventricular volume. However, depending on the size of the RV and the position of the catheter, some segments may not reside in the RV chamber. Segments outside the RV can be readily identified by irregularly shaped segmental loops, especially those which progress over time in a clockwise direction (volume increases during systole) instead of the normal counterclockwise direction (volume decreases during systole) (Figure 2). Abnormally shaped segmental loops may also be observed, reflecting contact with the ventricular wall, papillary apparatus, or the moderator band. These segments should be excluded, and it is critical that the same segments are used throughout the analysis of multiple loops measured over time.
Describing ventricular systolic and diastolic properties is among the key objectives of PV analysis, and this can be achieved by characterizing the end-systolic and end-diastolic PV relationships (ESPVR and EDPVR, respectively). The ESPVR is generally considered to be linear and characterized by a slope (end-systolic elastance, Ees) and a volume axis intercept (Vo). The EDPVR is nonlinear and has been characterized by different equations incorporating multiple parameters. These relationships can be assessed in two ways. The first method, referred to as the multi-beat method, connects ventricular pressure and volume coordinates at end-systole and end-diastole from a family of PV loops recorded under different loading conditions (Figure 3A).9 This technique is limited by the need to perform maneuvers that alter loading conditions, such as the Valsalva maneuver, external abdominal compression, or balloon-occlusion of the inferior vena cava, which may have secondary effects on sympathetic tone and contractile function. For example, the Valsalva maneuver increases sympathetic tone during phase IIB of the maneuver, which may artificially increase ventricular contractility and confound PV measurements. Furthermore, this method and other non-invasive methods like external abdominal compression require substantial patient cooperation and may not be feasible in all circumstances. Balloon occlusion is advantageous since it does not lead to any changes in sympathetic tone and is, therefore, our preferred method. However, balloon occlusion requires additional venous access, which may not be possible in certain clinical scenarios (e.g., during surgical procedures, anatomic constraints) or compatible with all protocols (e.g., those requiring lower extremity exercise). Finally, while these preload reducing maneuvers allow for accurate characterization of the ESPVR, they do not describe the exponential portion of the EDPVR, which occurs at larger volumes. As such, preload reducing maneuvers perform better at describing the portion of the EDPVR at lower volumes and pressures.
Figure 3. Multi- and single-beat methods and notable limitations for estimating end-systolic pressure-volume relationships.
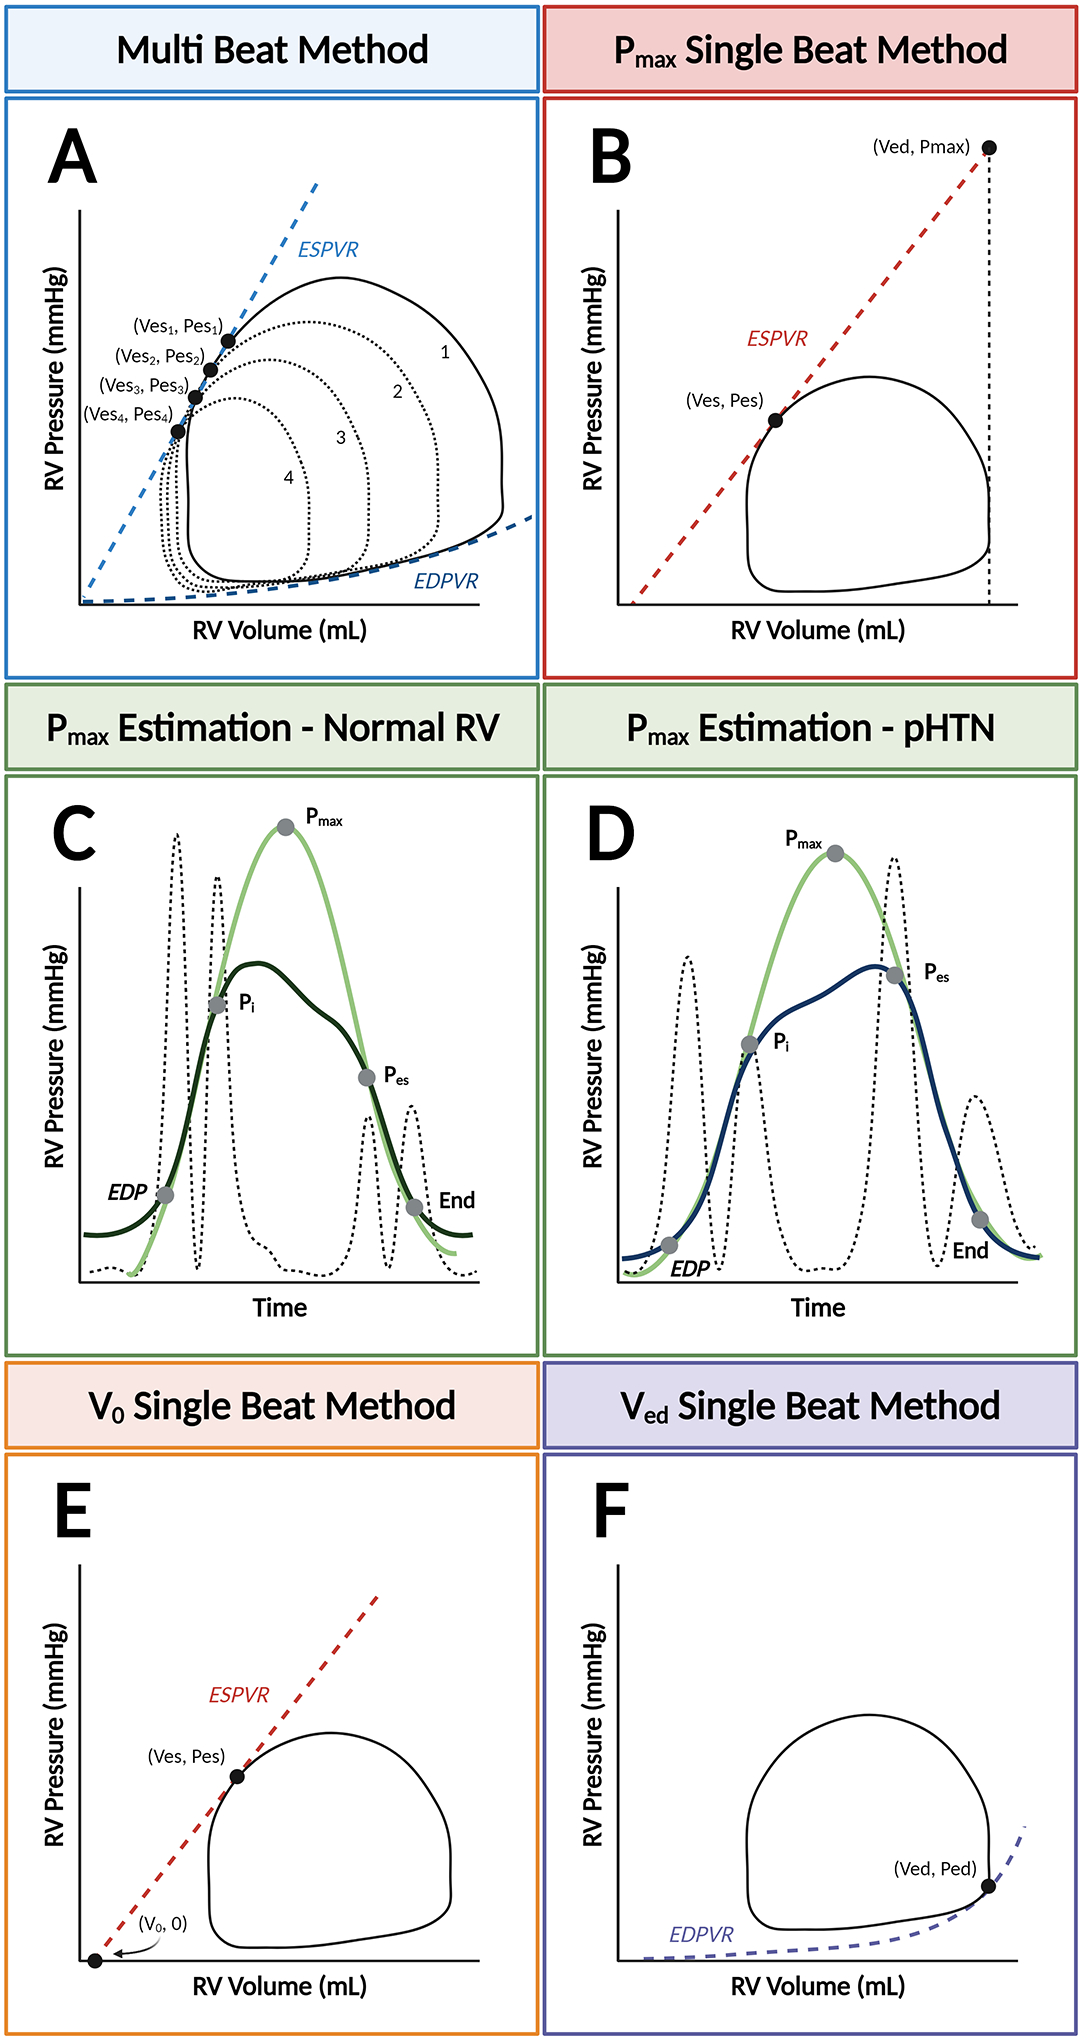
The end-systolic pressure-volume relationship (ESPVR) can be modeled with two different methods: the multi-beat method (Panel A), which plots ESPVR by connecting serial end-systolic PV coordinates, or the single-beat method, which extrapolates either the maximal isovolumic pressure (Pmax) (Panel B) or the volume-axis intercept (V0). Pmax is represented by the peak of a curve fitted to discrete points during the cardiac cycle from the right ventricular (RV) pressure waveform. Determination of these timepoints can be standardized by taking the second derivative of RV pressure squared (hatched line). With this method, the “up interval” for Pmax prediction extends from end-diastolic pressure (EDP) to the first major inflection point (Pi), and the “down interval” from Pes to the estimated end of isovolumic relaxation. This method is validated in patients with normal RV pressures (Panel C) and pulmonary hypertension (Panel D). Alternatively, determination of Vo can be used with the single-beat method (Panel E). Finally, the single-beat method for determining the end-diastolic PV relationship (EDPVR) relies on of the end-diastolic coordinate (Ved, Ped) (Panel F).
To overcome these technical challenges, single-beat methods for estimating both ESPVR and EDPVR have been described and validated.10, 11 Initially developed for the LV, single-beat estimation of the ESPVR most commonly entails prediction of the maximal pressure that would have been achieved if ventricular contraction remained isovolumic (Pmax) (Figure 3B). Sunagawa et. al established a method for fitting an equation to the isovolumic portions of the LV pressure-time curve to derive a value for Pmax.12 When combined with end-systolic pressure (Pes) and measurement of SV, this method provides an estimate of the slope of the ESPVR expressed as Ees in mmHg/mL and calculated as (Pmax – Pes)/SV. Brimioulle and colleagues have validated a single-beat estimation of ESPVR using Pmax from invasive PV data,13 but extrapolating Pmax from the more readily available RV pressure-time tracings is more challenging in the RV than in the LV because the beginning and end of the isovolumic periods are less well defined. Accordingly, methods have been described to improve identification of these discrete time points during the cardiac cycle and, thus, provide less variable predictions of Pmax. For example, taking the second derivative squared of the RV pressure signal identifies four peaks that can be used to mark the beginning and end of the isovolumic periods (contraction = EDP to Pi and relaxation = Pes to end-systole; Figure 3C). This method has been validated not only under normal conditions, where end-systolic pressure is significantly lower than peak RV pressure when ejection is prolonged, but also when pulmonary hypertension is present, end-systolic pressure and peak RV pressure are similar, and ejection time is shortened, similar to what is observed in the LV (Figure 3D). The challenges associated with this Pmax-based method can also be obviated with an alternative method for estimating the slope of the ESPVR, which was proposed by Senzaki, Chen, and Kass,14 whereby V0 is estimated and the ESPVR is determined by the line connecting the end-systolic coordinate (Ves, Pes) with V0 (Figure 3E). While this method has been compared with non-invasively constructed PV loops using CMR and RHC data in patients with pulmonary hypertension,15 it has not been directly validated against RV PV loops obtained using the conductance method.
Aided by recent efforts to standardize the prediction of Pmax and definition of Pes, simultaneous single-beat estimations of RV Ees and effective arterial elastance (Ea) have also become widely used to characterize RV-PA coupling.16–18 Using these refinements, Richter et. al reported that in a clinical population with pulmonary arterial hypertension (PAH), single-beat quantification of RV-PA coupling accurately reflected RV-PA coupling measured using the multi-beat method.19
The single-beat method for estimating the EDPVR is somewhat simpler, requiring only measurement of end-diastolic volume and pressure coordinates (Ved, Ped) (Figure 3F).20 Based upon the observation that when normalized to volume, the shape of the EDPVR stays constant, this method has been validated using ex-vivo and in-vivo LV PV data (12).
Clinical Applications for RV PV Analysis
With improved catheter technology and easier signal processing, RV PV analysis is being performed with increased regularity in several clinical scenarios (Figure 4). In these scenarios, patients typically undergo non-invasive evaluations of RV function with multiple different modalities (i.e., echocardiography and cross-sectional imaging) which yield conflicting conclusions or are incongruent with their symptomatology. PV analysis can help resolve the uncertainty created by these non-invasive studies by quantifying RV systolic and diastolic function and the nature of ventricular-vascular interactions with measures like the RV-PA coupling ratio. Additionally, PV analysis can be used in clinical contexts where characterizing immediate changes in RV function during an intervention is useful (i.e., LVAD speed optimization test or transcatheter edge-to-edge tricuspid repair). Below, we review some of these applications and illustrate how RV PV analysis can provide a comprehensive picture of RV performance which is ultimately clinically relevant and impactful for diagnosis, management, and prognostication.
Figure 4. Summary of clinical applications for right ventricular pressure-volume analysis.

Right ventricular (RV) pressure-volume analysis can help characterize RV physiology in a variety of conditions and clinical settings.
Resting and Exertional Right Ventricular Function in the Healthy Heart
Cornwell and colleagues performed the first-in-human RV PV analysis in healthy subjects during rest and exercise in an upright position. In so doing, they demonstrated the feasibility of PV loop acquisition during upright cycle ergometry.21 PV loops from these healthy individuals displayed the classic domed shape and illustrate how RV end-systolic pressure decays nearly to end-diastolic pressure during exercise and, unlike LV physiology, that ejection proceeds well past end-systole. The loops illustrate that the healthy RV is a highly compliant chamber with a large contractile reserve; indices of contractility increase by three- to four-fold from rest to peak exercise (Figure S3).22 RV-PA coupling (indexed by the ratio between Ees and Ea)23 was also maintained throughout the spectrum of exercise intensity as Ees increased in step with the rise of Ea.24
Pulmonary Hypertension
The ability to simultaneously describe ventricular and vascular properties makes PV analysis a valuable tool to characterize the hemodynamic consequences of pulmonary hypertension. For example, in World Health Organization (WHO) Group I pulmonary arterial hypertension (PAH), where RV function strongly influences prognosis, PV analysis is helpful in identifying early stages of RV systolic dysfunction that would otherwise go unrecognized by traditional imaging and hemodynamics modalities. RV diastolic stiffness, when assessed by properties of the EDPVR, is also associated with disease progression in patients with PAH.25 The PV loop in PAH, where PA pressures approach systemic pressures, morphs and can take on a distinctive, notched or trapezoidal shape. (Figure 5).26 Specifically in this setting, Hsu and colleagues also demonstrated that RV-PA coupling, assessed by the ratio of Ees to Ea, identified occult RV dysfunction with greater sensitivity than traditional measures.27 More than just an academic construct, catheter-derived Ees/Ea predicted clinical worsening in PAH patients better than existing measures like RV ejection fraction, suggesting that such measurements can add value to current standards of practice.28 In addition, Tedford and colleagues found that Ees/Ea identified RV dysfunction which was not even detected during right heart catheterization.29 At a mechanistic level, derangements in RV Ees correlate with intrinsic RV myocyte dysfunction, providing a plausible explanation for the association with adverse outcomes.30
Figure 5. Changes in the right ventricular pressure-volume loop contour in patients with vs. without pulmonary hypertension.
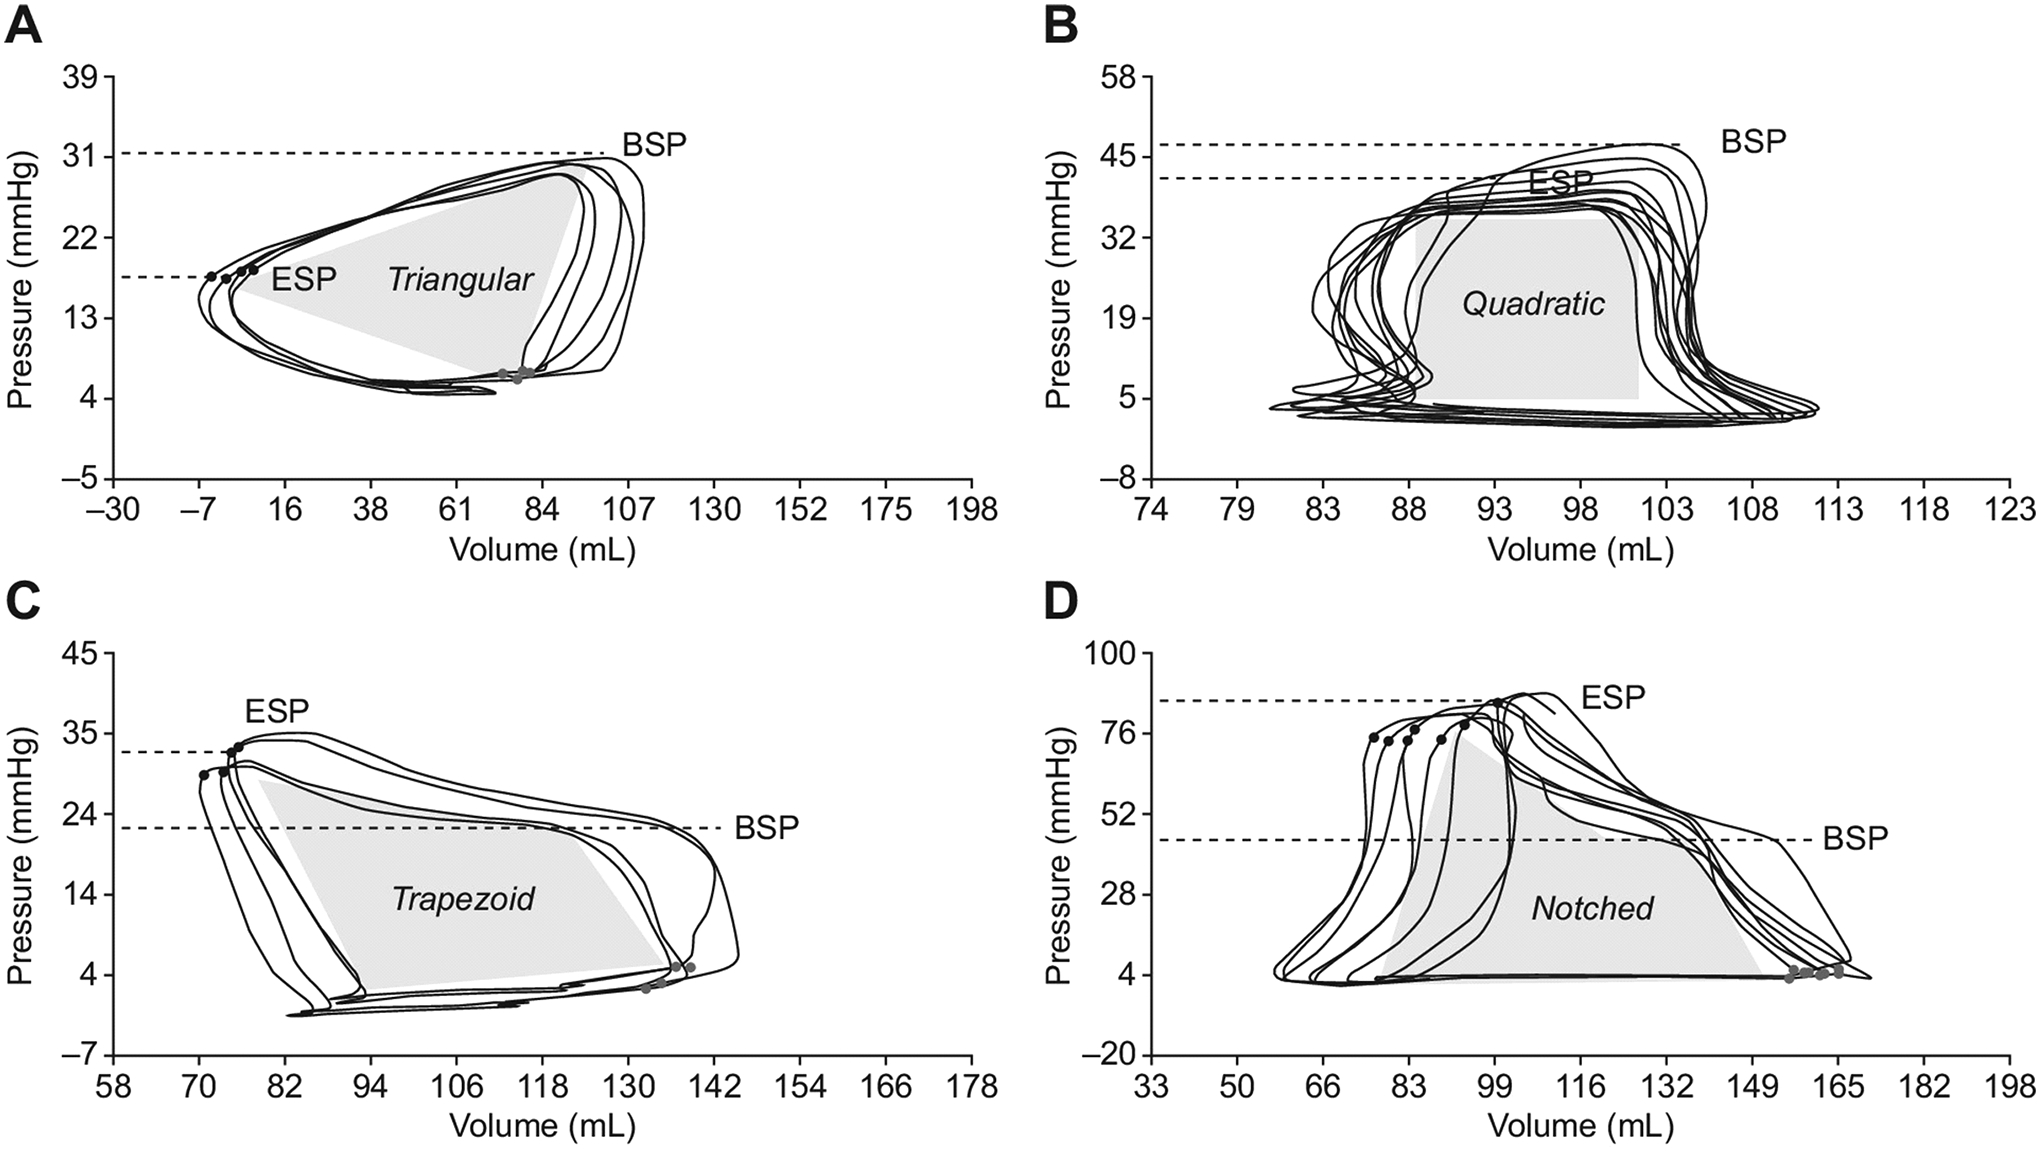
Characteristic triangular (Panel A), quadratic (Panel B), trapezoid (Panel C), and notched (Panel D) RV PV loop morphologies, which are associated with varying differentials between pulmonary artery (PA) beginning systolic pressure (BSP) and end-systolic pressure (ESP). Adapted from Richter MJ, et al. Right ventricular pressure-volume loop shape and systolic pressure change in pulmonary hypertension. Am J Physiol Lung Cell Mol Physiol 2021;320(5):L715-l725.26
Heart Failure with Preserved Ejection Fraction
Heart failure with preserved ejection fraction (HFpEF) has now outpaced heart failure with reduced ejection fraction as the leading cause of HF.31 HFpEF is associated with a poor prognosis, especially in patients with concurrent RV dysfunction, which occurs in up to half of all HFpEF cases.32, 33 PV analysis may help resolve some of the significant knowledge gaps that remain regarding the underlying pathophysiology of HFpEF and the RV’s contribution to the pathophysiology in a number of well-recognized HFpEF populations. PV analysis may also facilitate deeper understanding of the different HFpEF phenotypes and predict response to various treatments.
To this end, Rommel and colleagues performed the first-in-human RV PV analysis in patients with HFpEF.34 Patients with HFpEF had preserved RV systolic function with Ees values that were higher than in healthy controls, but demonstrated severe impairments in diastolic function such as increased load-independent RV stiffness and impaired active relaxation, akin to what has been previously documented in the LV of patients with HFpEF (Figure S4). These abnormalities were even more pronounced with stress and handgrip exercise, where the RV was unable to increase SV and augment CO.
A more recent study pairing PV analysis with CMR suggested more wide-ranging abnormalities in the right heart in patients with HFpEF and implicated an abnormal interplay between the right atrium and RV (i.e., RA-RV coupling) as an important contributor to the pathophysiology of HFpEF.35 This observation may be a hallmark of early adaptations to HFpEF physiology in the RA-RV-PA circuit which eventually progresses over time and evolves into the combined systolic and diastolic RV dysfunction observed in later stages of HFpEF.36 Considering the prevalence of HFpEF and the many unanswered questions regarding the pathophysiology, PV analysis is primed to play an important role in future studies seeking to further characterize the hemodynamic perturbations associated with HFpEF, the determinants of disease progression, and response to different therapies.
Durable Mechanical Circulatory Support
RV function influences symptoms, quality of life, and prognosis for patients with end-stage heart failure supported by a left ventricular assist device (LVAD). While invasive evaluations of RV function (i.e., RHC-guided hemodynamic-echocardiographic speed optimization tests) may optimize LVAD performance,37 our understanding, at a mechanistic level, of the nature of RV dysfunction post-LVAD implantation is limited. A recently published study applying RV PV analysis to LVAD recipients demonstrated that even patients with echocardiographically normal appearing RVs had only modest inotropic reserve during exercise and experienced dramatically increased LV filling pressures.38 Another analysis demonstrated changes in systolic and diastolic function with increasing LVAD speed, lending credence to the theory that at least in some patients, LV unloading may contribute to RV dysfunction due to interventricular interactions (Figure 6).39 In this study, three different patterns of interventricular interaction were observed as a function of LVAD speed: cases with changes in RV diastolic function only, changes in RV diastolic and systolic function, and cases without any changes in the RV PV loop with increased LVAD speed. The RV became more compliant with increased LVAD speed, indicating favorable effects on diastolic function, while contractility tended to decline, suggesting unfavorable effects on systolic function. The balance between these opposing forces is patient specific and further work is required to determine the prevalence of these different RV responses to LV unloading and their clinical implications.
Figure 6. Changes in right ventricular properties with increasing left ventricular assist device speed.
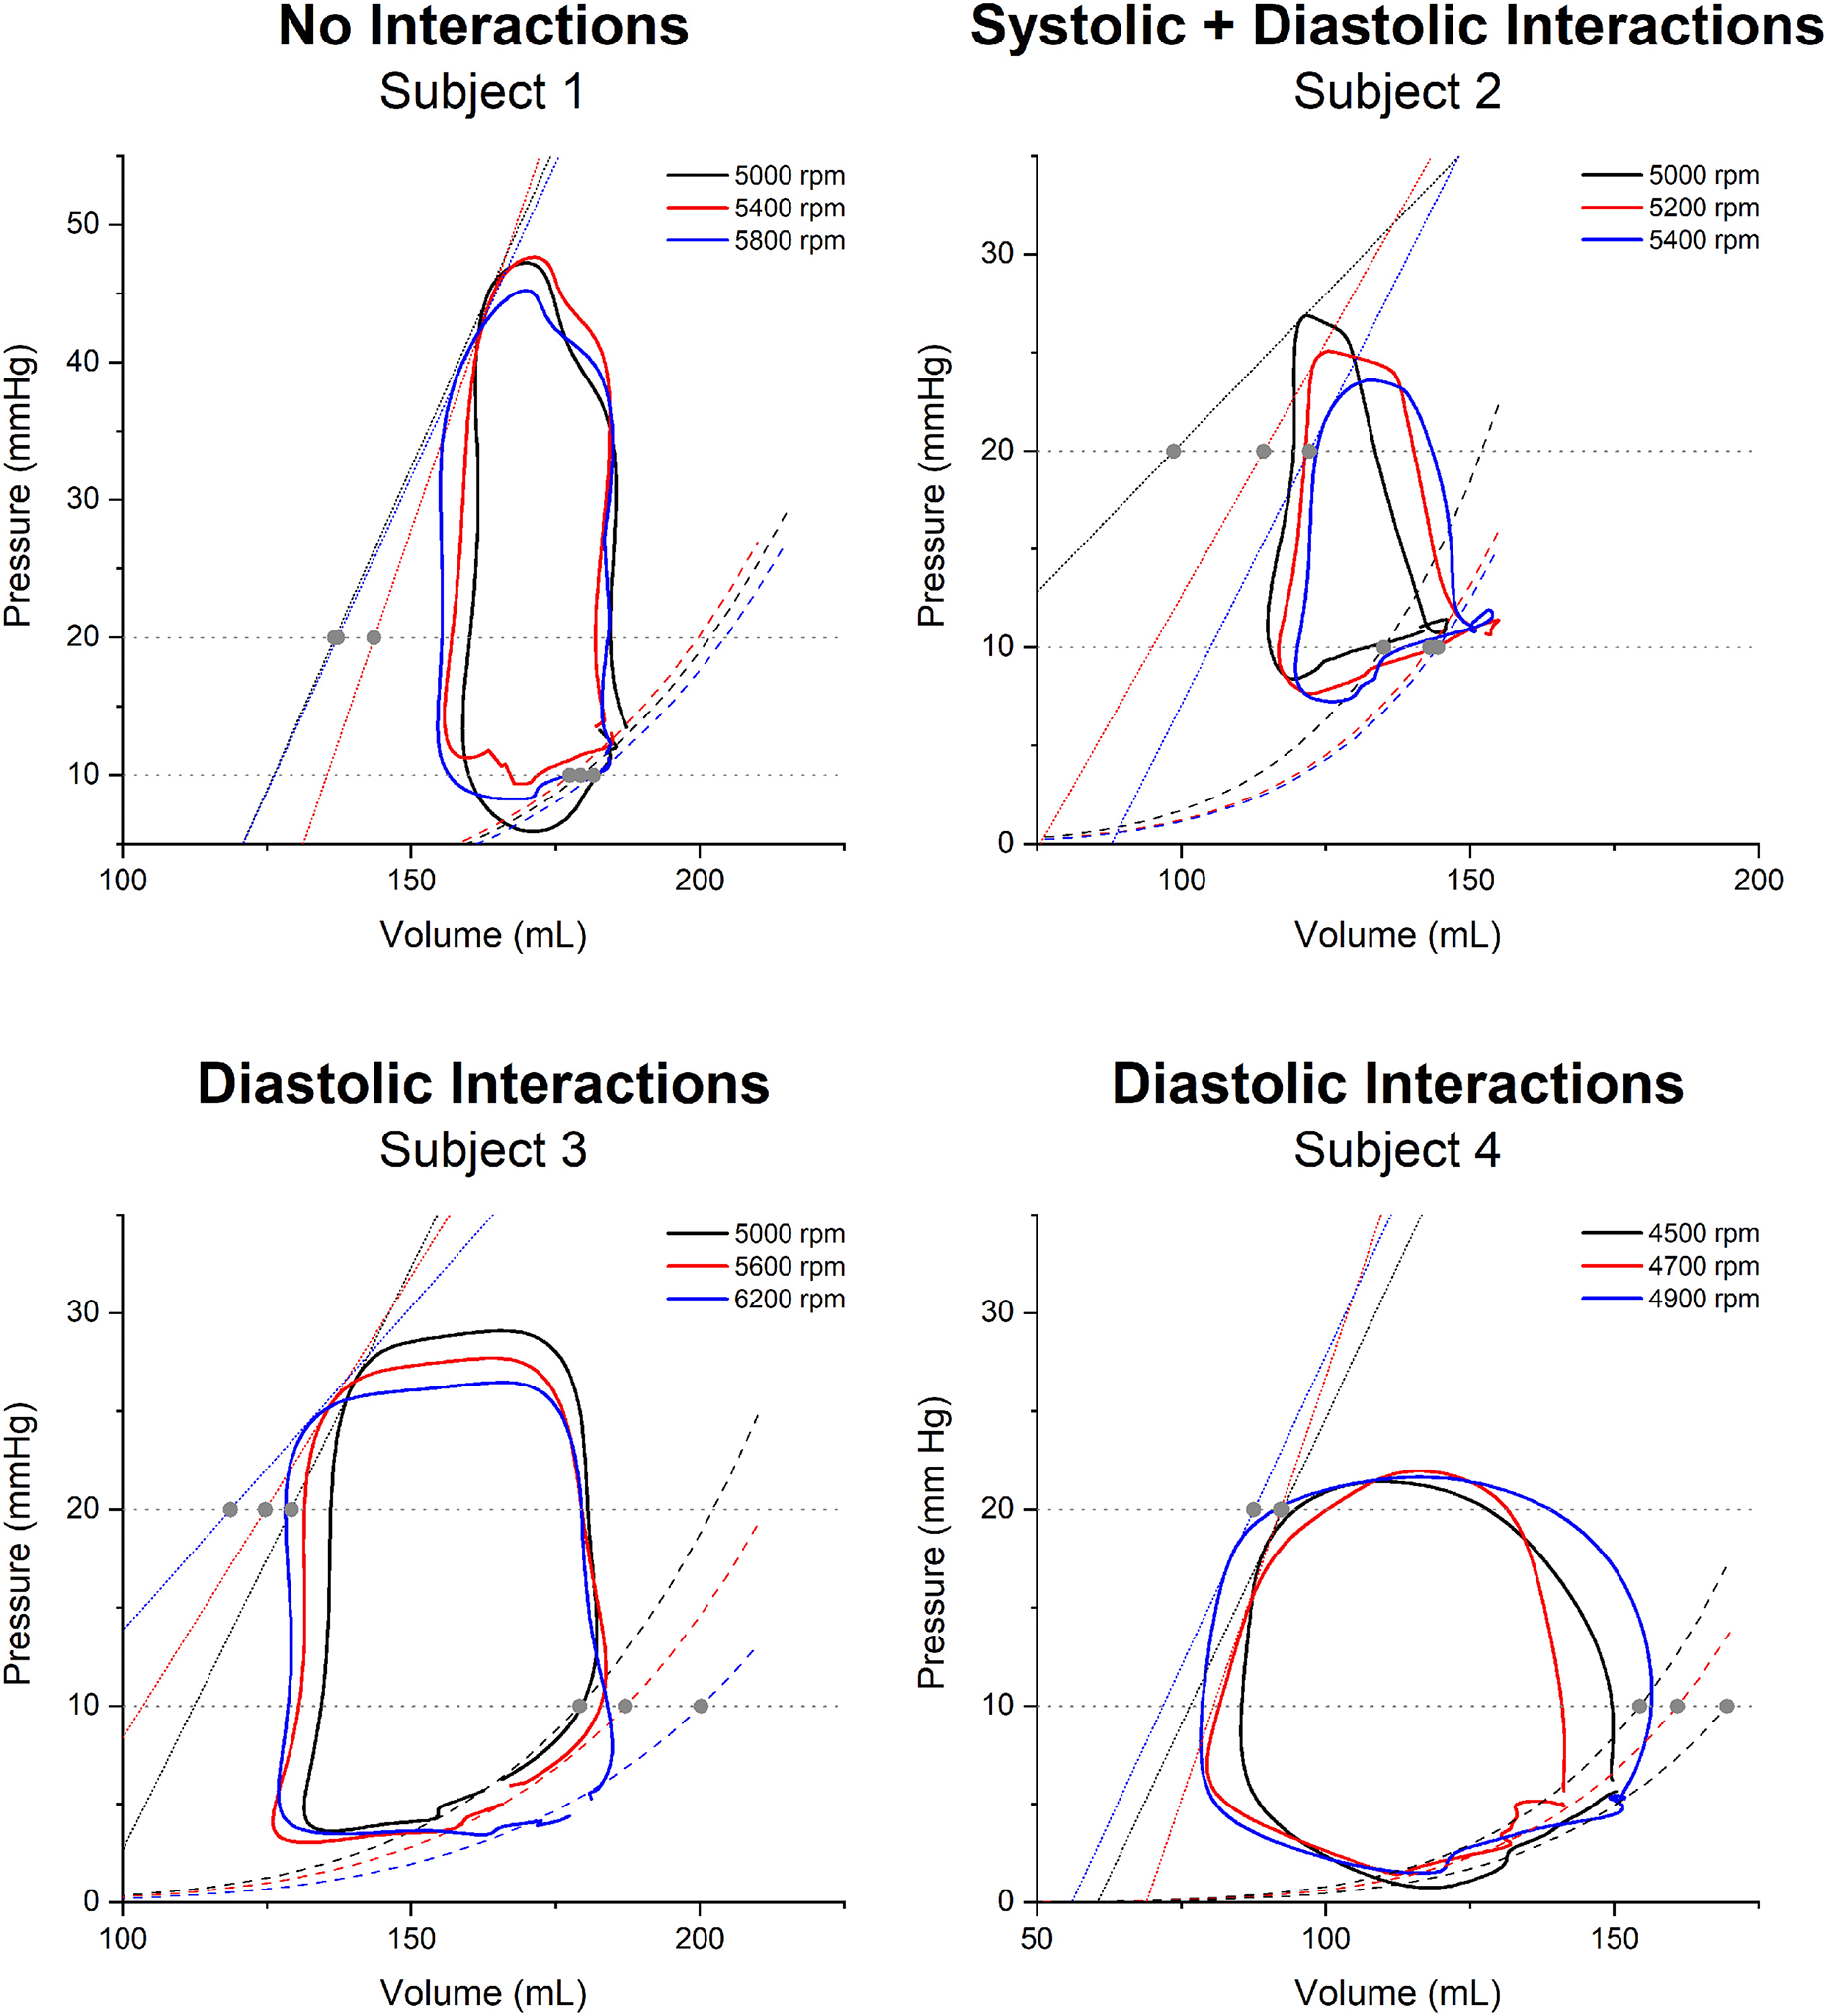
Changes in systolic and diastolic function result in decreased contractile function and increased ventricular compliance, respectively. These changes were not reproduced uniformly in a series of four patients during a left ventricular assist device speed optimization test. Adapted from Brener MI, et al. Right Ventricular Pressure-Volume Analysis During Left Ventricular Assist Device Speed Optimization Studies: Insights Into Interventricular Interactions and Right Ventricular Failure. J Card Fail. 2021;27:991–1001.39
Furthermore, PV analysis may also ultimately help address two critical, clinically relevant questions in patients with end-stage HFrEF with durable mechanical support: 1) what LVAD speed optimizes LV function, aortic valve opening while minimizing aortic insufficiency, septal position, and reduces mitral regurgitation, and 2) which patients benefit from upfront RV mechanical circulatory support at the time of LVAD implantation. The ongoing REVIVAL-VAD (Right HEart Catheterization and Pressure Volume Analysis In the Right Ventricle in PAtients Before and After Left Ventricular Assist Device Implantation) trial aims to resolve these areas of uncertainty and will be an important proof-of-concept study for using PV analysis in a clinical context.
Valvular Heart Disease
Finally, the burgeoning field of transcatheter therapy for valvular heart disease presents a unique opportunity to evaluate RV physiology with PV analysis. Despite satisfactory clinical outcomes in randomized controlled trials of interventions for aortic stenosis (AS), there is broad variability in outcomes in real-world practice following technically successful transcatheter aortic valve replacement (TAVR) and surgical aortic valve replacement (SAVR), which may be explained by pre- and post-procedural RV dysfunction.40 To date, there is only one report describing RV PV loops in a patient with bicuspid aortic valve disease and severe AS.41 The RV loops featured a prominent isovolumic contraction phase, similar to what is observed with LV PV loops, suggesting the presence of increased afterload in the pulmonary circulation, akin to what has been described in conditions like PAH (Figure 7, Panel A). The LV PV loops during TAVR deployment with a balloon expandable valve show signs of significant ventricular stunning following the period of rapid pacing and valve deployment and only partial recovery by the end of the procedure, raising concerns that a similar phenomenon may occur in the RV, where the capacity to recover may be even more limited.
Figure 7. Right ventricular pressure-volume loops before and after transcatheter valvular intervention.
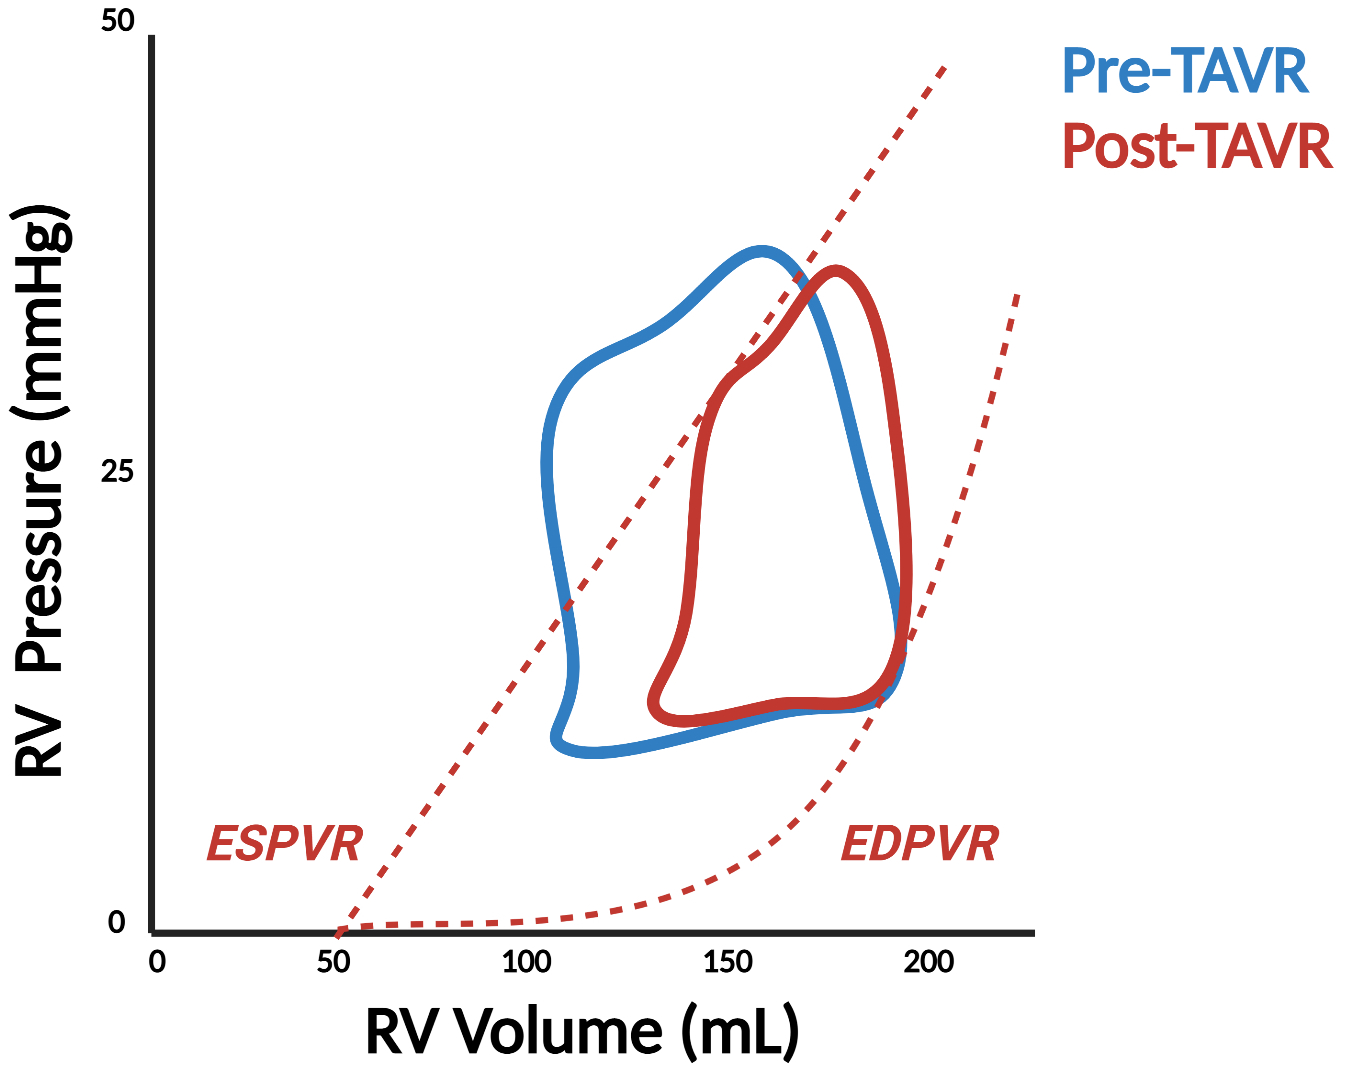
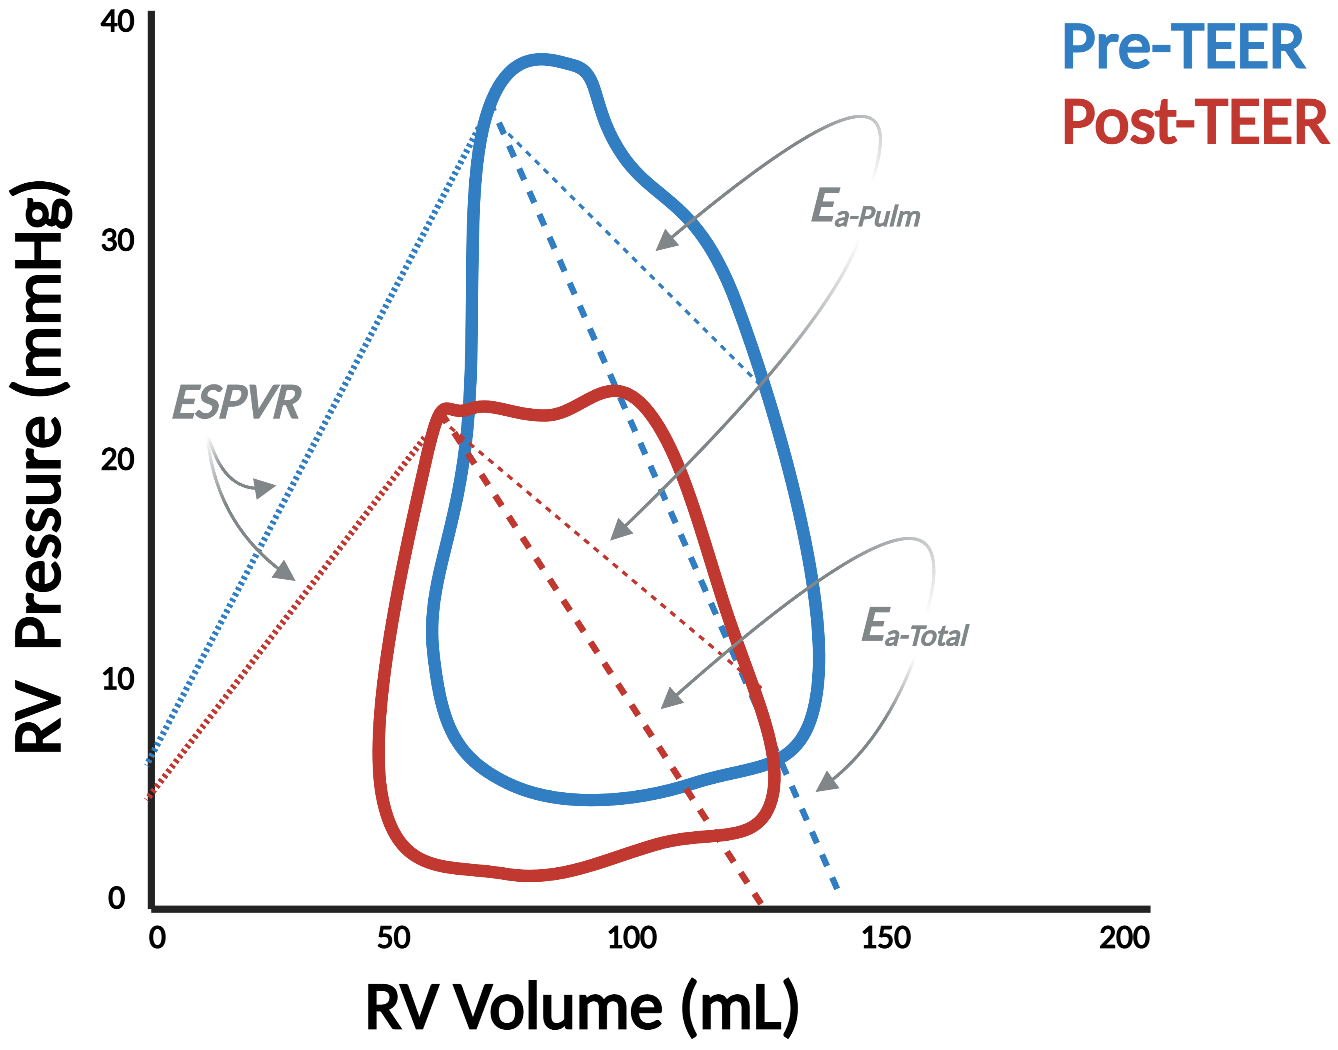
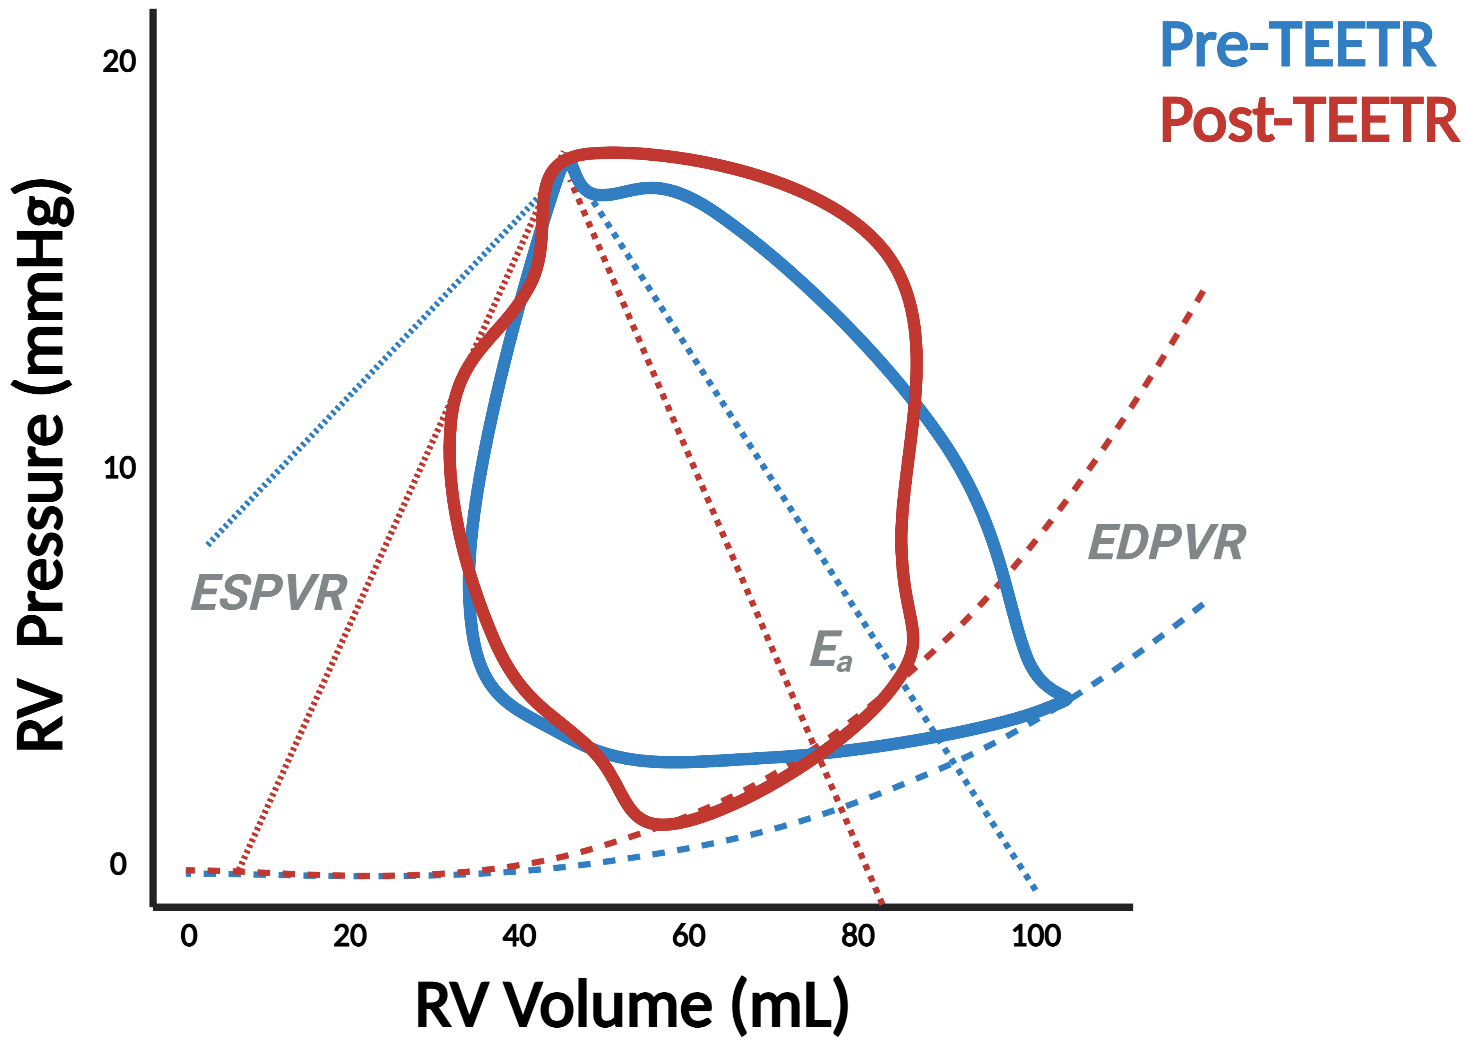
Pressure-volume (PV) analysis demonstrates significant changes in right ventricular physiology before and after transcatheter aortic valve replacement (TAVR) (Panel A) as well as transcatheter edge-to-edge repair (TEER) in the mitral (Panel B) and tricuspid (TEETR) (Panel C) positions. ESPVR = end-systolic PV relationship, EDPVR = end-diastolic PV relationship, Ees = end-systolic elastance, Ea = effective arterial elastance.
Atrioventricular valve disease presents an even more interesting opportunity for RV PV analysis given the strong interaction between mitral or tricuspid regurgitation and RV function. Prognosis for patients with primary mitral regurgitation (MR), for example, is worse with concomitant RV dysfunction,42 and patients fare worse after transcatheter edge-to-edge repair (TEER) if RV dysfunction persists post-procedure.43 Our group was the first to document changes to the RV PV loop in this setting.44 We showed that V-wave reduction and decreased left atrial pressure following TEER resulted in a significant decline in RV Ea, implicating the role of downstream pressure in RV afterload (Figure 7, Panel B). Further research is required to characterize the RV PV loop in different forms of MR (i.e., primary vs. secondary) and how it responds to different interventions such as TEER or transcatheter mitral valve replacement.
The tricuspid valve (TV) is arguably the most enigmatic of all heart valves. The surge of novel catheter-based TV repair techniques offers new perspectives for the treatment of severe tricuspid regurgitation (TR).45 Timing of such TR intervention and peri-procedural evaluation of TR reduction maneuvers are critical to determine procedural success and predict short- and long-term clinical outcomes. As such, PV analysis can guide TR reduction treatment by monitoring RV contractility, loading, and RV-PA coupling pre- and post-procedure; benefits which are all the more relevant considering the well-established limitations of echocardiographic assessments in the setting of severe TR.46 Figure 7, Panel C is a case-in-point illustration of how PV analysis clarifies the physiologic effects of transcatheter edge-to-edge tricuspid repair (TEETR). Ventricular unloading occurs with an acute reduction in end-diastolic volume as SV declines but is accompanied by an increase in afterload as blood is diverted from the low-pressure atrial environment into the higher resistance environment of the PA. This increase in afterload may explain the clinical deterioration observed in some patients, particularly those with advanced RV dysfunction, in response to TEETR or other TV interventions.
PV Analysis Without a Conductance Catheter
PV loop acquisition, as detailed in the sections above, is inherently invasive. Hence, there is substantial interest in reconstructing PV loops using data obtained non-invasively or with routinely collected data from standard-of-care procedures like RHC (Figure 8). This is particularly relevant in the context of well-described limitations correlating conductance catheter measurements with echocardiographic surrogates (i.e., r = 0.356 for TAPSE and RV Ees).47 To this end, over the last decade, CMR has been utilized to reconstruct elements of the PV loop and, in particular, estimate RV-PA coupling.48, 49 While the ECG can be used to synchronize separately measured CMR derived volumes and RV pressure waveforms to reconstruct PV loops, the most accurate method requires simultaneous RHC and cine MRI, which is challenging to perform outside of research settings.50
Figure 8. Non-invasive derivation of right ventricular pressure-volume loops.
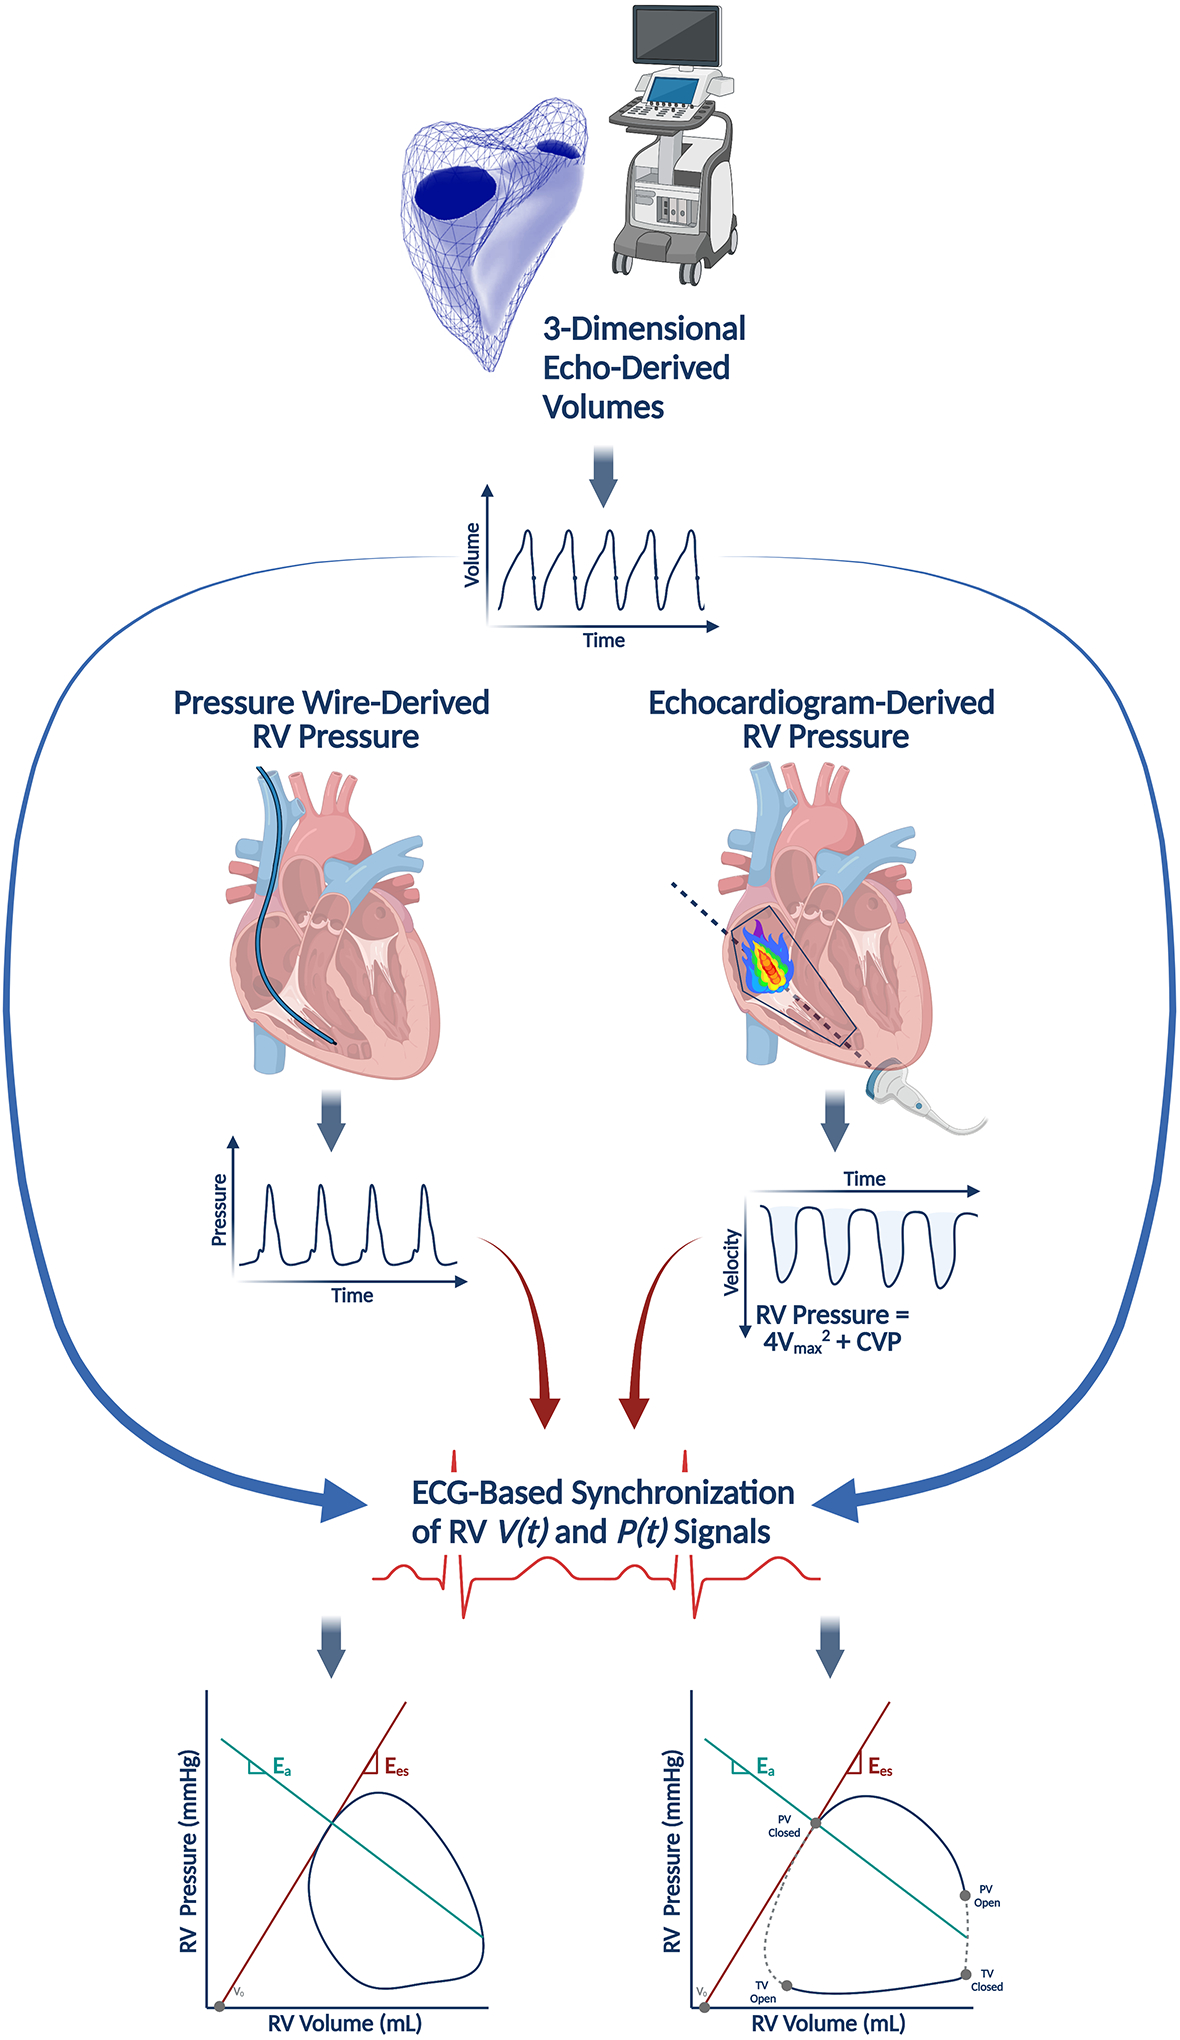
Pressure-volume (PV) loops can be reconstructed without a conductance catheter by synchronizing a volume-time signal (V(t)) from three-dimensional echocardiography with a pressure-time signal (P(t)). The pressure-time signal can be obtained with a pressure wire in the right ventricle (RV) or non-invasively estimated from echocardiograms by measuring the RV systolic pressure from a tricuspid regurgitant jet. Adapted with permission from Richter MJ, et al Eur Heart J Cardiovasc Imaging. 2021 Feb 28. Online ahead of print.51
More recently, Richter and colleagues recently validated a method recreating RV PV loops by synchronizing volume-time curves (V(t)) from 3D echocardiography and pressure-time curves (P(t)) generated by either directly measured RV pressure using a pressure wire in the ventricle or echocardiographic measurements of RV pressure aligned with specific events during the cardiac cycle (i.e., pulmonic valve opening).51 This latter, echocardiography-based technique has been corroborated in the LV and performed acceptably against invasive RV PV loops.52 Echocardiography-based estimates of Ees and Ees/Ea coupling were highly correlated with conductance catheter-based measurements (ρ = 0.8053 and 0.8261, respectively), but this method did not perform particularly well in capturing energetic measurements like stroke work (see Figure 1; the area within the PV loop). This technique relies on a reference pressure-time curve, constructed by averaging pressure tracings from multiple individuals and may only be valid for specific pathologies because the nature of RV pressure generation varies depending on the underlying disease and patient substrate. The method also relies on excellent acoustic windows in order to produce accurate volume-time curves, which may be particularly challenging in patients with a history of prior open-heart surgery (i.e., LVAD recipients).
Further work is needed to assess whether this framework can be replicated in larger cohorts (including patients without pulmonary hypertension), to build reference pressure-time and volume-time curve libraries, and to understand under what particular conditions the necessary assumptions for this technique to be applied are violated. Moreover, this method needs to outperform other non-invasive indices in order to justify routine use (i.e., TAPSE/PA systolic pressure, a non-invasive surrogate of RV-PA coupling that is associated with outcomes in patients with MR,53 TR,54 and HF with reduced55 or preserved56 EF despite modest correlation with RV Ees/Ea measured with a conductance catheter [r = 0.71]47). These limitations notwithstanding, the potential of non-invasive PV loop assessment is significant: by easing the barriers to data acquisition, non-invasive PV loops may become a fast, convenient way to monitor changes in ventricular function over time or in response to certain interventions.
Conclusion
PV analysis is a potent platform for describing RV physiology in health and disease. Considered the gold-standard method for quantifying intrinsic chamber systolic and diastolic properties, it has a powerful role in diagnosis and prognostication in various RV disease states, especially as providers become more comfortable using conductance catheters and interest in invasive hemodynamic assessment grows. Having highlighted all that can be gleaned from RV pressure-volume analysis based on invasive conductance catheter measurements, it is critical that investigators are aware of its limitations. The calibration technique is challenging, and analysis and interpretation of the loops still involves making certain assumptions or subjective decisions. Therefore, it is vitally important that PV loop acquisition and analysis be standardized, and investigators adopt uniform reporting practices as the technique is more widely adopted and incorporated into various research and clinical practices.
Supplementary Material
Acknowledgements
The authors thank Patrick Sullivan for his assistance.
Figures were created with BioRender.com.
Sources of Funding
MIB is supported by NHLBI T32HL007343 and the American College of Cardiology/Merck Research Fellowship.
Disclosures
MIB has no relevant disclosures. KT has received speaking fees from Actelion and Bayer. MBB receives personal fees from PulseCath BV. WKC reports consulting fees and research funding from Medtronic. RJT reports no direct conflicts of interest related to this manuscript, but notes the following general disclosures: consulting relationships with Medtronic, Abbott, Aria CV Inc., Acceleron, Itamar, Edwards LifeSciences, Eidos Therapeutics, Lexicon Pharmaceuticals, Gradient and United Therapeutics. SH is on a steering committee for Medtronic, Acceleron, and Abbott as well as a research advisory board for Abiomed, and also does hemodynamic core lab work for Actelion and Merck. MKK is on the Abiomed advisory board. NMVM reports research grant support from Abbott Vascular, Boston Scientific, Medtronic, Edwards Lifesciences, PulseCAth BV, Abiomed and Daiichi Sankyo. GH is a consultant for Abbott, B.Braun, Merit, and KA Medical. NKK reports institutional research grants and speaker/consulting honoraria from: Abbott, Abiomed, Boston Scientific, Getinge, Medtronic, LivaNova, MDStart, preCARDIA, and Zoll. RTH has served as a consultant for Abbott Vascular, Abbott Structural, NaviGate, Philips Healthcare, Medtronic, Edwards Lifesciences, and GE Healthcare; is the Chief Scientific Officer for the Echocardiography Core Laboratory at the Cardiovascular Research Foundation for multiple industry-supported trials, for which she receives no direct industry compensation; has received speaker fees from Boston Scientific and Baylis Medical; and has received nonfinancial support from 3mensio. RTH Dr. Kodali has served on the scientific advisory board for Microinterventional Devices, Dura Biotech, Thubrikar Aortic Valve, and Supira; has served as a consultant for Meril Lifesciences, Admedus, Medtronic, and Boston Scientific; has served on the steering committee for Edwards Lifesciences and Abbott Vascular; has received honoraria from Meril Lifesciences, Admedus, Abbott Vascular, and Dura Biotech; and owns equity in Dura Biotech, Thubrikar Aortic Valve, Supira, and MID. GTS reports consulting fees from Abbott. NU reports consulting fees from Medtronic and has received honorarium from Abbott. DB discloses consulting fees from PVLoops, Cardiodyme, and has received grant support from Abiomed. All other authors have nothing to disclose.
Footnotes
Supplemental Materials
References
- 1.Sanz J, Sánchez-Quintana D, Bossone E, Bogaard HJ and Naeije R. Anatomy, Function, and Dysfunction of the Right Ventricle: JACC State-of-the-Art Review. Journal of the American College of Cardiology. 2019;73:1463–1482. [DOI] [PubMed] [Google Scholar]
- 2.Brener MI, Burkhoff D and Sunagawa K. Effective Arterial Elastance in the Pulmonary Arterial Circulation: Derivation, Assumptions, and Clinical Applications. Circ Heart Fail. 2020;13:e006591. [DOI] [PubMed] [Google Scholar]
- 3.Vonk-Noordegraaf A and Westerhof N. Describing right ventricular function. European Respiratory Journal. 2013;41:1419–1423. [DOI] [PubMed] [Google Scholar]
- 4.Bastos MB, Burkhoff D, Maly J, Daemen J, den Uil CA, Ameloot K, Lenzen M, Mahfoud F, Zijlstra F, Schreuder JJ and Van Mieghem NM. Invasive left ventricle pressure-volume analysis: overview and practical clinical implications. Eur Heart J. 2020;41:1286–1297. [DOI] [PMC free article] [PubMed] [Google Scholar]
- 5.Sarraf M, Burkhoff D and Brener MI. First-in-Man 4-Chamber Pressure–Volume Analysis During Transcatheter Aortic Valve Replacement for Bicuspid Aortic Valve Disease. JACC: Case Reports. 2021;3:77–81. [DOI] [PMC free article] [PubMed] [Google Scholar]
- 6.Brener MI, Burkhoff D, Basir MB and Alqarqaz M. Pressure-Volume Analysis Illustrating the Mechanisms of Short-Term Hemodynamic Effects Produced by Premature Ventricular Contractions. Circ Heart Fail. 2021;14:e007766. [DOI] [PubMed] [Google Scholar]
- 7.Burkhoff D The conductance method of left ventricular volume estimation. Methodologic limitations put into perspective. Circulation. 1990;81:703–6. [DOI] [PubMed] [Google Scholar]
- 8.Baan J, van der Velde ET, de Bruin HG, Smeenk GJ, Koops J, van Dijk AD, Temmerman D, Senden J and Buis B. Continuous measurement of left ventricular volume in animals and humans by conductance catheter. Circulation. 1984;70:812–23. [DOI] [PubMed] [Google Scholar]
- 9.Maughan WL, Shoukas AA, Sagawa K and Weisfeldt ML. Instantaneous pressure-volume relationship of the canine right ventricle. Circ Res. 1979;44:309–15. [DOI] [PubMed] [Google Scholar]
- 10.Ten Brinke EA, Burkhoff D, Klautz RJ, Tschöpe C, Schalij MJ, Bax JJ, van der Wall EE, Dion RA and Steendijk P. Single-beat estimation of the left ventricular end-diastolic pressure-volume relationship in patients with heart failure. Heart. 2010;96:213–9. [DOI] [PubMed] [Google Scholar]
- 11.ten Brinke EA, Klautz RJ, Verwey HF, van der Wall EE, Dion RA and Steendijk P. Single-beat estimation of the left ventricular end-systolic pressure-volume relationship in patients with heart failure. Acta Physiol (Oxf). 2010;198:37–46. [DOI] [PubMed] [Google Scholar]
- 12.Sunagawa K, Yamada A, Senda Y, Kikuchi Y, Nakamura M, Shibahara T and Nose Y. Estimation of the hydromotive source pressure from ejecting beats of the left ventricle. IEEE Trans Biomed Eng. 1980;27:299–305. [DOI] [PubMed] [Google Scholar]
- 13.Brimioulle S, Wauthy P, Ewalenko P, Rondelet B, Vermeulen F, Kerbaul F and Naeije R. Single-beat estimation of right ventricular end-systolic pressure-volume relationship. Am J Physiol Heart Circ Physiol. 2003;284:H1625–30. [DOI] [PubMed] [Google Scholar]
- 14.Senzaki H, Chen CH and Kass DA. Single-beat estimation of end-systolic pressure-volume relation in humans. A new method with the potential for noninvasive application. Circulation. 1996;94:2497–506. [DOI] [PubMed] [Google Scholar]
- 15.Trip P, Kind T, van de Veerdonk MC, Marcus JT, de Man FS, Westerhof N and Vonk-Noordegraaf A. Accurate assessment of load-independent right ventricular systolic function in patients with pulmonary hypertension. The Journal of Heart and Lung Transplantation. 2013;32:50–55. [DOI] [PubMed] [Google Scholar]
- 16.Bellofiore A, Vanderpool R, Brewis MJ, Peacock AJ and Chesler NC. A novel single-beat approach to assess right ventricular systolic function. J Appl Physiol (1985). 2018;124:283–290. [DOI] [PMC free article] [PubMed] [Google Scholar]
- 17.Tello K, Richter MJ, Axmann J, Buhmann M, Seeger W, Naeije R, Ghofrani HA and Gall H. More on Single-Beat Estimation of Right Ventriculoarterial Coupling in Pulmonary Arterial Hypertension. Am J Respir Crit Care Med. 2018;198:816–818. [DOI] [PubMed] [Google Scholar]
- 18.Heerdt PM, Kheyfets V, Charania S, Elassal A and Singh I. A pressure-based single beat method for estimation of right ventricular ejection fraction: proof of concept. European Respiratory Journal. 2020;55:1901635. [DOI] [PMC free article] [PubMed] [Google Scholar]
- 19.Richter MJ, Peters D, Ghofrani HA, Naeije R, Roller F, Sommer N, Gall H, Grimminger F, Seeger W and Tello K. Evaluation and Prognostic Relevance of Right Ventricular-Arterial Coupling in Pulmonary Hypertension. Am J Respir Crit Care Med. 2020;201:116–119. [DOI] [PubMed] [Google Scholar]
- 20.Rain S, Handoko ML, Trip P, Gan CT, Westerhof N, Stienen GJ, Paulus WJ, Ottenheijm CA, Marcus JT, Dorfmüller P, Guignabert C, Humbert M, Macdonald P, Dos Remedios C, Postmus PE, Saripalli C, Hidalgo CG, Granzier HL, Vonk-Noordegraaf A, van der Velden J and de Man FS. Right ventricular diastolic impairment in patients with pulmonary arterial hypertension. Circulation. 2013;128:2016–25, 1–10. [DOI] [PubMed] [Google Scholar]
- 21.Cornwell WK, Coe G, Ambardekar A, Pal J, Tompkins C, Zipse M, Wolfel G, Brieke A, Levine B and Kohrt W. Abstract 13179: New Insights Into Right Ventricular Performance During Exercise Using High-Fidelity Conductance Catheters to Generate Pressure Volume Loops. Circulation. 2018;138:A13179–A13179. [Google Scholar]
- 22.Walker LA and PM B. The Right Ventricle: Biologic Insights and Response to Disease. Current Cardiology Reviews. 2013;9:73–83. [DOI] [PMC free article] [PubMed] [Google Scholar]
- 23.Tello K, Gall H, Richter M, Ghofrani A and Schermuly R. Right ventricular function in pulmonary (arterial) hypertension. Herz. 2019;44:509–516. [DOI] [PubMed] [Google Scholar]
- 24.Cornwell WK, Tran T, Cerbin L, Coe G, Muralidhar A, Hunter K, Altman N, Ambardekar AV, Tompkins C, Zipse M, Schulte M, O’Gean K, Ostertag M, Hoffman J, Pal JD, Lawley JS, Levine BD, Wolfel E, Kohrt WM and Buttrick P. New insights into resting and exertional right ventricular performance in the healthy heart through real-time pressure-volume analysis. J Physiol. 2020;598:2575–2587. [DOI] [PubMed] [Google Scholar]
- 25.Trip P, Rain S, Handoko ML, van der Bruggen C, Bogaard HJ, Marcus JT, Boonstra A, Westerhof N, Vonk-Noordegraaf A and de Man FS. Clinical relevance of right ventricular diastolic stiffness in pulmonary hypertension. European Respiratory Journal. 2015;45:1603–1612. [DOI] [PubMed] [Google Scholar]
- 26.Richter MJ, Hsu S, Yogeswaran A, Husain-Syed F, Vadász I, Ghofrani HA, Naeije R, Harth S, Grimminger F, Seeger W, Gall H, Tedford RJ and Tello K. Right ventricular pressure-volume loop shape and systolic pressure change in pulmonary hypertension. Am J Physiol Lung Cell Mol Physiol. 2021;320:L715–l725. [DOI] [PMC free article] [PubMed] [Google Scholar]
- 27.Hsu S Coupling Right Ventricular-Pulmonary Arterial Research to the Pulmonary Hypertension Patient Bedside. Circ Heart Fail. 2019;12:e005715. [DOI] [PubMed] [Google Scholar]
- 28.Hsu S, Simpson CE, Houston BA, Wand A, Sato T, Kolb TM, Mathai SC, Kass DA, Hassoun PM, Damico RL and Tedford RJ. Multi-Beat Right Ventricular-Arterial Coupling Predicts Clinical Worsening in Pulmonary Arterial Hypertension. J Am Heart Assoc. 2020;9:e016031. [DOI] [PMC free article] [PubMed] [Google Scholar]
- 29.Tedford RJ, Mudd JO, Girgis RE, Mathai SC, Zaiman AL, Housten-Harris T, Boyce D, Kelemen BW, Bacher AC, Shah AA, Hummers LK, Wigley FM, Russell SD, Saggar R, Saggar R, Maughan WL, Hassoun PM and Kass DA. Right ventricular dysfunction in systemic sclerosis-associated pulmonary arterial hypertension. Circ Heart Fail. 2013;6:953–63. [DOI] [PMC free article] [PubMed] [Google Scholar]
- 30.Hsu S, Kokkonen-Simon KM, Kirk JA, Kolb TM, Damico RL, Mathai SC, Mukherjee M, Shah AA, Wigley FM, Margulies KB, Hassoun PM, Halushka MK, Tedford RJ and Kass DA. Right Ventricular Myofilament Functional Differences in Humans With Systemic Sclerosis-Associated Versus Idiopathic Pulmonary Arterial Hypertension. Circulation. 2018;137:2360–2370. [DOI] [PMC free article] [PubMed] [Google Scholar]
- 31.van Riet EE, Hoes AW, Wagenaar KP, Limburg A, Landman MA and Rutten FH. Epidemiology of heart failure: the prevalence of heart failure and ventricular dysfunction in older adults over time. A systematic review. Eur J Heart Fail. 2016;18:242–52. [DOI] [PubMed] [Google Scholar]
- 32.Gorter TM, van Veldhuisen DJ, Bauersachs J, Borlaug BA, Celutkiene J, Coats AJS, Crespo-Leiro MG, Guazzi M, Harjola VP, Heymans S, Hill L, Lainscak M, Lam CSP, Lund LH, Lyon AR, Mebazaa A, Mueller C, Paulus WJ, Pieske B, Piepoli MF, Ruschitzka F, Rutten FH, Seferovic PM, Solomon SD, Shah SJ, Triposkiadis F, Wachter R, Tschope C and de Boer RA. Right heart dysfunction and failure in heart failure with preserved ejection fraction: mechanisms and management. Position statement on behalf of the Heart Failure Association of the European Society of Cardiology. Eur J Heart Fail. 2018;20:16–37. [DOI] [PubMed] [Google Scholar]
- 33.Melenovsky V, Hwang S-J, Lin G, Redfield MM and Borlaug BA. Right heart dysfunction in heart failure with preserved ejection fraction. European Heart Journal. 2014;35:3452–3462. [DOI] [PMC free article] [PubMed] [Google Scholar]
- 34.Rommel KP, von Roeder M, Oberueck C, Latuscynski K, Besler C, Blazek S, Stiermaier T, Fengler K, Adams V, Sandri M, Linke A, Schuler G, Thiele H and Lurz P. Load-Independent Systolic and Diastolic Right Ventricular Function in Heart Failure With Preserved Ejection Fraction as Assessed by Resting and Handgrip Exercise Pressure-Volume Loops. Circ Heart Fail. 2018;11:e004121. [DOI] [PubMed] [Google Scholar]
- 35.von Roeder M, Kowallick JT, Rommel KP, Blazek S, Besler C, Fengler K, Lotz J, Hasenfuß G, Lücke C, Gutberlet M, Thiele H, Schuster A and Lurz P. Right atrial-right ventricular coupling in heart failure with preserved ejection fraction. Clin Res Cardiol. 2020;109:54–66. [DOI] [PubMed] [Google Scholar]
- 36.Borlaug BA, Kane GC, Melenovsky V and Olson TP. Abnormal right ventricular-pulmonary artery coupling with exercise in heart failure with preserved ejection fraction. Eur Heart J. 2016;37:3293–3302. [DOI] [PMC free article] [PubMed] [Google Scholar]
- 37.Uriel N, Sayer G, Addetia K, Fedson S, Kim GH, Rodgers D, Kruse E, Collins K, Adatya S, Sarswat N, Jorde UP, Juricek C, Ota T, Jeevanandam V, Burkhoff D and Lang RM. Hemodynamic Ramp Tests in Patients With Left Ventricular Assist Devices. JACC Heart Fail. 2016;4:208–17. [DOI] [PubMed] [Google Scholar]
- 38.Tran T, Muralidhar A, Hunter K, Buchanan C, Coe G, Hieda M, Tompkins C, Zipse M, Spotts MJ, Laing SG, Fosmark K, Hoffman J, Ambardekar AV, Wolfel EE, Lawley J, Levine B, Kohrt WM, Pal J and Cornwell WK 3rd. Right ventricular function and cardiopulmonary performance among patients with heart failure supported by durable mechanical circulatory support devices. J Heart Lung Transplant. 2021;40:128–137. [DOI] [PubMed] [Google Scholar]
- 39.Brener MI, Hamid NB, Fried JA, Masoumi A, Raikhelkar J, Kanwar MK, Pahuja M, Mondellini GM, Braghieri L, Majure DT, Colombo PC, Yuzefpolskaya M, Sayer GT, Uriel N and Burkhoff D. Right Ventricular Pressure-Volume Analysis During Left Ventricular Assist Device Speed Optimization Studies: Insights Into Interventricular Interactions and Right Ventricular Failure. J Card Fail. 2021;27:991–1001. [DOI] [PubMed] [Google Scholar]
- 40.Genereux P, Pibarot P, Redfors B, Mack MJ, Makkar RR, Jaber WA, Svensson LG, Kapadia S, Tuzcu EM, Thourani VH, Babaliaros V, Herrmann HC, Szeto WY, Cohen DJ, Lindman BR, McAndrew T, Alu MC, Douglas PS, Hahn RT, Kodali SK, Smith CR, Miller DC, Webb JG and Leon MB. Staging classification of aortic stenosis based on the extent of cardiac damage. Eur Heart J. 2017;38:3351–3358. [DOI] [PMC free article] [PubMed] [Google Scholar]
- 41.Sarraf M, Burkhoff D and Brener MI. First-in-Man 4-Chamber Pressure–Volume Analysis During Transcatheter Aortic Valve Replacement for Bicuspid Aortic Valve Disease. J Am Coll Cardiol Case Reports. 2021;3:77–81. [DOI] [PMC free article] [PubMed] [Google Scholar]
- 42.Tourneau TL, Deswarte G, Lamblin N, Foucher-Hossein C, Fayad G, Richardson M, Polge A-S, Vannesson C, Topilsky Y, Juthier F, Trochu J-N, Enriquez-Sarano M and Bauters C. Right Ventricular Systolic Function in Organic Mitral Regurgitation. Circulation. 2013;127:1597–1608. [DOI] [PubMed] [Google Scholar]
- 43.Ledwoch J, Fellner C, Hoppmann P, Thalmann R, Kossmann H, Dommasch M, Dirschinger R, Stundl A, Laugwitz KL and Kupatt C. Impact of transcatheter mitral valve repair using MitraClip on right ventricular remodeling. Int J Cardiovasc Imaging. 2020;36:811–819. [DOI] [PubMed] [Google Scholar]
- 44.Brener MI, Burkhoff D and Sarraf M. Right Ventricular Pressure-Volume Analysis Before and After Transcatheter Leaflet Approximation for Severe Mitral Regurgitation. JAMA Cardiol. 2021;6:e207209. [DOI] [PubMed] [Google Scholar]
- 45.Taramasso M, Benfari G, van der Bijl P, Alessandrini H, Attinger-Toller A, Biasco L, Lurz P, Braun D, Brochet E, Connelly KA, de Bruijn S, Denti P, Deuschl F, Estevez-Loureiro R, Fam N, Frerker C, Gavazzoni M, Hausleiter J, Ho E, Juliard JM, Kaple R, Besler C, Kodali S, Kreidel F, Kuck KH, Latib A, Lauten A, Monivas V, Mehr M, Muntane-Carol G, Nazif T, Nickening G, Pedrazzini G, Philippon F, Pozzoli A, Praz F, Puri R, Rodes-Cabau J, Schafer U, Schofer J, Sievert H, Tang GHL, Thiele H, Topilsky Y, Rommel KP, Delgado V, Vahanian A, Von Bardeleben RS, Webb JG, Weber M, Windecker S, Winkel M, Zuber M, Leon MB, Hahn RT, Bax JJ, Enriquez-Sarano M and Maisano F. Transcatheter Versus Medical Treatment of Patients With Symptomatic Severe Tricuspid Regurgitation. J Am Coll Cardiol. 2019;74:2998–3008. [DOI] [PubMed] [Google Scholar]
- 46.Hahn RT and Zamorano JL. The need for a new tricuspid regurgitation grading scheme. Eur Heart J Cardiovasc Imaging. 2017;18:1342–1343. [DOI] [PubMed] [Google Scholar]
- 47.Schmeisser A, Rauwolf T, Groscheck T, Kropf S, Luani B, Tanev I, Hansen M, Meißler S, Steendijk P and Braun-Dullaeus RC. Pressure–volume loop validation of TAPSE/PASP for right ventricular arterial coupling in heart failure with pulmonary hypertension. European Heart Journal - Cardiovascular Imaging. 2020;22:168–176. [DOI] [PubMed] [Google Scholar]
- 48.Breeman KTN, Dufva M, Ploegstra MJ, Kheyfets V, Willems TP, Wigger J, Hunter KS, Ivy DD, Berger RMF and Truong U. Right ventricular-vascular coupling ratio in pediatric pulmonary arterial hypertension: A comparison between cardiac magnetic resonance and right heart catheterization measurements. Int J Cardiol. 2019;293:211–217. [DOI] [PMC free article] [PubMed] [Google Scholar]
- 49.Sanz J, García-Alvarez A, Fernández-Friera L, Nair A, Mirelis JG, Sawit ST, Pinney S and Fuster V. Right ventriculo-arterial coupling in pulmonary hypertension: a magnetic resonance study. Heart. 2012;98:238–43. [DOI] [PubMed] [Google Scholar]
- 50.Kuehne T, Yilmaz S, Steendijk P, Moore P, Groenink M, Saaed M, Weber O, Higgins CB, Ewert P, Fleck E, Nagel E, Schulze-Neick I and Lange P. Magnetic resonance imaging analysis of right ventricular pressure-volume loops: in vivo validation and clinical application in patients with pulmonary hypertension. Circulation. 2004;110:2010–6. [DOI] [PubMed] [Google Scholar]
- 51.Richter MJ, Yogeswaran A, Husain-Syed F, Vadász I, Rako Z, Mohajerani E, Ghofrani HA, Naeije R, Seeger W, Herberg U, Rieth A, Tedford RJ, Grimminger F, Gall H and Tello K. A novel non-invasive and echocardiography-derived method for quantification of right ventricular pressure–volume loops. European Heart Journal - Cardiovascular Imaging. 2021. jeab038, 10.1093/ehjci/jeab038. [DOI] [PubMed] [Google Scholar]
- 52.Russell K, Eriksen M, Aaberge L, Wilhelmsen N, Skulstad H, Remme EW, Haugaa KH, Opdahl A, Fjeld JG, Gjesdal O, Edvardsen T and Smiseth OA. A novel clinical method for quantification of regional left ventricular pressure-strain loop area: a non-invasive index of myocardial work. Eur Heart J. 2012;33:724–33. [DOI] [PMC free article] [PubMed] [Google Scholar]
- 53.Karam N, Stolz L, Orban M, Deseive S, Praz F, Kalbacher D, Westermann D, Braun D, Näbauer M, Neuss M, Butter C, Kassar M, Petrescu A, Pfister R, Iliadis C, Unterhuber M, Park SD, Thiele H, Baldus S, Stephan von Bardeleben R, Blankenberg S, Massberg S, Windecker S, Lurz P and Hausleiter J. Impact of Right Ventricular Dysfunction on Outcomes After Transcatheter Edge-to-Edge Repair for Secondary Mitral Regurgitation. JACC Cardiovasc Imaging. 2021;14:768–778. [DOI] [PubMed] [Google Scholar]
- 54.Fortuni F, Butcher SC, Dietz MF, van der Bijl P, Prihadi EA, De Ferrari GM, Ajmone Marsan N, Bax JJ and Delgado V. Right Ventricular-Pulmonary Arterial Coupling in Secondary Tricuspid Regurgitation. Am J Cardiol. 2021;148:138–145. [DOI] [PubMed] [Google Scholar]
- 55.Bosch L, Lam CSP, Gong L, Chan SP, Sim D, Yeo D, Jaufeerally F, Leong KTG, Ong HY, Ng TP, Richards AM, Arslan F and Ling LH. Right ventricular dysfunction in left-sided heart failure with preserved versus reduced ejection fraction. Eur J Heart Fail. 2017;19:1664–1671. [DOI] [PubMed] [Google Scholar]
- 56.Guazzi M, Dixon D, Labate V, Beussink-Nelson L, Bandera F, Cuttica MJ and Shah SJ. RV Contractile Function and its Coupling to Pulmonary Circulation in Heart Failure With Preserved Ejection Fraction: Stratification of Clinical Phenotypes and Outcomes. JACC Cardiovasc Imaging. 2017;10:1211–1221. [DOI] [PubMed] [Google Scholar]
Associated Data
This section collects any data citations, data availability statements, or supplementary materials included in this article.


