

Abstract
Objectives
Even though postoperative chemotherapy can eliminate residual tumor cells in patients with colorectal cancer (CRC), severe adversity, weakened immunity and drug resistance are still problems. Adjuvant cytokine‐induced killer (CIK) cell therapy is an alternative to CRC patients after surgery. The present study investigated the efficacy of adjuvant CIK cell therapy combined with chemotherapy in postoperative CRC patients.
Methods
This retrospective analysis included 137 postoperative CRC patients, including 71 who received adjuvant chemotherapy alone (control group) and 66 who received adjuvant immunotherapy based on CIK cells combined with chemotherapy (CIT group).
Results
Long‐term follow‐up study indicated that overall survival (OS) and progression‐free survival (PFS) were significantly longer in the CIT group than in the control group. Subgroup analyses showed that CIT treatment significantly improved OS and PFS of CRC patients classified as stage II and N0 stage and in patients with primary tumors in the rectum. Increasing the number of CIK infusions resulted in better prognosis. CRC patients aged < 65 years were found to benefit more from CIT‐based therapy than patients aged ≥ 65 years. A retrospective case–control study indicated that the primary tumor expression of signalling lymphocytes activating molecule family 7 (SLAMF7) was associated with increased efficacy of CIT treatment.
Conclusions
Adjuvant CIT therapy was an effective therapeutic strategy for postoperative CRC patients prolonging OS and PFS. Patient age, tumor stage and expression of SLAMF7 may be potential indicators of the efficacy of CIT therapy.
Keywords: adjuvant immunotherapy, colorectal cancer, cytokine‐induced killer cells, prognosis, signalling lymphocytes activating molecule family 7
This study found that adjuvant treatment with cytokine‐induced killer (CIK) cells combined with chemotherapy was effective in treating postoperative patients with colorectal cancer (CRC), and the patients aged < 65 years, without lymph node metastasis, and with primary rectal cancer could benefit from chemoimmunotherapy (CIT). The expression of SLAMF7 in CRC tumor tissues could be a potential molecular indicator of the efficacy of postoperative CIT.

INTRODUCTION
Colorectal cancer (CRC) is a common digestive tract carcinoma, ranking third in incidence and second in mortality among 36 cancers in worldwide. 1 Although the 5‐year survival rates of CRC patients with early stage have increased to 90% owing to advances in detection and treatment, the prognosis of patients with distant metastases remains poor. 2 Endoscopic/surgical resection, chemotherapy and radiotherapy are the main approaches to CRC treatment, but these methods have limited long‐term efficacy in patients with advanced stage primary tumors and tiny metastases that cannot be completely removed surgically. Adjuvant chemotherapy and radiotherapy can effectively eliminate tumor cells and residual lesions, thereby prolonging survival, but they can cause serious side effects, including gastrointestinal reactions, damage to the immune system and even bone marrow suppression. 3 , 4 , 5 Effective adjuvant therapy with fewer and less intense side effects is needed for patients with CRC.
Immunotherapy has shown promising clinical effects in patients with various types of tumors. Tumor immunotherapy includes monoclonal antibodies, tumor vaccines, immune checkpoint inhibitors, adoptive cell therapy and cytokine therapy. 6 , 7 Adoptive cell therapies entail the transfer of activated or educated immune cells, including lymphokine‐activated killer (LAK) cells, natural killer (NK) cells, tumor‐infiltrating lymphocytes (TIL), chimeric antigen receptor (CAR) T cells and cytokine‐induced killer (CIK) cells. 8 , 9 , 10 , 11 , 12 These treatments have been found to result in strong and durable antitumor responses with minimal adverse events. CIK cells, which are derived from peripheral blood mononuclear cells (PBMCs), are heterogeneous cell populations, consisting of mixtures of CD3+CD56+, CD3+CD56− and CD3−CD56+ T cells. 13 CD3+CD56+T cells have been reported to be the main effector cells in these mixtures that exert antitumor activity and have shown MHC‐unrestricted killing of tumor cells. 14 , 15 , 16 CIK cells secrete various cytokines, including interferon‐γ (IFN‐γ), tumor necrosis factor‐α (TNF‐α), granulocyte‐macrophage colony stimulating factor (GM‐CSF) and interleukin‐2 (IL‐2), which simulate the cytotoxic activity of macrophages, NK cells and CD8+ T cells, modulating the immune system to indirectly promote the tumor cytotoxicity. 17 CIK cells can recognise tumor cells through the binding of the receptor NKG2D on CIK cells to MIC‐A/B or ULBP1, 2, 3 on tumor cells. 18 , 19
CIK cell‐based therapies are extensively used in the postoperative adjuvant treatment of patients with various solid tumors, including ovarian cancer, non‐small cell lung cancer, liver cancer, breast cancer and gastric cancer. 20 , 21 , 22 , 23 , 24 A 10‐year study of 106 international clinical trials of CIK cells found that the combination of CIK cell therapy with chemotherapy could significantly prolong progression‐free survival (PFS) and overall survival (OS) in patients with cancers of the respiratory, digestive, nervous, urinary and gynaecological systems compared with chemotherapy alone. 25 The combination of adjuvant CIK cell treatment and chemotherapy was also found to reduce recurrence rate, prolong survival and decrease the expression of serum tumor markers, with fewer side effects, compared with chemotherapy alone, in postoperative CRC patients. 3 In addition, this combination was associated with few side effects, such as fever, fatigue and myalgia. 26 Although several clinical studies have assessed the efficacy of CIK cell treatments, less is known about the clinical indications for these treatments or factors, especially the molecular biomarkers, predictive of their long‐term efficacy.
The process of CIK cell induction involves the different expression of various receptors. Our previous sequencing results showed several activating receptors were found to be expressed on CIK cells, including killer Ig‐like receptors 2DL4 (KIR2DL4) and 2DS4 (KIR2DS4) and signalling lymphocytes activating molecule family member 7 (SLAMF7). SLAMF7 is a type I transmembrane glycoprotein receptor expressed by activated B cells, mature DC cells and NK cells that interact with its natural ligand. 27 , 28 This interaction results in the activation of SLAMF7, resulting in signal transduction through the EAT‐2/PLC‐γ pathway and enhancing the cytotoxic activity of NK cells. 29 The monoclonal antibody elotuzumab was shown to specifically target SLAMF7, which is highly expressed on multiple myeloma (MM) cells, recruiting NK cells and resulting in an antitumor effect through antibody‐dependent cell‐mediated cytotoxicity (ADCC). 30 , 31 Importantly, the expression of SLAMF7 was detected in specimens from CRC patients. 32 We hypothesised that the level of expression of SLAMF7 on tumors from CRC patients could influence the efficacy of CIK cell‐based therapy. The present study therefore retrospectively investigated the clinical efficacy of CIK cells combined with chemotherapy (CIT) in postoperative CRC patients as well as assessing the association between SLAMF7 expression in CRC tissues and the efficacy of postoperative CIT in CRC patients. Our study will present clinical evidence to support the efficacy of CIT against CRC and provide biomarkers for clinicians to identify CRC patients who will benefit from CIT.
RESULTS
Demographic and clinical characteristics of CRC patients
The present study included 137 patients who underwent radical surgery for CRC, including 71 who received postoperative chemotherapy alone (control group), and 66 who received postoperative CIK cell‐based therapy combined chemotherapy (CIT group). Their demographic and clinical characteristics are shown in Table 1. There were no significant differences between the CIT and control groups in patient gender, age, primary tumor location, TNM stage, carcinoembryonic antigen (CEA) concentration and degree of histological differentiation (Table 1).
Table 1.
Demographic and clinical characteristics of in postoperative CRC patients treated with CIK cell‐based therapy combined chemotherapy (CIT group) or chemotherapy alone (control group)
| Clinicopathological variables | Control group (n = 71) | CIT group (n = 66) | P | |
|---|---|---|---|---|
| Gender | Male | 46 | 37 | 0.296 |
| Female | 25 | 29 | ||
| Age | < 65 | 44 | 32 | 0.112 |
| ≥ 65 | 27 | 34 | ||
| Tumor Location | Rectum | 34 | 24 | 0.173 |
| Colon | 37 | 42 | ||
| Tumor | T1/T2 | 8 | 8 | 0.876 |
| T3/T4 | 63 | 58 | ||
| Lymph Node Metastasis | N0 | 35 | 39 | 0.250 |
| N1/N2 | 36 | 27 | ||
| TNM Stage | II | 35 | 39 | 0.250 |
| III/IV | 36 | 27 | ||
| CEA (ng mL−1) | 2.62 (1.30, 4.80) | 1.69 (0.73, 6.90) | 0.666 | |
| Histological differentiation | Poor | 5 | 3 | 0.398 |
| Moderate | 56 | 54 | ||
| Well | 3 | 6 | ||
| Missing data | 7 | 3 |
Phenotypic analysis and quality control of CIK cells
CIK cells were harvested for infusion on days 14, 15 and 16. Before each infusion, the cells were sampled for quality control and safety tests. Flow cytometry determination of the phenotypes of these immune cells result showed that the average percentages of CD3+CD56+ CIK cells and CD3+CD8+ cells were > 40% and > 70% respectively (Supplementary figure 1). Each injection consisted of 2.0–5.0 × 10⁹ cells, with > 90% of these cells being viable. The CIK cell preparations were free of bacteria, fungi and mycoplasma.
Adverse reactions
None of the patients in the CIT group experienced disease progression or relapse after chemotherapy and before administration of CIK cells, with only one patient in this group showing postoperative colonal leakage. During the process of chemotherapy before CIK treatment, 22 (33.33%) of the 66 patients in the CIT group experienced nausea, vomiting and other digestive symptoms; seven (10.61%) showed decreases in white blood cells counts, and five (7.58%) patients experienced pulmonary infections, but there were no severe adverse reactions. During the process of CIK cell treatment, eight (12.12%) of these patients developed fever; however, their body temperature was below 38.3°C, and all recovered naturally in 24 h with or without treatment of symptoms, which may be considered as self‐limited fever. In addition, two (3.57%) patients experienced fatigue, recovering naturally without medical treatment. None of the patients in the CIT group experienced severe adverse reactions, such as anaphylactic shock.
Survival analysis of CRC patients
Overall, the median OS during the follow‐up period was 70.16 months (range 1.02–147.12 months) and the median PFS was 53.98 months (range 1.02–147.02 months). The OS rates of the CIT and control groups were 46.97% (31/66) and 32.39% (23/71), respectively, and their median OS was 101.3 months (range 1.02–147.12 months) and 53.98 months (range 3.02–123.12 months) respectively. The 1‐, 3‐ and 5‐year OS rates were 93.94%, 78.79% and 66.67%, respectively, in the CIT group and 97.18%, 66.20% and 45.07%, respectively, in the control group. Median PFS was significantly longer in the CIT group (82.62 months, range 1.02–147.12 months) than in the control group (35.67 months, range 3.02–123.12 months). The 1‐, 3‐ and 5‐year PFS rates were 83.33%, 65.15% and 56.06%, respectively, in the CIT group, and 83.10%, 49.30% and 39.44%, respectively, in the control group. Kaplan–Meier analysis indicated that the OS (P = 0.0128) and PFS (P = 0.0212) was significantly longer in the CIT group than in the control group (Figure 1, Supplementary table 1).
Figure 1.

Kaplan–Meier analyses of overall survival and progression‐free survival in postoperative CRC patients treated with CIT or chemotherapy alone. Overall survival (OS) and progression‐free survival (PFS) curves were calculated for all CRC patients (n = 137) and for those treated postoperatively with CIT (n = 66) or chemotherapy alone (n = 71). *P < 0.05 by the stratified log‐rank test.
Demographic and clinical characteristics associated with clinical outcome
Cox proportional hazard regression model analysis was employed to assess the significance of risk factors based on multivariable and univariable adjustment. Univariate analyses demonstrated that early T stage, overall TNM stage, a higher degree of histological differentiation, the absence of lymph node metastases and CIT treatment were associated with longer OS and PFS (Table 2). Moreover, multivariable analyses indicated that CIT treatment was independently prognostic for longer OS and that a higher degree of histological differentiation and overall TNM stage were independently prognostic for both improved OS and PFS (Table 2).
Table 2.
Univariate and multivariate analysis of overall survival and progress‐free survival in patients with CRC
| Variables | Overall survival | Progress‐free survival | ||||||
|---|---|---|---|---|---|---|---|---|
| Univariate analysis | Multivariate analysis | Univariate analysis | Multivariate analysis | |||||
| HR (95% CI) | P a | HR (95% CI) | P a | HR (95% CI) | P a | HR (95% CI) | P a | |
|
Age(< 65 vs. ≥ 65) |
1.529 (0.992–2.355) | 0.054 | NA | NA | 1.485 (0.970–2.275) | 0.069 | NA | NA |
|
Gender(Male vs. Female) |
0.870 (0.556–1.362) | 0.543 | NA | NA | 0.833 (0.536–1.297) | 0.419 | NA | NA |
|
Primary Tumor Location(Rectum vs. Colon) |
0.926 (0.600–1.427) | 0.726 | NA | NA | 0.858 (0.560–1.316) | 0.484 | NA | NA |
|
Histological Differentiation(Poor vs. Moderate vs. High) |
0.402 (0.209–0.776) | 0.007** | 0.431 (0.212–0.879) | 0.021* | 0.391 (0.205–0.746) | 0.004** | 0.415 (0.207–0.833) | 0.013* |
|
T Stage(T1/T2 vs. T3/T4) |
2.587 (1.126–5.949) | 0.025* | 2.519 (0.901–7.046) | 0.078 | 2.474 (1.077–5.683) | 0.033* | 2.434 (0.871–6.798) | 0.090 |
|
N Stage(N0 vs. N1/N2) |
2.572 (1.655–3.996) | 0.00002*** | NA | NA | 2.433 (1.575–3.758) | 0.00006*** | NA | NA |
|
TNM Stage(I/II vs. III/IV) |
2.572 (1.655–3.996) | 0.00002*** | 2.224 (1.384–3.572) | 0.001** | 2.433 (1.575–3.758) | 0.00006*** | 2.045 (1.282–3.262) | 0.003** |
|
Treatment(CIT vs. Control) |
1.754 (1.121–2.744) | 0.014* | 1.634 (1.017–2.626) | 0.042* | 1.674 (1.075–2.606) | 0.023* | 1.594 (0.997–2.549) | 0.051 |
*P < 0.05; **P < 0.01; ***P < 0.001.
CI, confidence interval; HR, hazard ratio; NA, not analysed.
Cox regression.
Subgroup analysis
To further identify the clinical parameters affecting efficacy of CIT treatment, subgroup analysis was performed based on overall TNM stage, T stage, lymph node metastasis, age, numbers of CIK cell infusions, grade of differentiation and primary tumor location (Figures 2 and 3). CIT treatment was found to significantly improve OS and PFS compared with chemotherapy alone in patients with stage II CRC but did not affect OS or PFS of CRC in patients with later stage (stage III/IV). CIT treatment also resulted in better OS and PFS than chemotherapy alone in patients with advanced T stage (T3 and T4) but not in those with early T stage CRC. Moreover, CIT treatment significantly increased OS and PFS in CRC patients without lymph node metastasis (N0 group), but had no effect in patients with lymph node metastases (N1/N2). To evaluate the effects of number of CIK cell infusions, patients in the CIT group were divided based on the mean number of CIK cell infusions (3.17 ± 1.63), with OS and PFS being significantly longer in patients receiving ≥ 3 than < 3 infusions. CIT treatment prolonged the OS and PFS in CRC patients aged < 65 years, but not in patients aged ≥ 65 years. CIT treatment also significantly improved OS and PFS in patients having CRC tumors with a moderate grade of differentiation group. In addition, CIT treatment significantly prolonged OS and PFS in patients with rectal cancer, but not in those with colon cancer.
Figure 2.

Kaplan–Meier analyses of the effects of TNM stage on overall survival and progression‐free survival in CRC patients treated postoperatively with CIT or chemotherapy alone. (a) OS and PFS of stage II CRC patients treated with CIT (n = 39) or chemotherapy alone (n = 35); (b) OS and PFS of stage III/IV CRC patients treated with CIT (n = 27) or chemotherapy alone (n = 36). (c) OS and PFS of T1/T2 CRC patients treated with CIT (n = 8) or chemotherapy alone (n = 8); (d) OS and PFS of T3/T4 CRC patients treated with CIT (n = 58) or chemotherapy alone (n = 63). (e) OS and PFS of N0 CRC patients treated with CIT (n = 39) or chemotherapy alone (n = 35); (f) OS and PFS of N1/N2 CRC patients treated with CIT (n = 27) or chemotherapy alone (n = 36). (g) OS and PFS of N0 (n = 39) and N1/N2 (n = 27) CRC patients treated with CIT. *P < 0.05, **P < 0.01, ***P < 0.001 by stratified log‐rank tests.
Figure 3.

Kaplan–Meier analyses of the effects of multiple factors on overall survival and progression‐free survival in CRC patients treated postoperatively with CIT or chemotherapy alone. (a) OS and PFS of CRC patients in the CIT group receiving ≥ 3 (n = 42) or < 3 (n = 24) CIK cell infusions. (b) OS and PFS of CRC patients aged ≥ 65 years treated with CIT (n = 34) or chemotherapy alone (n = 27); (c) OS and PFS of CRC patients aged < 65 years treated with CIT (n = 32) or chemotherapy alone (n = 44). (d) OS and PFS of CRC patients with well differentiated tumors treated with CIT (n = 6) or chemotherapy alone (n = 3); (e) OS and PFS of CRC patients with moderately differentiated tumors treated with CIT (n = 54) or chemotherapy alone (n = 56); (f) OS and PFS of CRC patients with poorly differentiated tumors treated with CIT (n = 3) or chemotherapy alone (n = 5). (g) OS and PFS of CRC with primary rectal cancer treated with CIT (n = 34) or chemotherapy alone (n = 24); (h) OS and PFS of CRC patients with primary colon cancer treated with CIT (n = 37) or chemotherapy alone (n = 41). *P < 0.05, **P < 0.01, ***P < 0.001 by stratified log‐rank tests.
Upregulated SLAMF7 may mediate the tumor cytotoxicity of CIK cells
To identify receptors and immune checkpoints expressed on CIK cells, deep sequencing was performed on CIK cells sampled on sequential days of entire generation process, including on day 0, day 7 and day 14. The expression of genes encoding receptors and immune checkpoints reported to be expressed on NK cells and T cells was extracted from sequencing data for CIK cells, with the expression patterns displayed using a heatmap (Figure 4a). Of the activating receptors, SLAMF7 was found to be increasingly upregulated in response to cytokines stimulation, with the expression patterns of SLAMF7 validated by qRT‐PCR, flow cytometry and Western blotting (Figure 4b–d). The expression profile of SLAMF7 was consistent with the deep sequencing data. Because of the self‐ligand nature of SLAMF7, the presence of SLAMF7 on CRC cells is likely the key to activating the tumor cytotoxicity of CIK cells. Western blots showed the self‐ligand of SLAMF7 was the expression on the human CRC cell lines HCT‐116 and HT‐29 (Figure 4e), with CIK cells exhibiting potent and dose‐dependent cytotoxicity against HCT‐116 and HT‐29 cells (Figure 5a). To determine whether SLAMF7 participates in tumor recognition, CIK cells with high and low expression of SLAMF7 were sorted by fluorescent‐activated cell sorting (FACS) (Figure 5b) and the antitumor activities of these two CIK cells populations were assessed against HCT‐116 and HT‐29 cells. The cytotoxicity of two CIK cell populations, when tested at an effect‐to‐target ratio of 16:1, was found to differ, with the results indicating that the antitumor activity of CIK cells with high expression of SLAMF7 was significantly higher than CIK cells with low expression of SLAMF7 (Figure 5c).
Figure 4.
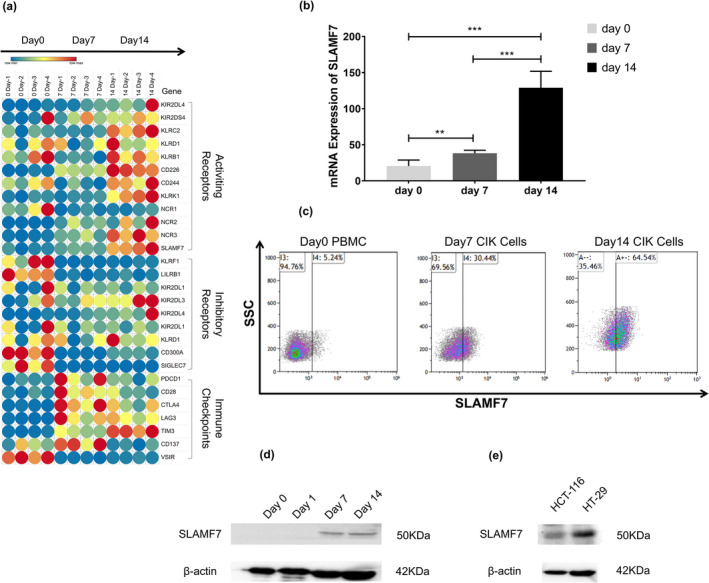
Expression of SLAMF7 in CIK and colorectal cancer cells. (a) Heatmap showing the expression profiles of receptors and immune checkpoints, including SLAMF7, during the induction of CIK cells. (b) Levels of SLAMF7 mRNA expression in CIK cells at different time points following induction. **P < 0.01, ***P < 0.001. (c) Flow cytometry showing the expression of SLAMF7 on the surface of CIK cells. (d, e) Western blots showing the expression of SLAMF7 in (d) CIK and (e) colorectal cancer cells.
Figure 5.
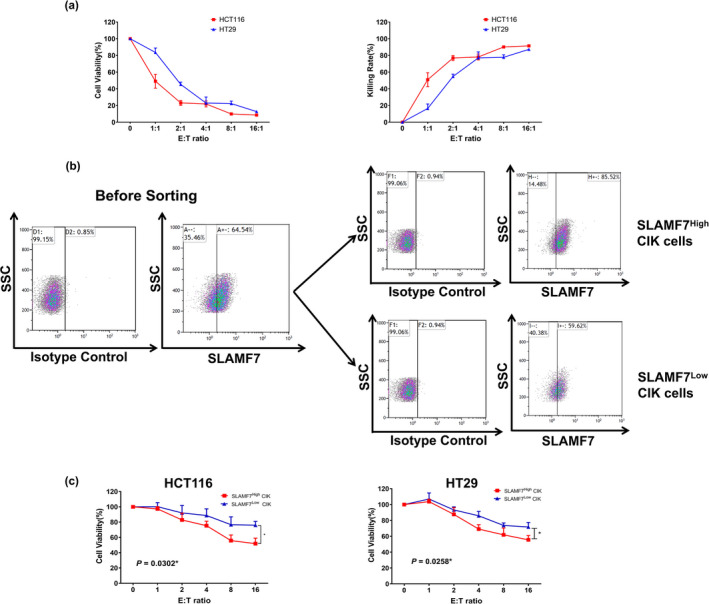
Tumor cytotoxicity of CIK cells before and after FACsorting based on SLAMF7 expression. (a) Cytotoxicity of CIK cells against the human colorectal cancer cells lines HCT‐116 and HT‐29 in vitro. (b) Expression of SLAMF7 before and after cell sorting by flow cytometry. (c) Cytotoxic activity of CIK cells sorted by high and low SLAMF7 expression. *P < 0.05.
Associations between SLAMF7 expression and prognosis of CRC patients receiving CIT treatment
To explore the relationship between SLAMF7 and the efficacy of CIT, the expression of SLAMF7 in primary tumor specimens was analysed by immunohistochemistry, and the correlation between SLAMF7 expression and patient prognosis tested. Specimens from 56 CRC patients had been archived for evaluation, with both paracancer and tumor tissue analysed in specimens from 39 patients, and tumor tissue alone analysed in specimens from 17 patients. The expression of SLAMF7 in each sample was scored based on the intensity and area of the staining (e.g. Figure 6). Statistical analyses indicated that SLAMF7 expression did not differ significantly in paracancer and tumor tissue samples and that SLAMF7 expression did not correlate with TNM stage (Figure 7).
Figure 6.

Immunohistochemical staining for SLAMF7 of CRC surgical specimens.
Figure 7.

Expression of SLAMF7 in CRC surgical specimens. (a) Comparative expression of SLAMF7 by tumor and paracancer tissues in CRC patients, as determined by staining intensity and area scoring. (b) Expression of SLAMF7 by tumor and paracancer tissues in CRC patients of different TNM stages. (c) Expression of SLAMF7 by tumor tissues from patients with stage II and stage III/IV CRC.
To investigate the correlation between SLAMF7 expression and immune cell infiltration, the densities of CD8+ T cells and NK cells in tumor tissue were compared in CIT‐treated CRC patients with high and low SLAMF7 expression (e.g. Figure 8). Overall, 112 slides were enrolled, 56 slides were evaluated for CD8+ T‐cell infiltration, and 56 slides were collected for NK cell infiltration analysing. Statistical analyses showed that the expression of SLAMF7 did not correlate with either CD8+ T cell or NK cell infiltration (Figure 9a).
Figure 8.

Immunofluorescence staining for infiltrated immune cell of CRC surgical specimens. Immunofluorescence staining for CD3, CD8 and CD56 of CRC surgical specimens in the CIT group.
Figure 9.

Correlation between SLAMF7 expression score and immune cell infiltration in tumor tissues and survival analyses in CRC patients undergoing radical surgery. (a) Correlations of high and low SLAMF7 expression with infiltration of CD8+ T cells and NK cells into tumors in the CIT group compared by the Student’s t‐test. ns: not significant. (b) Kaplan–Meier analyses of the effects of SLAMF7 expression in tumor tissues on OS and PFS of CRC patients in the SLAMF7High (n = 34) and SLAMF7Low (n = 22) groups with rates compared by the stratified log‐rank tests.
The 56 CRC patients were divided into two groups based on their SLAMF7 expression scores. The OS rate was higher in patients with higher than low SLAMF7 expression (58.82% vs. 36.36%; Supplementary table 2). Survival analysis indicated that high expression of SLAMF7 in primary CRC specimens was a prediction of better prognosis in patients receiving CIT treatment (Figure 9b).
DISCUSSION
Although surgery is still the first‐line treatment for patients with CRC, various adjuvant and neoadjuvant treatments, including chemotherapy, radiotherapy, targeted therapy, immunotherapy and their combinations, can significantly eliminate residual disease and improve patient prognosis. 33 Chemotherapy, however, has both advantages and disadvantages, as it not only inhibits the tumor cell growth, but also weakens the immune system, by reducing white blood cell counts. Nevertheless, systemic chemotherapy has been reported to enhance the immunogenicity of tumor cells and eradicate immunosuppressive cells in the tumor microenvironment including MDSC, M2 macrophages and Tregs. 5 , 34 , 35 CIK cells have shown potent antitumor activity against many tumor types, reducing tumor recurrence and metastasis, while being associated with fewer and less severe adverse effects. The cytotoxic function of CIK cells may be significantly impaired by the expression of immune checkpoints, including PD‐L1, LAG‐3 and TIM‐3. 36 , 37 The present study hypothesised that the combination of CIK cells and chemotherapeutic agents would be more effective in treating CRC than chemotherapy alone. Results consistently showed that CIT treatment improved OS and PFS compared with chemotherapy alone. Univariate and multivariate analyses further indicated that CIK cell combined with chemotherapy was an independent prognostic factor for OS and PFS. These findings, showing that postoperative CIT treatment could significantly prolong OS and PFS and reduce the rate of metastasis and recurrence in CRC patients, were consistent with results in patients with ovarian cancer, non‐small lung cancer, triple‐negative breast cancer, gastric cancer and liver cancer, as well as in patients with CRC metastases. 20 , 21 , 22 , 23 , 24 , 25 , 26
Subgroup analyses showed that, compared with chemotherapy alone, CIT improved the OS and PFS in CRC patients with stage II, but not stage III/IV. Moreover, CIT treatment was more effective than chemotherapy alone in CRC patients at advanced T (T3/T4) and earlier N (N0) stage. The limited efficacy of CIT therapy in patients with advanced stages may be because of the further progression of malignancy in these tumors, as this treatment has been shown ineffective with highly malignant CRC. 38 Interestingly, the present study found that prognosis was better in patients receiving three or more infusions of adjuvant CIK cells than in those receiving fewer than three infusions. This finding was in agreement with the results of adjuvant CIK cell treatment in gastric cancer patients. 39 CIK cells are a key determinant of the efficacy of CIT treatment, with more courses of infusion resulting in a better prognosis.
Age is a major risk factor during tumorigenesis, 2 with susceptibility to tumors increasing with age because of the accumulation of somatic mutations. The present study found that, compared with chemotherapy alone, CIT significantly improved OS and PFS in patients aged < 65 years, but not in older patients aged ≥ 65 years. The reduced activity of immune cells from elderly patients may have reduced the cytotoxicity of CIK cells. 40 CIT therapy was also associated with better OS and PFS than chemotherapy alone in patients with rectal but not colon cancer. Patients with rectal cancer were reported to have a better long‐term prognosis than patients with colon cancer. 41 The different outcomes of CIT treatment in rectal and colon cancer may be because of the properties of the tumors. 42
This study also found that CIT therapy was more effective than chemotherapy alone in CRC patients with T3/T4 stage, but not T1/T2 stage. This result was surprising, as it conflicts with common knowledge in clinical practice, but may be ascribed to relatively few samples of T1/T2 stage CRC included in this study. OS and PFS were also longer in patients with moderate tumor differentiation receiving CIT than chemotherapy alone, whereas there were no significant differences in patients with poorly or well differentiated. However, the numbers of patients in this study with poorly and well differentiated tumors were small, indicating a need for comparisons in larger numbers of samples.
SLAMF7, which acts as an activating receptor against cancer, is highly expressed on NK cells. 43 SLAMF7 on NK cells is thought to be involved in the identification and killing ability of multiple myeloma cells. 44 , 45 To date, few studies have assessed the expression of SLAMF7 on CIK cells. The present study found that the expression of SLAMF7 gradually increased during the induction of CIK cells, suggesting that SLAMF7 expression may correlate with the gain of antitumor function of CIK cells. Interestingly, although the self‐ligand of SLAMF7 was reported to be rarely expressed on solid tumor cells, 27 , 30 , 32 the present study found that SLAMF7 was strongly expressed on the human CRC lines HCT‐116 and HT‐29, as well as on tumor specimens from patients with CRC. Subsequent tumor cytotoxic assay showed that SLAMF7High CIK cells exhibited stronger tumor‐killing ability than SLAMF7Low CIK cells, suggesting that SLAMF7 may be involved in triggering the tumor‐killing effect of CIK cells against CRC cells. Although SLAMF7 was expressed on both tumor and paracancer tissues, its expression did not differ significantly, nor did SLAMF7 expression correlate with tumor TNM stage. SLAMF7 expression, however, was reported to be significantly lower in stage IV than in early‐stage CRC, which could correlate with lymphatic, vascular, peripheral nerve and/or resection margin invasion, leading to CRC progression and metastasis. 32
High‐density infiltration into tumors of immune cells, including CD8+ T cells, NK cells, macrophages and regulatory T cells, may be associated with better prognosis in patients with various cancers, including CRC. 46 Meanwhile, many immune cells are positive for SLAMF7 expression. 27 To determine whether tumor‐infiltrating immune cells that express high level of SLAMF7 are associated with better patient prognosis, immunofluorescence assays were performed to assess the relationships between tumor‐infiltrating CD8+ T cells and NK cells and the expression of SLAMF7 in cancer tissues of CRC patients treated with CIT. Our finding, that SLAMF7 expression did not correlate with the infiltration of either CD8+ T cells or NK cells, suggested that these immune cells did not express higher levels of SLAMF7. Further investigation of the associations between SLAMF7 expression in CRC specimens and the prognosis of patients receiving CIT treatment showed that the OS (P = 0.0512) and PFS (P = 0.0552) were tended to be longer in the SLAMF7High than in the SLAMF7Low. These findings suggested that SLAMF7 may be a potential indicator of the efficacy of CIT treatment in patients with CRC.
In conclusion, the present study showed that, compared with adjuvant chemotherapy alone, the combination of postoperative CIK cell treatment and chemotherapy could significantly prolong OS and PFS in postoperative patients with CRC. Subgroup analyses showed that CIT treatment could particularly benefit CRC patients aged < 65 years old, patients without lymph node metastasis and patients with rectal cancer. Furthermore, an increased number of CIK cell infusions during CIT treatment were positively associated with improved prognosis. In addition, the expression of SLAMF7 in malignant tissues from CRC patients could be a potential molecular indicator of the efficacy of postoperative CIT treatment.
METHODS
Patients – inclusion and demographics
This study and the protocol of CIK cell‐based immunotherapy were reviewed and approved by the Bioethics Committee of Yan'an Affiliated Hospital of Kunming Medical University. The investigation was performed in accordance with the Helsinki declaration and national and international guidelines. Written informed consent was provided by all patients or their legal guardians.
The medical records of CRC patients who underwent radical tumor resection from February 2008 to July 2014 were reviewed. Patients were included if they were aged between 18 and 80 years; if the resected tumors had been pathologically confirmed as primary colorectal adenocarcinomas; and if the patients did not receive preoperative chemotherapy or radiotherapy. Patients diagnosed with concurrent cancer except for CRC; CRC patients with severe cardiovascular, liver, kidney or autoimmune disease, or with syphilis or HIV infection; and women who were pregnant or lactating were excluded. The study included 137 patients, including 71 who received chemotherapy alone and 66 who received CIK cell treatment combined with chemotherapy. Patient treatment was determined by a multidisciplinary team, which included oncologists, surgeons, immunologists and pathologists. The demographic and clinicopathological characteristics of the included patients are shown in Table 1.
Preparation of CIK cell
Whole blood obtained from individual patients was treated with red blood cell lysis buffer, and the resulting PBMCs were suspended at a density of 1 × 10⁶ mL−1 in CIK cell culture medium. CIK cells were generated using a standard protocol, which included priming with 1000 U mL−1 IFN‐γ (Miltenyi Biotec, Bergisch Gladbach, Germany) on Day 0 and stimulation with 100 ng mL−1 OKT‐3 (Miltenyi Biotec) and 500 U mL−1 IL‐2 (Miltenyi Biotec) each on the following 14–15 days. The cells were subcultured every 4 or 5 days, and the resulting CIK cells were harvested at days 14, 15 and 16 depending on the quantities. Samples of each cell preparation were withdrawn for quality control and safety assays. Each batch of cells was subjected to analyses of viability, the expression of a series of phenotypic markers and contamination with bacteria, fungi and mycoplasma.
Treatment scheme
The 137 patients who underwent radical resection were treated with 2‐6 cycles of FOLFOX chemotherapy, consisting of intravenous (i.v.) oxaliplatin 85 mg m−2, i.v. leucovorin 400 mg m−2 and i.v. 5‐fluorouracil (5‐FU) 400 mg m−2 for 2 h each on Day 1, followed by continuous i.v. 5‐FU 1200mg m−2 per day for 2 days, for a total of 2400 mg m−2 dripping for 46–48 h, with cycles repeated at intervals of 3–4 weeks. Patients in the CIT group were started on adjuvant CIK cell infusion beginning during the fourth week after the last chemotherapy cycle. CIK cells were intravenously infused at a dosage of 2–5 × 10⁹ cells per day, with each cycle consisting of three sequential injections. Patients in the CIT group were treated with 1–8 cycles of immunotherapy at intervals of 4 weeks.
Tumor cell lines and culture
The human CRC cell lines HCT‐116 and HT‐29 were purchased from the National Collection of Authenticated Cell Cultures (Shanghai, China) and cultured in DMEM/F12 medium (Thermo Fisher Scientific/Invitrogen, South San Francisco, CA, USA), supplemented with 10% foetal bovine serum (FBS) (Beit Haemek Ltd, Beit Haemek, Israel) and 1% penicillin‐streptomycin solution (Beit Haemek Ltd).
Western blotting
Total proteins were extracted from CIK, HCT‐116 and HT‐29 cells with radio‐immunoprecipitation assay (RIPA) lysis buffer (Beyotime Biotechnology, Shanghai, China), supplemented with PMSF and cOmplete EDTA‐free protease inhibitor cocktail tablets (Roche, Basel, Switzerland). Total protein concentrations were measured with bicinchoninic acid (BCA) protein assay kits (Meilunbio, Dalian, China). Protein samples were separated on 10% SDS‐PAGE gels and electrotransferred to PVDF membranes (Immobilon, Merck, Darmstadt, Germany). The membranes were blocked by incubation with 5% skimmed milk powder in TBST for 1 h at room temperature and incubated overnight at 4°C with primary antibodies against SLAMF7 (CRACC/SLAMF7/CD319 (E5C4M) Rabbit mAb, Cell Signaling Technology (CST), Denver, MA, USA) and β‐actin (Beta Actin Monoclonal Antibody, Proteintech, Rosemont, IL, USA). After washing three times with TBS, the membranes were incubated with HRP‐conjugated secondary antibodies for 1 h at room temperature and washed four times with TBST, and the bands were visualised using a chemiluminescence kit (Affinity Biosciences, Cincinnati, OH, USA).
Flow cytometry analysis and sorting
CIK cells were harvested on days 0, 7 and 14, and suspended at a density of 1 × 10⁵ mL−1. Aliquots of 100 μL containing 1 × 10⁴ cells in suspension were transferred to a flow tube and incubated with PE‐conjugated anti‐mouse CD319/SLAMF7 antibody (Biolegend, San Diego, CA, USA) and its isotype control (PE‐conjugated Rat IgG1, λ Isotype Ctrl Antibody (Biolegend)) in the dark for 30 min. A 1 mL aliquot of PBS was added to each tube, and the tubes were centrifuged for 5 min at 300 g and the cells washed twice. Finally, each CIK pellet was resuspended in 200 μL PBS and subjected to flow cytometry (FACSCalibur, Becton Dickinson, Franklin Lakes, NJ, USA and Cytomics FC500, Beckman Coulter, Indianapolis, IN, USA) analyses. CIK cells expressing different amounts of SLAMF7 were sorted using an Influx cell sorter (Becton Dickinson). The antibodies used for phenotyping of CIK cells, including antibodies to CD3, CD4, CD8, CD56 and NKG2D and their isotype controls, were purchased from Becton Dickinson and BioLegend.
Tumor cytotoxicity assay
HCT‐116 and HT‐29 cells were plated in 96‐well cell culture plate 24 h before the assay, with the number of cells in each well determined by cell counting. The sorted CIK cells expressing high or low levels of SLAMF7 were added to each well at different ratios. After incubation for 24 h, the cells in each well were washed three times with PBS, followed by the addition of fresh growth medium supplemented with 10 µL of CCK‐8 solution (Proteintech). After incubation for 2–4 h, cell viabilities were determined by measuring the absorbance of each well at 450 nm using a spectrophotometer.
Immunohistochemical analysis and evaluation
Of the 66 patients in CIT group, 10 were excluded from this analysis because no tumor sample could be retrieved. Of the remaining 56 CRC patients, 39 had available paracancer and cancer tissues, with the order 17 having only cancer tissue available. The tissue samples were blocked with paraffin, sectioned and dewaxed, followed by antigen retrieval. The sections were treated with 3% hydrogen peroxide and blocked by incubation with goat serum for 10 min, followed by overnight incubation at 4°C with rabbit monoclonal anti‐SLAMF7 primary antibody (Cell Signaling Technology). The sections were washed three times with PBS and incubated with HRP conjugated secondary antibody for 45 min at 37°C. The sections were again washed three times with PBS, and the colour was developed by adding the chromagen 3′3′diaminobenzidine tetrahydrochloride (DAB), followed by counterstaining with haematoxylin. Each slide was sequentially evaluated by two experienced pathologists blinded to sample identification at low and high magnification, with each determining the intensity and area of staining. Area of staining was scored as 0 (no staining), 1 (weakly positive, defined as any proportion of cells showing weak, incomplete membrane staining), 2 (positive, defined as > 10% of cells showing weak to medium intensity staining or complete but uneven brownish yellow coloration of membranes) or 3 (strongly positive, defined as > 30% of cells showing strong, intact membrane staining).
Follow‐up
All included CRC patients were followed up by phone calls once every 3 months during the first 2 years after surgery and every 6 months from 3 to 5 years. Follow‐up included physical examination, laboratory tests, colonoscopy, chest and abdominal CT scans and brain MRI. The start of follow‐up was the day of surgery, with follow‐up continued until 1 September 2020. OS was calculated from the date of surgery to the date of death or last follow‐up, and PFS was calculated from the date of surgery to the date of disease progression (tumor recurrence or metastasis) or last follow‐up. Patients with clinical evidence of recurrence or metastasis during follow‐up were provided individualised treatments to prolong survival and improve patient quality of life.
Immunofluorescence analysis
Two slides were sectioned from each of the 56 tissue samples in the CIT group, as described above. All sections were dewaxed in xylene twice for 15 min each, rehydrated in a gradient ethanol series (absolute, 85% and 75% ethanol for 5 min each), immersed in retrieval buffer (EDTA antigen retrieval buffer pH 8.0, Servicebio, Wuhan, China) and incubated in a microwave oven for 15 min to retrieve antigens. After cooling, the slides were washed three times with PBS and incubated in 3% H2O2 at room temperature in the dark for 25 min to block endogenous peroxidases. After three washes with PBS, the slides were blocked by incubation in 3% bovine serum albumin (BSA, Servicebio) for 30 min and incubated overnight at 4°C with rabbit monoclonal anti‐CD3 primary antibody (Servicebio). The slides were again washed three times with PBS and incubated in the dark for 1 h at room temperature with FITC‐conjugated goat anti‐Rabbit IgG (H + L) secondary antibodies (Servicebio). The slides were washed three times with TBST for 5 min each. After antigen retrieval in a microwave oven for 15 min, the slides were incubated overnight at 4°C with rabbit polyclonal anti‐CD8 beta antibody (Servicebio) or mouse monoclonal anti‐NCAM1 (CD56) antibody (Servicebio). The slides were again washed three times with PBS and incubated for 1 h at room temperature in the dark condition with Cy3‐conjugated goat anti‐rabbit IgG (H + L) (Servicebio) or Cy3‐conjugated donkey anti‐Mouse IgG (H + L) (Servicebio) secondary antibody. After washing three times with PBS, the slides were dried and incubated with DAPI reagents (DAPI solution, Servicebio) for 10 min in the dark. The slides were again washed three times with PBS, sealed with anti‐fluorescence quencher (Servicebio), digitised with a fluorescence pannoramic slide scanner (PANNORAMIC DESK/MIDI/250/1000, 3DHISTECH, Budapest, Hungary) and analysed with appropriate analytic software (Halo v3.0.311.314, Indica labs, Albuquerque, NM, USA). Tissue area, total number of cells and the number of CD3‐positive, CD8‐positive, CD3‐positive/CD8‐positive (CD8+ T cell), CD56‐negative and CD3‐positive/CD56‐negative (NK cell) cells were measured to calculate positive or co‐localised cell density.
Statistical analysis
Continuous variables were compared by the Student's t‐tests, and categorical variables by Pearson's χ2 test or Fisher's exact test. To analyse demographics, clinical characteristics of the patients, tumor cytotoxicity assay, the expression of SLAMF7 in clinical samples and to assess the correlations between SLAMF7 expression and immune cell infiltration. OS and PFS were determined by the Kaplan–Meier methods and compared by the log‐rank test. All statistical analyses were performed using SPSS (Statistical Package for the Social Science, version 22.0, IBM Corp., Armonk, NY, USA) and GraphPad Prism 8 (Version 8.0.2, GraphPad Software, Inc. San Diego, CA, USA) software, with P < 0.05 defined as statistically significant.
CONFLICT OF INTEREST
The authors declare no conflict of interest.
AUTHOR CONTRIBUTIONS
Xiao Li: Data curation; formal analysis; investigation; visualization; writing – original draft. Haodong Zhou: Data curation; investigation; software; validation; visualization. Wenwen Huang: Data curation; investigation; methodology; software; visualization. Xuejuan Wang: Formal analysis; investigation; software; validation. Mingyao Meng: Methodology; resources; supervision. Zongliu Hou: Supervision. Liwei Liao: Supervision. Weiwei Tang: Formal analysis; methodology; Resources. Yanhua Xie: Methodology; resources. Ruotian Wang: Methodology. Haidong Yu: Methodology. Liqiong Wang: Methodology. Huirong Zhu: Methodology. Wenju Wang: Conceptualization; funding acquisition; project administration; validation; Writing – review and editing. Jing Tan: Conceptualization; funding acquisition; project administration; writing – review and editing. Ruhong Li: Conceptualization; funding acquisition; project administration; writing – review and editing.
Supporting information
ACKNOWLEDGMENTS
This work was supported by the National Natural Science Foundation of China (Grant No. 82060536, 81660477 and 81960499), Special and Joint Program of Yunnan Province Science and Technology Department & Kunming Medical University (Grant No. 2019FE001(‐172)), Project of Yunling Scholar (Ruhong Li) and Postgraduate Project of the Scientific Research Fund of the Education Department of Yunnan Province (Grant No. 2021Y345).
Clinical Trials Registry: This study was registered in the Chinese Clinical Trial Registry (ChiCTR), Registration number: ChiCTR2100044702.
Contributor Information
Wenju Wang, Email: wangwenju_vip@hotmail.com.
Jing Tan, Email: kmtjing@sina.com.
Ruhong Li, Email: lrh272@126.com.
REFERENCES
- 1. Bray F, Ferlay J, Soerjomataram I, Siegel RL, Torre LA, Jemal A. Global cancer statistics 2018: GLOBOCAN estimates of incidence and mortality worldwide for 36 cancers in 185 countries. CA Cancer J Clin 2018; 68: 394–424. [DOI] [PubMed] [Google Scholar]
- 2. Siegel RL, Miller KD, Goding Sauer A et al. Colorectal cancer statistics, 2020. CA Cancer J Clin 2020; 70: 145–164. [DOI] [PubMed] [Google Scholar]
- 3. Dekker E, Tanis PJ, Vleugels JLA, Kasi PM, Wallace MB. Colorectal cancer. Lancet 2019; 394: 1467–1480. [DOI] [PubMed] [Google Scholar]
- 4. Peng H, Yao M, Fan H et al. Effects of autologous cytokine‐induced killer cells infusion in colorectal cancer patients: a prospective study. Cancer Biother Radiopharm 2017; 32: 221–226. [DOI] [PubMed] [Google Scholar]
- 5. Zhu H, Yang X, Li J et al. Immune response, safety, and survival and quality of life outcomes for advanced colorectal cancer patients treated with dendritic cell vaccine and cytokine‐induced killer cell therapy. Biomed Res Int 2014; 2014: 603871. [DOI] [PMC free article] [PubMed] [Google Scholar]
- 6. Ganesh K, Stadler ZK, Cercek A et al. Immunotherapy in colorectal cancer: rationale, challenges and potential. Nat Rev Gastroenterol Hepatol 2019; 16: 361–375. [DOI] [PMC free article] [PubMed] [Google Scholar]
- 7. Smith SM, Wachter K, Burris HA et al. Clinical cancer advances 2021: ASCO's report on progress against cancer. J Clin Oncol 2021; 39: 1165–1184. [DOI] [PubMed] [Google Scholar]
- 8. Kirtane K, Elmariah H, Chung CH, Abate‐Daga D. Adoptive cellular therapy in solid tumor malignancies: review of the literature and challenges ahead. J Immunother Cancer 2021; 9: e002723. [DOI] [PMC free article] [PubMed] [Google Scholar]
- 9. Fagan EA, Eddleston AL. Immunotherapy for cancer: the use of lymphokine activated killer (LAK) cells. Gut 1987; 28: 113–116. [DOI] [PMC free article] [PubMed] [Google Scholar]
- 10. Shimasaki N, Jain A, Campana D. NK cells for cancer immunotherapy. Nat Rev Drug Discov 2020; 19: 200–218. [DOI] [PubMed] [Google Scholar]
- 11. Lin B, Du L, Li H, Zhu X, Cui L, Li X. Tumor‐infiltrating lymphocytes: warriors fight against tumors powerfully. Biomed Pharmacother 2020; 132: 110873. [DOI] [PubMed] [Google Scholar]
- 12. June CH, O'Connor RS, Kawalekar OU, Ghassemi S, Milone MC. CAR T cell immunotherapy for human cancer. Science 2018; 359: 1361–1365. [DOI] [PubMed] [Google Scholar]
- 13. Schmidt‐Wolf IG, Negrin RS, Kiem HP, Blume KG, Weissman IL. Use of a SCID mouse/human lymphoma model to evaluate cytokine‐induced killer cells with potent antitumor cell activity. J Exp Med 1991; 174: 139–149. [DOI] [PMC free article] [PubMed] [Google Scholar]
- 14. Guo Y, Han W. Cytokine‐induced killer (CIK) cells: from basic research to clinical translation. Chin J Cancer 2015; 34: 99–107. [DOI] [PMC free article] [PubMed] [Google Scholar]
- 15. Gao X, Mi Y, Guo NA et al. Cytokine‐induced killer cells as pharmacological tools for cancer immunotherapy. Front Immunol 2017; 8: 774. [DOI] [PMC free article] [PubMed] [Google Scholar]
- 16. Linn YC, Hui KM. Cytokine‐induced NK‐like T cells: from bench to bedside. J Biomed Biotechnol 2010; 435745. [DOI] [PMC free article] [PubMed] [Google Scholar]
- 17. Yu B, Wang J, He C et al. Cytokine‐induced killer cell therapy for modulating regulatory T cells in patients with non‐small cell lung cancer. Exp Ther Med 2017; 14: 831–840. [DOI] [PMC free article] [PubMed] [Google Scholar]
- 18. Mata‐Molanes JJ, Sureda González M, Valenzuela Jiménez B, Martínez Navarro EM, Brugarolas MA. Cancer immunotherapy with cytokine‐induced killer cells. Target Oncol 2017; 12: 289–299. [DOI] [PubMed] [Google Scholar]
- 19. Verneris MR, Karimi M, Baker J, Jayaswal A, Negrin RS. Role of NKG2D signaling in the cytotoxicity of activated and expanded CD8+ T cells. Blood 2004; 103: 3065–3072. [DOI] [PubMed] [Google Scholar]
- 20. Zhou Y, Chen C, Jiang S et al. Retrospective analysis of the efficacy of adjuvant CIK cell therapy in epithelial ovarian cancer patients who received postoperative chemotherapy. OncoImmunology 2019; 8: e1528411. [DOI] [PMC free article] [PubMed] [Google Scholar]
- 21. Pan Q‐Z, Tang Y, Wang Q‐J et al. Adjuvant cellular immunotherapy in patients with resected primary non‐small cell lung cancer. Oncoimmunology 2015; 4: e1038017. [DOI] [PMC free article] [PubMed] [Google Scholar]
- 22. Pan KE, Li Y‐Q, Wang W et al. The efficacy of cytokine‐induced killer cell infusion as an adjuvant therapy for postoperative hepatocellular carcinoma patients. Ann Surg Oncol 2013; 20: 4305–4311. [DOI] [PubMed] [Google Scholar]
- 23. Pan KE, Guan X‐X, Li Y‐Q et al. Clinical activity of adjuvant cytokine‐induced killer cell immunotherapy in patients with post‐mastectomy triple‐negative breast cancer. Clin Cancer Res 2014; 20: 3003–3011. [DOI] [PubMed] [Google Scholar]
- 24. Li Y, Wang C, Xu M et al. Preoperative NLR for predicting survival rate after radical resection combined with adjuvant immunotherapy with CIK and postoperative chemotherapy in gastric cancer. J Cancer Res Clin Oncol 2017; 143: 861–871. [DOI] [PMC free article] [PubMed] [Google Scholar]
- 25. Zhang Y, Schmidt‐Wolf IGH. Ten‐year update of the international registry on cytokine‐induced killer cells in cancer immunotherapy. J Cell Physiol 2020; 235: 9291–9303. [DOI] [PubMed] [Google Scholar]
- 26. Pan Q‐Z, Gu J‐M, Zhao J‐J et al. Retrospective analysis of the efficacy of cytokine‐induced killer cell immunotherapy combined with first‐line chemotherapy in patients with metastatic colorectal cancer. Clin Transl Immunol 2020; 9: e1113. [DOI] [PMC free article] [PubMed] [Google Scholar]
- 27. Calpe S, Wang N, Romero X et al. The SLAM and SAP gene families control innate and adaptive immune responses. Adv Immunol 2008; 97: 177–250. [DOI] [PubMed] [Google Scholar]
- 28. Bouchon A, Cella M, Grierson HL, Cohen JI, Colonna M. Activation of NK cell‐mediated cytotoxicity by a SAP‐independent receptor of the CD2 family. J Immunol 2001; 167: 5517–5521. [DOI] [PubMed] [Google Scholar]
- 29. Pazina T, James AM, MacFarlane AW et al. The anti‐SLAMF7 antibody elotuzumab mediates NK cell activation through both CD16‐dependent and ‐independent mechanisms. Oncoimmunology 2017; 6: e1339853. [DOI] [PMC free article] [PubMed] [Google Scholar]
- 30. Hsi ED, Steinle R, Balasa B et al. CS1, a potential new therapeutic antibody target for the treatment of multiple myeloma. Clin Cancer Res 2008; 14: 2775–2784. [DOI] [PMC free article] [PubMed] [Google Scholar]
- 31. Campbell KS, Cohen AD, Pazina T. Mechanisms of NK cell activation and clinical activity of the therapeutic SLAMF7 antibody, Elotuzumab in multiple myeloma. Front Immunol 2018; 9: 2551. [DOI] [PMC free article] [PubMed] [Google Scholar]
- 32. Lee JL, Roh SA, Kim CW. et al. Clinical assessment and identification of immuno‐oncology markers concerning the 19‐gene based risk classifier in stage IV colorectal cancer. World J Gastroenterol 2019; 25: 1341–1354. [DOI] [PMC free article] [PubMed] [Google Scholar]
- 33. Balchen V, Simon K. Colorectal cancer development and advances in screening. Clinical Interventions in Aging 2016; 11: 967–976. [DOI] [PMC free article] [PubMed] [Google Scholar]
- 34. Jackaman C, Majewski D, Fox SA, Nowak AK, Nelson DJ. Chemotherapy broadens the range of tumor antigens seen by cytotoxic CD8+ T cell in vivo . Cancer Immunol Immunother 2012; 61: 2343–2356. [DOI] [PMC free article] [PubMed] [Google Scholar]
- 35. Brignone C, Gutierrez M, Mefti F et al. First‐line chemoimmunotherapy in metastatic breast carcinoma: combination of paclitaxel and IMP321 (LAG‐3Ig) enhances immune responses and antitumor activity. J Transl Med 2010; 8: 71. [DOI] [PMC free article] [PubMed] [Google Scholar]
- 36. Cappuzzello E, Sommaggio R, Zanovello P, Rosato A. Cytokines for the induction of antitumor effectors: the paradigm of Cytokine‐Induced Killer (CIK) cells. Cytokine Growth Factor Rev 2017; 36: 99–105. [DOI] [PubMed] [Google Scholar]
- 37. Zhang L, Wang J, Wei F et al. Profiling the dynamic expression of checkpoint molecules on cytokine‐induced killer cells from non‐small‐cell lung cancer patients. Oncotarget 2016; 7: 43604–43615. [DOI] [PMC free article] [PubMed] [Google Scholar]
- 38. Snaebjornsson P, Coupe VM, Jonasson L, Meijer GA, van Grieken NC, Jonasson JG. pT4 stage II and III colon cancers carry the worst prognosis in a nationwide survival analysis. Shepherd's local peritoneal involvement revisited. Int J Cancer 2014; 135: 467–478. [DOI] [PubMed] [Google Scholar]
- 39. Jiang JT, Shen YP, Wu CP et al. Increasing the frequency of CIK cells adoptive immunotherapy may decrease risk of death in gastric cancer patients. World J Gastroenterol 2010; 16: 6155–6162. [DOI] [PMC free article] [PubMed] [Google Scholar]
- 40. Müller L, Pawelec G. Aging and immunity ‐ impact of behavioral intervention. Brain Behav Immun 2014; 39: 8–22. [DOI] [PubMed] [Google Scholar]
- 41. Buchwald P, Hall C, Davidson C et al. Improved survival for rectal cancer compared to colon cancer: the four cohort study. ANZ J Surg 2018; 88: E114–E117. [DOI] [PubMed] [Google Scholar]
- 42. Tamas K, Walenkamp A, de Vries E et al. Rectal and colon cancer: not just a different anatomic site. Cancer Treat Rev 2015; 41: 671–679. [DOI] [PubMed] [Google Scholar]
- 43. Chen S, Yang M, Du J et al. The self‐specific activation receptor SLAM family is critical for NK cell education. Immunity 2016; 45: 292–304. [DOI] [PubMed] [Google Scholar]
- 44. Khan AM, Devarakonda S, Bumma N, Chaudhry M, Benson DM Jr. Potential of NK cells in multiple Myeloma therapy. Expert Rev Hematol 2019; 12: 425–435. [DOI] [PubMed] [Google Scholar]
- 45. Tognarelli S, Wirsching S, von Metzler I et al. Enhancing the activation and releasing the brakes: a double hit strategy to improve NK cell cytotoxicity against multiple myeloma. Front Immunol 2018; 9: 2743. [DOI] [PMC free article] [PubMed] [Google Scholar]
- 46. Bruni D, Angell HK, Galon J. The immune contexture and Immunoscore in cancer prognosis and therapeutic efficacy. Nat Rev Cancer 2020; 20: 662–680. [DOI] [PubMed] [Google Scholar]
Associated Data
This section collects any data citations, data availability statements, or supplementary materials included in this article.
Supplementary Materials