

Abstract
Background:
Peripheral inflammation is implicated in schizophrenia, however, not all individuals demonstrate inflammatory alterations. Recent studies identified inflammatory subtypes in chronic psychosis with high inflammation having worse cognitive performance and displaying neuroanatomical enlargement compared to low inflammation subtypes. It is unclear if inflammatory subtypes exist earlier in the disease course, thus, we aim to identify inflammatory subtypes in antipsychotic naïve First-Episode Schizophrenia (FES).
Methods:
12 peripheral inflammatory markers, clinical, cognitive, and neuroanatomical measures were collected from a naturalistic study of antipsychotic-naïve FES patients. A combination of unsupervised principal component analysis and hierarchical clustering was used to categorize inflammatory subtypes from their cytokine data (17 FES High, 30 FES Low, and 33 healthy controls (HCs)). Linear regression analysis was used to assess subtype differences. Neuroanatomical correlations with clinical and cognitive measures were performed using partial Spearman correlations. Graph theoretical analyses were performed to assess global and local network properties across inflammatory subtypes.
Results:
The FES High group made up 36% of the FES group and demonstrated significantly greater levels of IL1β, IL6, IL8, and TNFα compared to FES Low, and higher levels of IL1β and IL8 compared to HCs. FES High had greater right parahippocampal, caudal anterior cingulate, and bank superior sulcus thicknesses compared to FES Low. Compared to HCs, FES Low showed smaller bilateral amygdala volumes and cortical thickness. FES High and FES Low groups demonstrated less efficient topological organization compared to HCs. Individual cytokines and/or inflammatory signatures were positively associated with cognition and symptom measures.
Conclusions:
Inflammatory subtypes are present in antipsychotic-naïve FES and are associated with inflammation-mediated cortical expansion. These findings support our previous findings in chronic psychosis and point towards a connection between inflammation and blood-brain barrier disruption. Thus, identifying inflammatory subtypes may provide a novel therapeutic avenue for biomarker-guided treatment involving anti-inflammatory medications.
Keywords: first episode schizophrenia, cytokines, inflammation, subtypes, neuroimaging, graph theory, connectome, cognition, symptoms
1. Introduction
Schizophrenia is debilitating, affecting ~3.5 million Americans, and it inflicts an estimated annual economic burden of $155.7 billion (Wander, 2020). The disease is heterogeneous in etiology, phenotypes, and biomarkers which makes it difficult to understand and treat. Thus, there is a cardinal need for subtyping schizophrenia patients based on biosignatures to reduce this heterogeneity; thereby providing more biologically homogenous groups.
One prominent theory in schizophrenia is the neuroinflammation hypothesis, which proposes that schizophrenia is associated with increased levels of several pro-inflammatory cytokines induced by a microglial response to various pathological processes in the brain (Buckley, 2019; Monji et al., 2009). Post-mortem studies support this hypothesis, with a recent meta-analysis showing an increase in expression of proinflammatory genes (IL1β, IL6, IL8, and TNFα) and protein levels (IL1β and TNFα), as well as microglial density in schizophrenia compared to healthy controls (HCs) (van Kesteren et al., 2017). An alternative hypothesis in schizophrenia suggests there are deficits within brain microvascular endothelial cells (BMEC) or choroid plexus epithelial cells (CPEC), which make up the blood-brain barrier (BBB) and blood-cerebral spinal fluid (CSF) barrier respectively, and help to protect the brain (Lizano et al., 2019; Pong et al., 2020). Thus, inherent alterations in BMEC or CPEC function in schizophrenia may lead to BBB or blood-CSF leakage and the activation of an inflammatory cascade involving the release of cytokines from BMECs or CPECs themselves, as well as microglia and astroglia that are subsequently measurable in the blood (Balusu et al., 2016; Pong et al., 2020).
Despite the convincing evidence implicating peripheral inflammation in schizophrenia, increased cytokine levels are not evident in all individuals (Bishop et al., 2021). Instead, peripheral inflammation is found within a subset of patients who are potentially linked to poorer response to antipsychotic treatment (Bishop et al., 2021; Mondelli et al., 2015). Previous studies, including our own, have identified this subtype from combinations of post-mortem brain and peripheral inflammatory marker levels using clustering techniques, and they estimated that approximately 30% to 50% of patients with schizophrenia may be classified into an elevated inflammatory subtype (Boerrigter et al., 2017; Fillman et al., 2014; Lizano et al., 2020b). Additionally, the identification of inflammatory-based grouping has been useful in other mental disorders. In depression, post hoc analysis showed that individuals with elevated C-reactive protein levels (>5mg/L) had a significant improvement in depressive symptoms and sleep quality after anti-inflammatory treatment with the TNFα Antagonist, Infliximab (Raison et al., 2013; Weinberger et al., 2015). Such stratification in schizophrenia using inflammatory biosignatures may also help identify subgroups of individuals who could best respond to anti-inflammatory treatments, especially when they do not respond to antipsychotics (Barbosa et al., 2021; Bishop et al., 2021).
A recent meta-analysis of 35 studies raised concerns regarding the validity of inflammatory subgroups in antipsychotic-naïve first-episode psychosis (FEP) (Pillinger et al., 2019). The authors asserted that since there is less immune measure variability in FEP relative to HCs that immune alterations are a core component of psychosis pathophysiology and not a characteristic of a subgroup. This argument has many limitations, including diagnostic heterogeneity in the FEP sample, moderate to high inconsistency between studies, small sample sizes, poor assay sensitivity, and other confounders. Additionally, all studies in this meta-analysis used unitary cytokine measures instead of a cytokine signature, the latter of which is essential for understanding the complex interplay between inflammatory markers.
To address this subgrouping issue, our group recently used a data-driven approach for categorizing chronic psychosis spectrum patients into high and low inflammatory subtypes and found that 36% of psychosis probands had elevated levels of a peripheral inflammatory signature (Lizano et al., 2020b). Individuals with psychosis in the high inflammatory subtype had significantly greater cortical thicknesses and larger subcortical volumes than individuals with psychosis in the low inflammatory subtype. It was hypothesized that these findings could reflect the disruption of the BBB. Furthermore, the high inflammatory subtype performed worse on visuospatial working memory and inhibitory behavioral control than those in the low inflammatory subtype, but there were no clinical symptom differences. This study demonstrated the potential to expand the battery of blood-based biomarkers and guided anti-inflammatory therapy tailored to the patient’s peripheral inflammatory signature.
Similar to inflammatory signatures, investigating single cortical structural abnormalities between HCs and probands may not be as informative as studying whole-brain connectivity to quantify brain topological networks. Extensive studies have found an abnormal topological organization of structural and functional brain networks in schizophrenia across various disease states (Bassett et al., 2008; Fornito et al., 2012; Rubinov and Bullmore, 2013; Sheffield et al., 2017; Zhang et al., 2015). However, no study to date has examined the impact of inflammatory subtypes on brain structural topological networks.
Since the previous inflammatory subtype findings (Cai et al., 2020; Catts et al., 2014; Fillman et al., 2013, 2014, 2016; Lizano et al., 2020b; Zhang et al., 2016) could have been confounded by illness chronicity, antipsychotic medications, and lifestyle habits (i.e. diet/exercise), (Brown et al., 1999; Dickerson et al., 2007; Ferrante, 2007; Pollmächer et al., 2000; Stubbs et al., 2016), we test the replicability of the inflammatory subtype hypothesis in an antipsychotic-naïve first-episode schizophrenia (FES) population. We hypothesize that elevated inflammatory subtypes exist in the antipsychotic-naïve FES population and that the high inflammatory group would display greater brain thickness and volume measures as well as demonstrate less efficient topological organization compared to the low inflammatory group and HCs.
2. Methods
2.1. Participants
This study included 47 FES and 33 HC individuals. Participants were recruited from the Western Psychiatric Institute Clinic and local communities in Pittsburgh from 1996 to 2004, and they provided written informed consent or assent. This study was approved by the University of Pittsburgh and VA Pittsburgh Healthcare System (VAPH) Institutional Review Board. The FES participants were diagnosed with schizophrenia via the SCID for DSM-IV and confirmed by senior diagnosticians within 1 year of study entry (Bell, 1994). General exclusion criteria included significant head injury, neurological/medical illness, prior antipsychotic exposure, mental retardation, or no current substance abuse or dependence. Exclusion criteria for HCs included a history of mental illness. Further details regarding recruitment and assessments methods were previously described (Hoang et al., 2021; Keshavan et al., 2003; Lizano et al., 2016). Sociodemographic information for FES and HCs is presented in Supplementary Table 1, and it is similar to the sample reported in our previous report (Lizano et al., 2016). The two groups did not significantly differ in age, sex, race, or handedness, but there was a trend level effect for socioeconomic status (p=0.06).
2.2. Clinical and Cognition Measures
The Buchanan-Heinrich Neurological Evaluation Scale (NES) (Buchanan and Heinrichs, 1989; Lizano et al., 2020a) and Wisconsin Card Sorting Test (WCST) (Kongs, S.K., Thompson, L.L., Iverson, G.L., Heaton, R.K., 2000) used to measure soft neurological soft signs and cognitive shifting, respectively. The Hollingshead Four-Factor Index (“Hollingshead Four-Factor Index of Socioeconomic Status (SES-Child) — Nathan Kline Institute - Rockland Sample documentation,” 1975) and Edinburgh Handedness Inventory (Oldfield, 1971) assessed for parental socioeconomic status and handedness, respectively. In FES patients, symptom severity was measured using the Scale for the Assessment of Positive Symptoms (SAPS) and Negative Symptoms (SANS) (Andreasen, 1990), the Brief Psychiatric Rating Scale (BPRS) (Overall and Gorham, 1962). Depression was measured using the Hamilton Depression Rating Scale (HAM-D) (Hamilton, 1960). Lastly, functioning was assessed via the Clinical Global Impression (CGI) (Haro et al., 2003) and Global Assessment of Functioning (GAF) (Endicott et al., 1976).
2.3. Peripheral Marker Assaying and Processing
Available peripheral markers for this study cohort included IL1β, IL6, IL8, IL10, IL12/IL23p40, IFNγ, TNFα, sFlt-1, BDNF, bFGF, PlGF, and VEGF) and we have previously published case control comparisons using these markers (Lizano et al., 2016). These markers were obtained from blood samples after an overnight fast. The samples were centrifuged at 4°C for 20 mins at 2,000 × g and the remaining supernatant (plasma) was collected. The samples were deidentified, aliquoted, and frozen at −80 °C. Plasma marker concentrations were determined using Meso Scale Discovery (MSD) Multi-Array Technology. Data were reported as the absolute concentration in the plasma, lower limit of detection (LLOD), or quantity not sufficient (QNS). Technicians performed assays without knowledge of the participants’ clinical statuses. Markers with values below the LLOD were censored and QNS values were not included in the analyses. Since the marker data were not normally distributed, natural log-transformation was performed. Further details regarding plasma collection and cytokine quality control are outlined in our previous study (Lizano et al., 2016).
2.4. Exploratory Factor Analysis
Similar to our previous inflammatory subtyping paper across the psychosis spectrum (Lizano et al., 2020b), we performed a principal component analysis (PCA) followed by hierarchical clustering to identify subtypes in this FES study. A similar set of markers used in Lizano et al. were also investigated in this study except for C-reactive protein (CRP), C4a, TNFβ, and VEGFD, which were not available (Lizano et al., 2020b). This study included PlGF, bFGF, and BDNF, which were not part of our original study. In brief, a PCA of 12 inflammatory markers was conducted across the entire sample to reduce the dimension of variables for the subsequent clustering task. We selected the first five principal components (PCs) because they can explain more than 75% of total variance using the Kaiser rule and elbow method. Similarities in PC scores were tested using a two-sample t-test between FES and controls. Due to sample size limitations in HCs, hierarchical clustering was only performed in the FES group using PC scores from the PCA. A dissimilarity matrix was calculated to quantify the Euclidean distance between every pair of subjects. The agglomerative coefficient for the average, single, complete, or Wards method was calculated to determine the optimal number of PC scores or combination of PC scores to include in the dimensional feature space, and the highest agglomerative score was used to identify the optimal clustering solution. The optimal number of clusters was confirmed using the Silhouette method.
2.5. Structural Neuroimaging Acquisition and Processing
Structural T1 MPRAGE (1.5T GE Signa HDX) scans were available for a subset of participants (16 FES and 14 HCs). Regional brain volumes were measured with three-dimensional spoiled gradient recall acquisition in the steady-state pulse sequence, which obtained 2.6-mm thick contiguous axial images (echo time=20 msec, repetition time=40 msec, acquisition matrix=256×192, field of view=20 cm, flip angle=10°). Automated brain segmentation was performed using FreeSurfer software (version 6.0, http://surfer.nmr.mgh.harvard.edu/) and Desikan-Killiany atlas (Desikan et al., 2006)). Scans were assessed for artifacts followed by first-level auto-reconstruction to register the scans into standard space and for skull stripping. Images were edited to remove dura, sinuses, and blood vessels. Second and third-level auto-reconstructions were performed to extract cortical thickness and subcortical volume measurements. Cortical gray matter thicknesses for 28 bilateral brain regions (banks of the superior temporal sulcus, caudal anterior cingulate, caudal middle frontal, cuneus, entorhinal, inferior parietal, isthmus cingulate, lateral occipital, lingual, middle temporal, parahippocampal, paracentral, pars opercularis, pars orbitalis, pars triangularis, pericalcarine, post central, posterior cingulate, precentral, precuneus, rostral middle frontal, superior frontal, superior parietal, superior temporal, supramarginal, temporal pole, transverse temporal, insula) and subcortical volume measurements for 7 bilateral subcortical regions (accumbens, amygdala, caudate, hippocampus, pallidum, putamen, and thalamus) were chosen based on their associations with peripheral inflammatory markers (Fillman et al., 2016; Goff et al., 2018; Lizano et al., 2020b; Pillai et al., 2016). Total intracranial volume (ICV) was also extracted for covarying purposes when examining volume measures.
2.6. Statistical Analysis
Statistical analyses were performed using R statistical software (version 4.0.3). Power calculation could not be performed since a study of this kind does not exist in un-medicated FES. Also, our prior study could not be used for calculating power since the studies differed in regards to age, duration of illness, diagnosis, and medication status. However, from the literature and our own study we predicted that approximately 35% of the population would be categorized into the high inflammatory group (Cai et al., 2020; Catts et al., 2014; Fillman et al., 2016, 2014, 2013; Lizano et al., 2020b; Zhang et al., 2016). Demographic and clinical variables were assessed using chi-squared tests, t-tests, or analysis of variance (ANOVA). Univariate ANOVAs were used to test moderator effects of age, sex, race, handedness, socioeconomic status, and duration of illness on peripheral markers, PC scores, as well as cortical thickness and subcortical volumes measures. Based on these sensitivity analyses, we included age, sex, and race (African Americans, Caucasians, and others) as covariates for the analysis of peripheral markers and PC loadings, while age, sex, race, socioeconomic status, and handedness were used for cortical thickness analyses. ICV was used in addition to the abovementioned covariates for subcortical volume analyses. The clinical and cognition measures were covaried for age, sex, and race. Group differences were computed using general linear models while controlling for confounding variables. Multiple comparison correction was performed using the Benjamini Hochberg method, and the significance threshold (denoted as “q”) was set at <0.1 (Benjamini and Hochberg, 1995). Covariate adjusted Cohen’s d effect sizes were reported. Partial Spearman correlations were performed between natural log-transformed peripheral markers/PC loadings and structural, cognition, and clinical measures within and between diagnostic groups (FES High, FES Low, and HCs).
2.7. Network Construction and Analyses
Topological properties of brain networks were calculated using the Brain Analysis using Graph Theory (BRAPH) software (http://braph.org/) (Mijalkov et al., 2017). Graph theory is an advanced mathematical framework used for the study of pair-wise relations between interacting elements (Bollobás and Thomason, 1985). A graph theory analysis yields a connectivity matrix that reveals the relationships among nodes via edges. In this study, the cortical thicknesses and subcortical volumes from 70 brain regions noted above served as nodes in the network analysis. The nodes were adjusted for age, sex, race, socioeconomic status, handedness, and ICV (volumes only) prior to graph analyses. Edges between these nodes were computed by Pearson correlations, with negative correlations set to zero. Analyses were performed on binary undirected graphs, while controlling for the number of connections, across the initial range of densities from 5% to 40% with an accretion of 1%. Small-worldness was computed by non-parametric permutation tests with 1000 permutations. The density range used was from 0.19 to 0.40 for HC versus FES High, from 0.14 to 0.40 for HC versus FES Low, and from 0.19 to 0.40 for FES Low versus FES High. These ranges were chosen based on the small-worldness scalar value (σ) > 1, ensuring that the network exhibit small-worldness properties for the selected density ranges (Watts and Strogatz, 1998; Zhang et al., 2020). To assess for significant differences between groups, non-parametric permutation tests with 10,000 permutations were utilized to compute global measures (average degree, characteristic path length, global efficiency, local efficiency, clustering coefficient, transitivity, modularity, and assortativity coefficient) to assess the topology of the whole-brain network, as well as nodal measures (degree, path length, global efficiency nodes, local efficiency nodes, clustering nodes, between centrality, closeness centrality, and participation) to determine nodal network measures. Significant results were defined as having one-tailed p-value <0.05 across at least 3 or more densities. See supplementary text for descriptions of the global and nodal measures.
Nodal measures were categorized into functional units of integration, segregation, and centrality (Rubinov and Sporns, 2010). Functional integration quantifies the brain’s ability to rapidly synthesize information across various neuroanatomical regions, and it could be measured by path length and global efficiency. Path length was chosen as the primary measure of integration, and it is inversely related to global efficiency. Functional segregation measures the brain’s ability for specialized processing to occur within densely interconnected groups of brain regions and is comprised of the local efficiency and clustering coefficient measures. Centrality provides a measure of important brain hubs and is comprised of degree, closeness centrality, betweenness centrality, and participation. Significant nodal measures are reported if they have at least two significant nodal measures in the same groupings (segregation, integration, or centrality) as well as overlapping density ranges.
3. Results
3.1. PC Analysis using Peripheral Markers
These analyses resulted in five PCs, each with different magnitude loadings of the inflammatory markers (Figure 1a). For example, PC1 had greater loading for IL10, IL1β, IL6, IL8, TNFα, PlGF, VEGF, bFGF, sFlt-1, and BDNF, with smaller loading magnitudes for IFNγ and IL12/IL23p40. None of the five PCs significantly differed between FES and HCs (Figure 1b), which was expected since we previously showed that there were no peripheral marker differences between FES and HCs (Lizano et al., 2016).
Figure 1: Inflammatory Signatures and Subtypes:
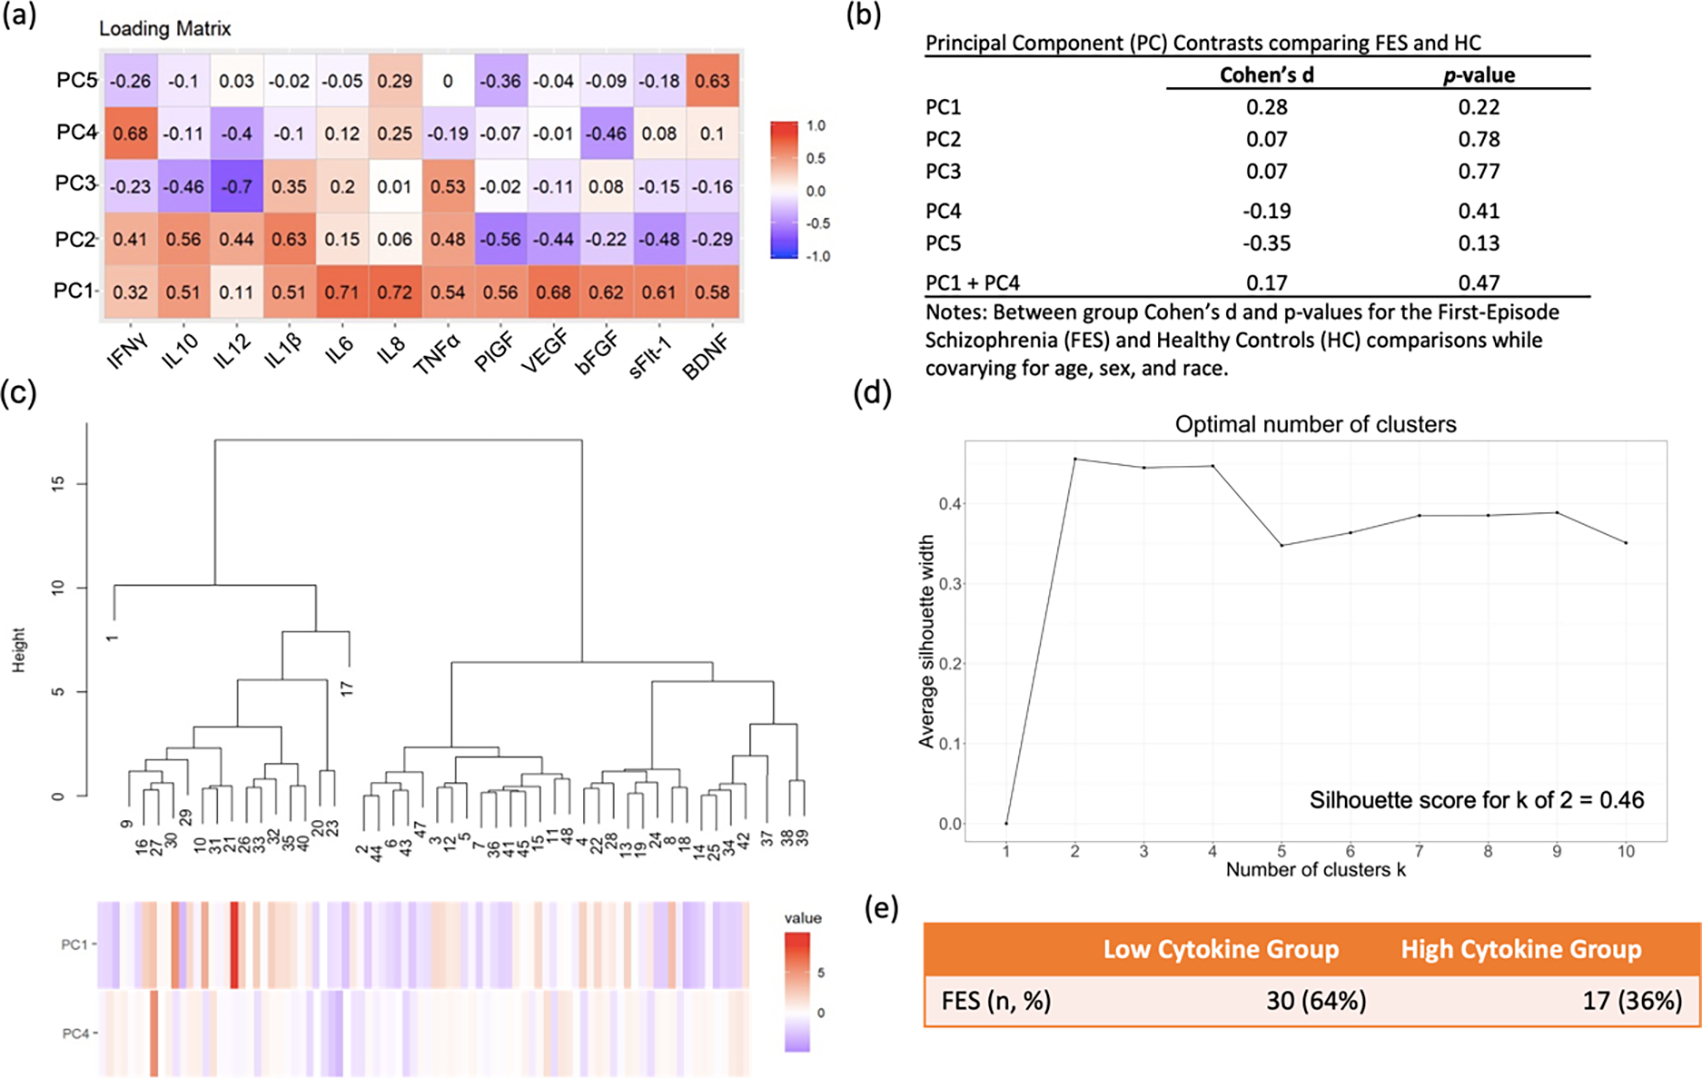
(a) Heatmap showing Cohen’s d effect size for the principal component (PC) scores. Scores with lower explained variance have smaller magnitude loadings. (b) Group comparisons of PCs in First-Episode Schizophrenia (FES) and Healthy Controls (HC). (c) Hierarchical clustering analysis with the height of each linkage in the dendrogram representing the distance between the clusters joined by that link. (d) Visualization of the optimal number of clusters using the Silhouette method. (e) Table showing that the high cytokine subgroup made up 36% of the FES group.
3.2. Peripheral Marker Data Subtyping
Unsupervised hierarchical clustering was performed in FES using PC1 through PC5 and a combination of PCs. The sum of PC1 and PC4 scores provided the highest agglomerative score (Ward’s method coefficient = 0.95). A two-cluster solution was defined as optimal for defining relatively homogenous subgroups based on hierarchical clustering with a Silhouette score of 0.46 (Figure 1c, 1d). This method categorized 36% of FES patients into the elevated inflammation subtype (FES High), which is similar to prior estimates (Boerrigter et al., 2017; Fillman et al., 2016, 2014, 2013; Lizano et al., 2020b). The resulting sample size included 80 participants: 17 FES High [36%], 30 FES Low [64%], and 33 HCs (Figure 1e). The FES High, FES Low, and HC groups did not significantly differ in age, sex, race, handedness, or socioeconomic status. Also, the FES High group did not significantly differ in duration of illness compared to the FES Low group (Table 1).
Table 1:
Sociodemographic measures for inflammatory subtypes and HC groups
| FES High n=17 | FES Low n=30 | HC n=33 | χ2,F | p-value | |
|---|---|---|---|---|---|
|
|
|||||
| Age, mean (sd) | 24.3 (9.3) | 26.5 (8.7) | 25.1 (6.3) | 0.487 | 0.62 |
| Sex (Male/Female) | 11/6 | 20/10 | 20/13 | 0.258 | 0.88 |
| Race (AA/OT/CA) | 6/2/9 | 11/4/15 | 8/5/20 | 1.330 | 0.86 |
| Handedness (Left/Mixed/Right) | 2/0/15 | 0/3/27 | 1/1/31 | 6.740 | 0.15 |
| SES, mean (sd) | 40.3 (13.6) | 34.7 (12.0) | 42.2 (11.8) | 3.040 | 0.05 |
| Duration of illness in years, mean (sd) | 3.0 (2.6) | 3.1 (4.7) | -- | 0.003 | 0.96 |
| SANS, mean (sd) | 43.6 (11.4) | 42.9 (10.0) | -- | 0.051 | 0.82 |
| SAPS, mean (sd) | 29.5 (16.0) | 27.4(10.6) | -- | 0.283 | 0.60 |
| HRSM24, mean (sd) | 19.5 (11.8) | 21.2 (9.3) | -- | 0.300 | 0.59 |
| NESTOT13, mean (sd) | 7.5 (4.0) | 7.6 (4.2) | 3.1 (2.1) | 16.300 | <0.001 |
| GAF, mean (sd) | 33.5 (12.8) | 32.2(11.1) | -- | 0.146 | 0.70 |
| CGI, mean (sd) | 4.6 (1.0) | 4.8 (0.7) | -- | 0,436 | 0.513 |
Note: FES = First-Episode Schizophrenia; HC = Healthy Controls; sd = standard deviation; AA = African American; OT = Other; CA = Caucasian; SES = socioeconomic status; SANS = Scale for the Assessment of Negative Symptoms Total Scores; SAPS = Scale for the Assessment of Positive Symptoms Total Scores; HRSM24 = Hamilton Depression Rating Scale Scores for 24 Items; NESTOT13 = Neurological Evaluation Scale Total Score; GAF = Global Assessment of Functioning Total Scores; CGI = Clinical Global Impression Total Scores.
3.3. Peripheral Marker Group Comparisons by Subtype
The FES High group had significantly elevated levels of IL1β (d=1.12, q=0.003), IL6 (d=1.15, q=0.009), IL8 (d=1.59, q=0.0001), and TNFα (d=0.97, q=0.010) compared to FES Low as well as higher levels of IL1β (d=1.12, q=0.015) and IL8 (d=0.96, q=0.015) compared to HCs (Figure 2). There were no significant group differences in cytokine levels between FES Low and HCs, but overall, cytokines levels were lower in the FES Low group (Figure 2). The mean and standard deviation for each peripheral marker by group are presented in Supplementary Table 2. From this table, it is important to note that how large the difference is between the FES high group and HC group for IL1β, IL6, IL8 and TNFα. Another important observation is how much lower the standard deviation is in the FES Low and HC groups compared to the FES high group. These data help to demonstrate that in the FES group there is a potentially sizable difference that exists within FES groups. Since socioeconomic status was trending between the inflammatory subtypes, a post hoc analysis was performed using socioeconomic status as an additional covariate and the results remained the same (data not shown). The HC group was not stratified into inflammatory subtypes due to the limited sample size.
Figure 2: Inflammatory Subtype Comparisons.
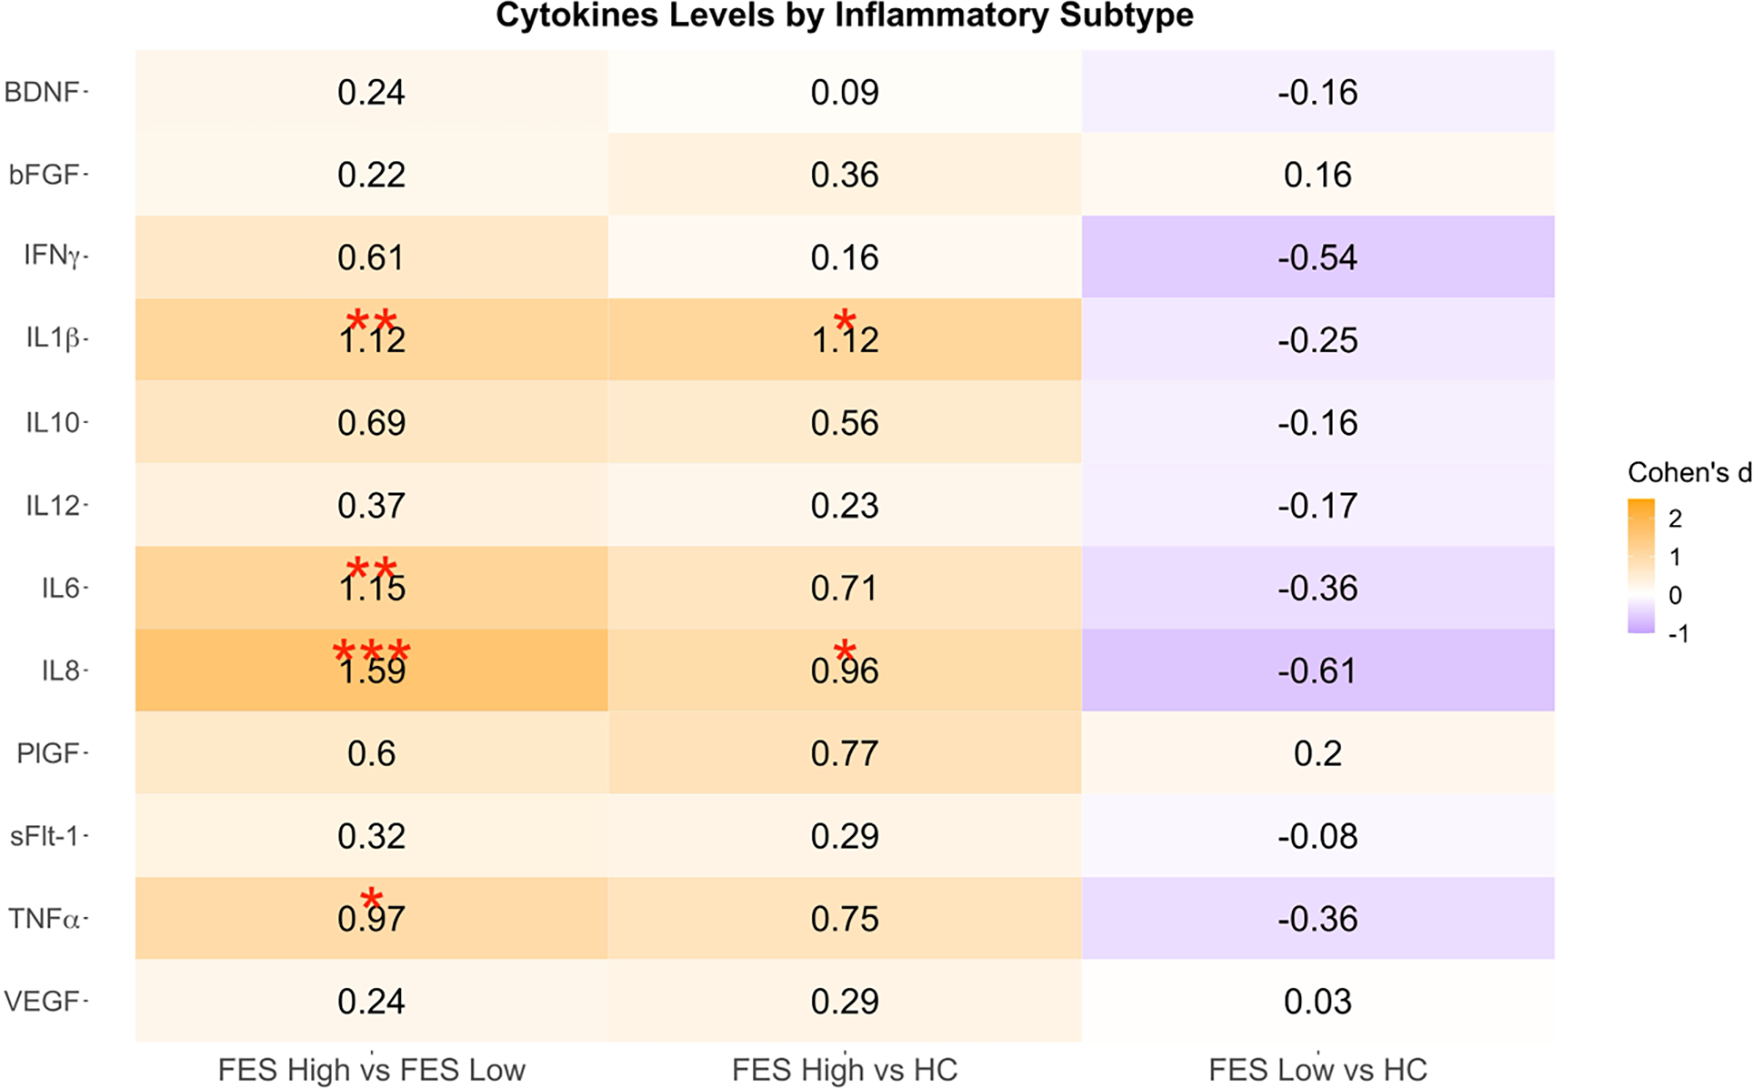
Pairwise contrasts of baseline cytokine levels between FES (First-Episode Schizophrenia) High, FES Low, and HC (Healthy Control). Cohen’s d estimates were adjusted for age, sex, and race.
*q < 0.05; **q < 0.01; ***q < 0.001.
3.4. Peripheral Marker Relationships with Structural MRI, Cognition, and Symptoms
Correlations between the peripheral markers or PCs with brain structural measures in the HC, FES, FES Low, and FES High groups are demonstrated in the chord diagrams for relationships that were significant at a p-value < 0.05 (Figure 3). HCs were observed to have more positive associations between PCs or peripheral markers and brain structures, particularly in the frontal, cingulate, parietal, temporal, and occipital regions. In the overall FES group, there were more inverse correlations between the PCs or inflammatory markers and brain structures, particularly in the frontal, parietal, occipital, and subcortical regions, and these effects were primarily impacted by the FES Low group in the frontal and parietal regions. However, in the FES High group PC1, bFGF, IL1β, and IL6 were positively correlated to the right rostral middle frontal region. Details regarding the r-values, p-values, and q-values of these associations are outlined in Supplementary Table 3.
Figure 3: Gray matter thickness and subcortical volume correlations with inflammatory phenotypes.
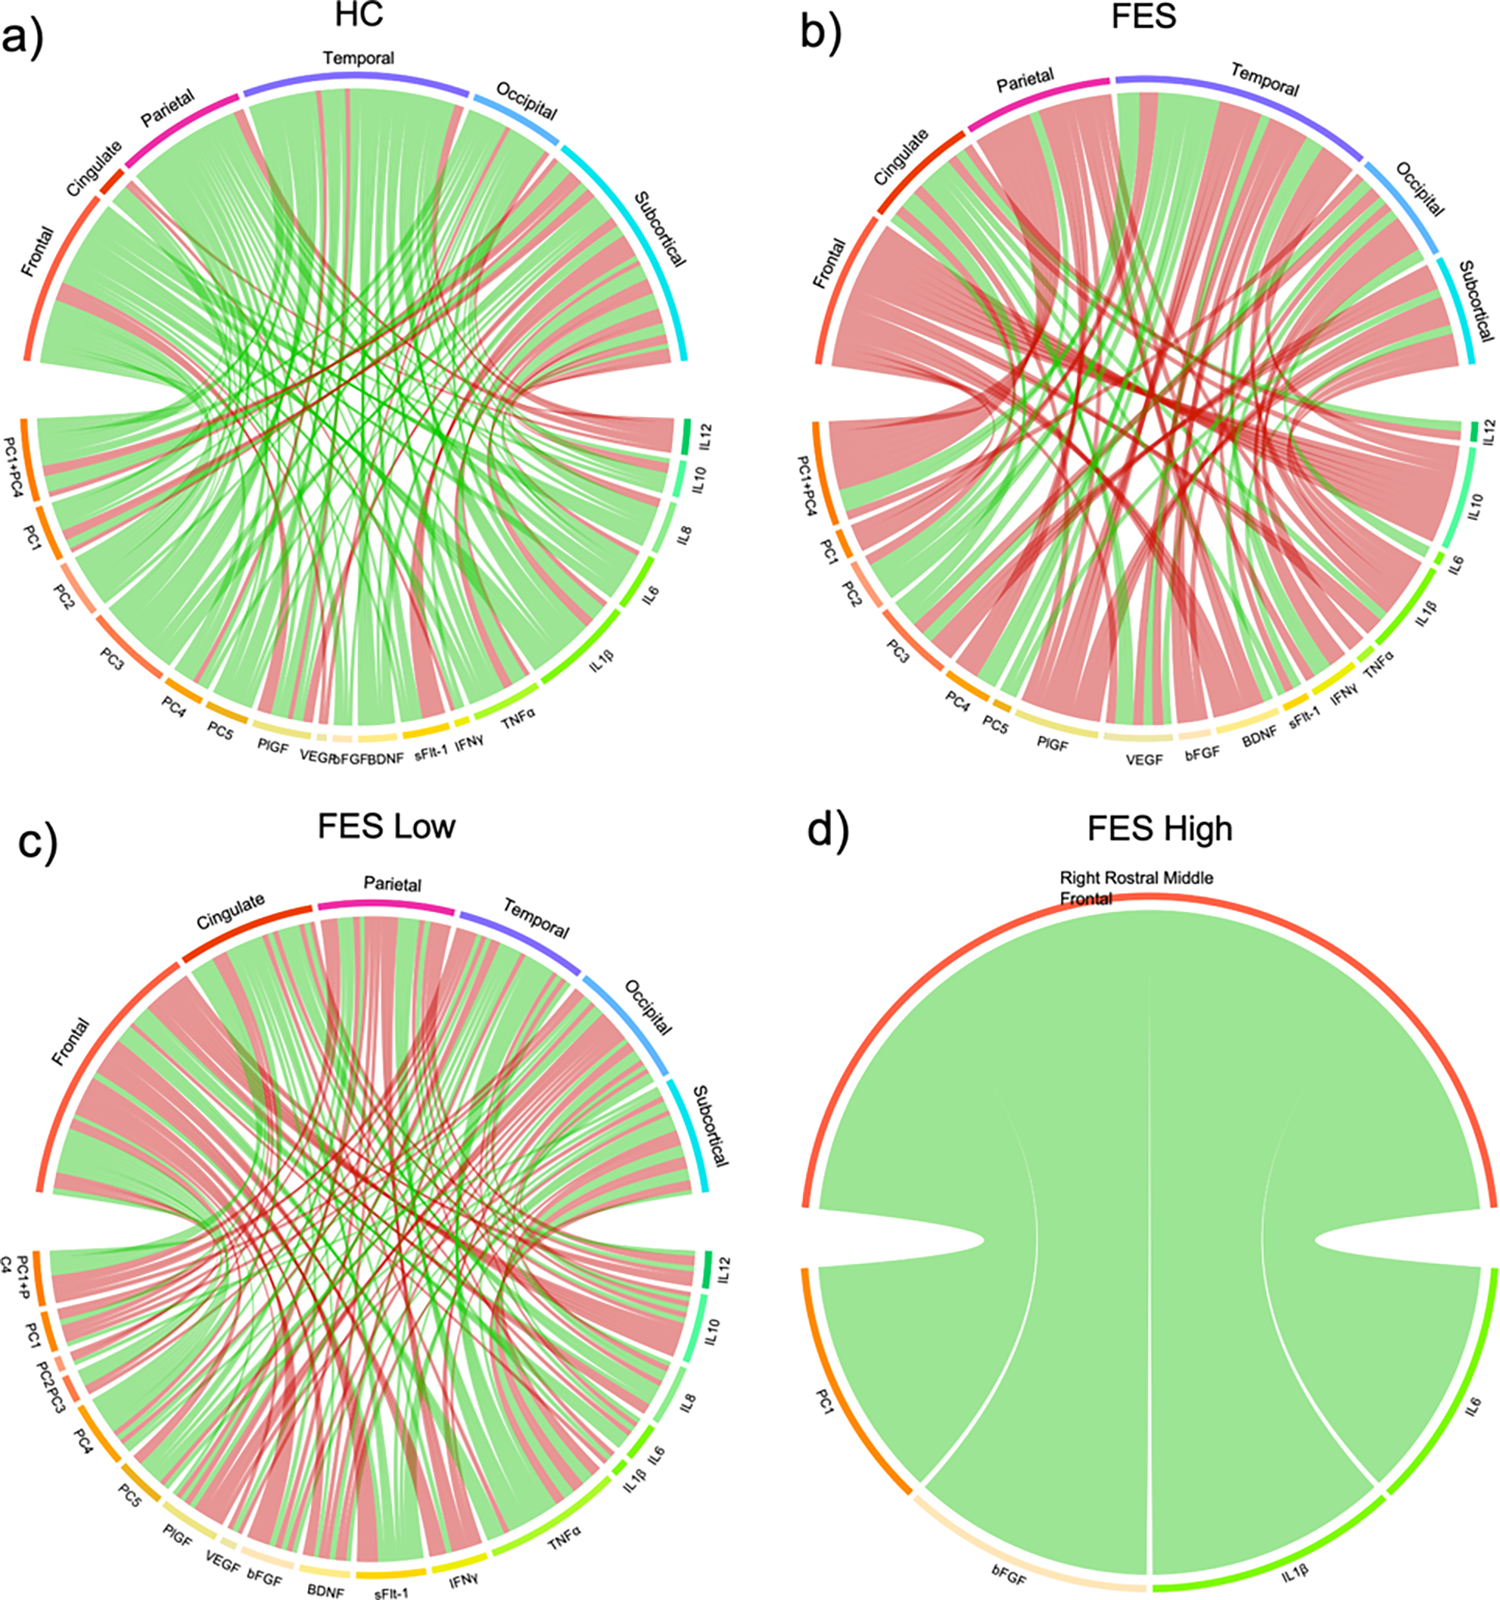
Chord diagrams showing correlations with p<0.05 between the principal components (PC), peripheral markers, and brain structural measures in (a) Healthy Controls (HC, n=14), (b) First-Episode Schizophrenia (FES, n=16), (c) FES Low (n=10), and (d) FES High (n=6). PCs and peripheral markers were adjusted for age, sex, and race. Cortical thickness measures were adjusted for A= age, sex, race, handedness, and socioeconomic status, and subcortical volume were adjusted for A + intracranial volume. Red lines depict a negative correlation and green lines depict a positive correlation.
Neuroanatomical differences between FES subtypes are shown in Figure 4. Overall, FES High displayed greater cortical thickness and subcortical volume compared to FES Low and HCs. Specifically, FES High had higher thickness in the right parahippocampal (d=1.071, p=0.019), right caudal anterior cingulate (d=1.195, p=0.042), and right bank superior sulcus (d=1.450, p=0.007) compared to the FES Low group (Figure 4). Compared to HCs, the FES Low group demonstrated reduced thickness in the right pars triangularis (d=−0.763, p=0.043), right insula (d=−0.692, p=0.077), right bank superior sulcus (d=−1.484, p=0.00016, q=0.028), left supramarginal (d=−0.734, p=0.053), left posterior cingulate (d=−0.735, p=0.049), left insula (d=−0.957, p=0.009), and left caudal middle frontal (d=−0.677, p=0.085). Furthermore, the FES Low group had smaller volumes in bilateral amygdala (right, d=−0.783, p=0.047; left, d=−0.675, p=0.092) compared to HCs. FES High had reduced thickness in the left bank superior sulcus (d=−0.915, p=0.072), left caudal middle frontal (d=−1.056, p=0.011), left lingual (d=−0.792, p=0.060), left insula (d=−0.805, p=0.048), but increased thickness in the right parahippocampal (d=1.430, p=0.035) compared to HCs.
Figure 4: Gray matter thickness and subcortical volume differences between inflammatory subtypes.
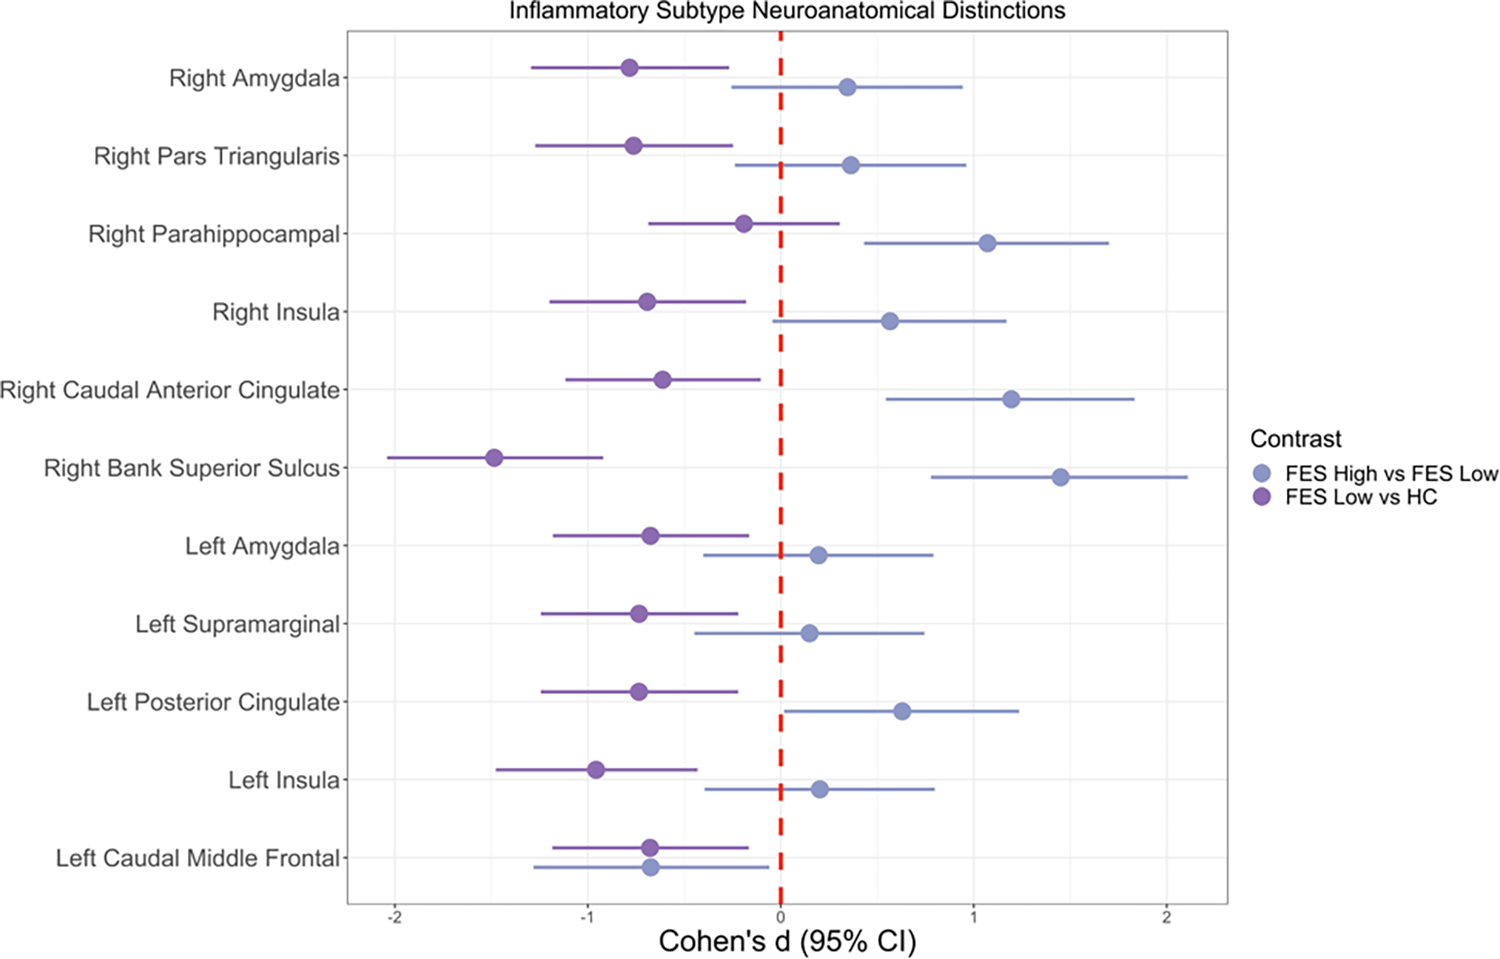
Pairwise contrasts of gray matter cortical thickness variables between FES (First-Episode Schizophrenia) High, FES Low, and HC (Healthy Control) subjects. Solid circles indicate Cohen’s d, and solid lines indicate 95% confidence intervals. Regions represented are significant in either or both group contrasts (p<0.1), and none survived multiple comparison correction. Cohen’s d estimates were adjusted for age, sex, race, socioeconomic status, and handedness. Sample size: 6 FES High, 10 FES Low, and 14 HC.
There were no significant relationships observed between inflammatory subtypes and soft neurological signs, cognitive set shifting, or clinical outcomes as shown in Supplementary Table 4. However, there were significant relationships between PCs or peripheral markers with cognition or symptom measures, but these did not survive multiple comparison corrections. Relationships between PC or peripheral markers and clinical or cognitive measures in FES, FES High, and FES Low are outlined in Supplementary Table 5. The observed correlations in the overall FES group were primarily driven by the FES Low group with PC1+PC4 being associated with worse Clinical Global Impression total scores (r=0.387, p=0.039) and Global Assessment of Functioning total scores (r=−0.376, p=0.042) in FES Low, but not in the FES High group.
3.5. Brain Connectivity Group Comparisons
There were no significant global network property differences between HCs and FES High. FES Low had a significantly lower local efficiency (global) across the 0.21–0.23 density range compared to FES High. HCs displayed a significantly higher assortativity coefficient (global) across the 0.37–0.40 density range compared to FES Low (data not shown).
Nodal network topologies for measures of integration (only path length depicted), segregation, and centrality between inflammatory subtypes are shown in Figure 5. Overall, the FES High group had the most regions with alterations, demonstrating less efficient topological organization compared to the FES Low or HC group. Specifically, compared to HCs, FES High displayed significantly greater measures of segregation in the left pericalcarine and right posterior cingulate, but significantly worse measures in the left lateral occipital, left inferior parietal, left superior parietal, left banks of superior temporal sulcus, left precuneus, right superior parietal, and right postcentral. FES High had significantly lower path length (higher global efficiency) in the left pericalcarine, but higher path length (lower global efficiency) in the left rostral middle frontal region compared to HCs. FES high had significantly higher centrality in the left lateral occipital, left pericalcarine, right superior parietal, and right postcentral but significantly lower centrality in the left rostral middle frontal and right paracentral compared to HCs (see Supplementary Table 6 for additional details).
Figure 5: Nodal network topologies for measures of integration, segregation, and centrality in inflammatory subtypes.

Segregation findings are reported for regions that had significant differences for both local efficiency and clustering. Integration findings are reported for regions that had significant differences for both path length and global efficiency (only path length findings are shown here). Centrality findings are reported for regions that had significant differences for two out of four properties including degree, betweenness, closeness, or participation. Blue circles denote lower network property values in Group 1 vs Group 2; Orange circles denote higher network property values in Group 1 vs Group 2. HC=healthy controls; FES=First-episode schizophrenia; l=left; right; ACC=accumbens; BKS=banks of superior temporal sulcus; CAS=caudal anterior cingulate; CAU=caudate; CMF=caudal middle frontal; ENT=entorhinal; HIP=hippocampus; INS=insula; IP=inferior parietal; LO=lateral occipital; PARAC=paracentral; PCG=posterior cingulate; PERI=pericalcarine; PHIP=parahippocampal; POB=pars orbitalis; POC=precentral; PREC=precuneus; PT=pars triangularies; RMF=rostral middle frontal; SP=superior parietal; ST=superior temporal; SUPRA=supramarginal; TAL=thalamus; TP=temporal pole; TRANS=transverse temporal.
Compared to HCs, FEP Low exhibited significantly higher measures of segregation in the left accumbens and left caudal anterior cingulate, but significantly worse measures in the left precentral and right caudate. FES Low had significantly lower path length in the left insula and bilateral caudate compared to HCs. FES Low display significantly higher measures of centrality in the left precuneus, left insula, bilateral caudate, and right pars triangularis and significantly lower centrality in the right temporal pole compared to HCs (Supplementary Table 5).
Compared to FES Low, FES High had significantly higher measures of segregation in the left pericalcarine, left hippocampus, left caudal anterior cingulate, right parahippocampal, right posterior cingulate gyrus, and right entorhinal, but significantly lower measures of segregation in the left superior parietal, left pars orbitalis, right postcentral, right temporal pole, and right thalamus. FES High had significantly lower path length in the left pericalcarine, but higher path length in the right superior temporal compared to FES Low. FES High had significantly higher measures of centrality in the left pericalcarine, left supramarginal, left transverse temporal, left pars orbitalis, and right caudal anterior cingulate, but lower measures of centrality in the right caudal middle frontal compared to FES Low (Supplementary Table 5).
4. Discussion
To the best of our knowledge, this is the first study to investigate the multivariate relationships of cytokines, brain morphology, and clinical measures by inflammatory subtypes in an antipsychotic-naïve FES population (Bishop et al., 2021). A strength of the current study, is that it replicates inflammatory subtypes and the neuroanatomical findings from our previous work (Lizano et al., 2020b). Additionally, we re-analyzed peripheral marker data from our prior study, where we did not identify FES to HC differences (Lizano et al., 2016), to demonstrate that subtypes of inflammation exist in FES, which is in line with prior literature in chronic course psychosis (Cai et al., 2020; Fillman et al., 2016; Martinuzzi et al., 2019; Perkins et al., 2015). By analyzing a panel of 12 peripheral inflammatory markers via PC analysis and hierarchical clustering, 36% of FES were classified in the elevated inflammatory subtype, which was consistent with the prevalence rate previously reported using peripheral mRNA, postmortem, and blood cytokine levels (Boerrigter et al., 2017; Fillman et al., 2016, 2013; Lizano et al., 2020b). Peripheral marker signatures were related to neuroanatomical abnormalities with the high inflammation subtype displaying greater thickness in the right parahippocampal, right bank superior sulcus, and right caudal anterior cingulate compared to individuals in the low inflammation subtype, while the low inflammation subtype demonstrated pronounced reductions in bilateral amygdala and widespread cortical regions compared to HCs. The FES High group had greater centrality and a mix of high and low segregation and integration compared to the FES Low group. While associations were identified between cytokines or PCs with clinical measures, there were no significant subtype differences for any of the clinical measures examined, which is consistent with our previous report (Lizano et al., 2020b). The present findings support the presence of inflammatory subtypes in antipsychotic-naïve FES with neuroanatomical disruptions that may be explained by disruptions in the BBB. Future independent replications are warranted to confirm this proof of concept as well as test for preferential benefits from anti-inflammatory treatments in these subtypes.
Compared to our previous study (Lizano et al., 2020b), this replicated investigation had a smaller sample size of HCs so we were not able to perform subtyping in this group. This study also utilized a different set of PC than our previous report, and further elucidation is in the supplementary text. Moreover, several neuroanatomical regions overlapped with the findings in our previous study: 1) greater right parahippocampal thickness in the Proband High vs Proband Low group; the lower thickness in the bilateral insula, left caudal middle frontal, right pars triangularis, as well lower bilateral amygdala volume in the Proband Low vs HC group. Why these brain regions are particularly sensitive in both the FES and psychosis probands (schizophrenia, schizoaffective, and bipolar 1 disorder with psychosis) populations remains to be determined.
To expand upon our investigation of neuroanatomical alterations among FES High, FES Low, and HCs, we analyzed the topographic connectivity using graph theory using both global and nodal contexts. Globally, FES Low had significantly lower local efficiency across the 0.21–0.23 density range compared to the FES High group. The local efficiency result may be primarily driven by the left pericalcarine, right parahippocampal, and right posterior cingulate as these regions were reported to have lower nodal local efficiency in FES Low compared to the FES High group across similar density ranges. HCs were found to display a significantly higher assortativity coefficient across the 0.37–0.40 density range compared to the FES Low group. Since assortativity measures correlation between all nodal degrees, positive assortativity, like in the HC group, suggest the presence of a resilient core of mutually interconnected high-degree hubs. However, the low assortativity in the FES Low group suggests the presence of widely distributed and vulnerable high-degree hubs.
For the constructed measures of segregation, integration, and centrality, overall, there are more regions with altered measures of segregation and fewer regions with altered measures of integration across all group comparisons. Particularly, there are two vulnerable regions that displayed significant alterations across three measures: left pericalcarine and right caudate. The pericalcarine is located in the occipital lobe where the primary visual cortex (V1) is concentrated and cortical visual processing begins (Bedny et al., 2012). The Enhancing Neuro Imaging Genetics Through Meta-Analysis (ENIGMA) study of 4474 schizophrenia patients and 5098 controls reported that the schizophrenia cohort exhibited significantly thinner cortex in all brain regions, except for the bilateral pericalcarine region (van Erp et al., 2018). Similar to this study, we did not find cortical thickness differences in the pericalcarine across group comparisons, but we found that this region in FES High had higher segregation and centrality network properties and lower path length than FES Low and HCs. This suggests that the left pericalcarine is a visual hub with the ability to process information within local circuits and stronger potential for integrating information from various visual sources in FES High. Moreover, visual cortex morphology is also influenced by systemic inflammation via brain microstructural and/or BBB changes (Pong et al., 2020). Animal studies of maternal inflammation have identified significant changes in neuronal, morphological, and electrophysiological properties of the primary visual cortex in the exposed offspring (Gao et al., 2015). In healthy individuals, systemic inflammation resulted in a rapid change in striate (V1) microstructure (Harrison et al., 2015). Also, there is ample evidence suggesting that peripheral inflammatory markers are associated with both psychosis (e.g. IL-1β, IL-6, TNFα, and CRP) (Fernandes et al., 2016; Goldsmith et al., 2016; Lizano et al., 2016) and brain structural alterations (Cannon et al., 2015), which may be in part due to BBB disruption (Cai et al., 2018). Additional support for BBB disruption in the visual cortex comes from evidence of vascular degeneration of endothelial cells and astroglial processes in post-mortem schizophrenia brains (Uranova et al., 2010). Furthermore, visual cortical alterations may result from systemic inflammation as opposed to neuroinflammatory processes, which is supported by the absence of differences in glial density (Rajkowska et al., 1998; Selemon et al., 1995) and reduced microglial and astrocytic activity (Kurumaji et al., 1997) in the occipital cortex.
The second vulnerable region was the right caudate, which is a C-shaped subcortical structure located near the center of the brain, neighboring the thalamus (Driscoll et al., 2021). As part of the striatum, it plays a critical role in motivation, cognition, and sensorimotor coordination (Grahn et al., 2008). In FEP, the volume of the caudate did not significantly differ between patients and HCs (Crespo-Facorro et al., 2007; Scanlon et al., 2014). Similarly, we did not find significant differences in caudate volume across group comparisons, but we found that the right caudate in FES Low had lower segregation and path length but higher centrality network properties than FES High and HCs. This may indicate that the right caudate is a hub with a higher potential for combining information from distributed brain regions but has reduced capacity for specialized processing within nearby interconnected neuroanatomical regions in FES Low group. Prior research has shown the right caudate volume to be decreased in fetal exposure to IL-8 among schizophrenia cases but not controls (Ellman et al., 2010). The disruption in the balance between integration and segregation in both the left pericalcarine and right caudate may lead to less optimal connectivity in their membered networks, and thus, influenced the networks’ functions and contribute to the development of psychosis. The less optimal topological organization may also underlie the progression that inflammation may inflict, thus impacting brain regions in each group, and further investigations are warranted to understand this underlying mechanism.
There were several overlapping neuroanatomical regions between the structural and network group comparisons. Compared to HCs, FES Low demonstrated a significant reduction in the left insula thickness, and this region also experienced lower path length (higher global efficiency) and higher centrality properties, suggesting enhanced nodal integration and centrality despite having a smaller insular thickness. In regions that showed a significant thickening by the FES High group compared to the FES Low group, the right caudal anterior cingulate showed higher measures of centrality and segregation, and the right parahippocampal thickness showed greater measures of segregation in the FES High group. These findings suggest that enlargement of brain regions was associated with greater nodal segregation and centrality. For further analyses on these structures, please refer to the supplementary text. Studies examining the association between functional connectivity and inflammation in psychosis remains limited. Recent studies in unmedicated people with bipolar disorder II identified that disrupted resting-state functional connectivity in the right precentral gyrus and right insula were inversely correlated with the levels of IL8 and IL6, respectively, suggesting that inflammation might play a role in functional network disruption (Chen et al., 2020; Tang et al., 2021). Future directions should utilize multimodal and multilayer connectome approaches to integrate structural and functional connectivity in the context of inflammation in prodromal psychosis populations to enhance our understanding of the causal role of inflammation in psychosis.
The absence of observed relationships between inflammatory subtypes and cognition or clinical symptoms may suggest that neuroanatomical features may be more sensitive to alterations in an inflammatory response in the earlier stage of disease pathology and/ or that neuroinflammation may be one potential mechanism in psychosis. Additionally, the presence of PC1+PC4 correlations to clinical measures in the FES Low subtype, but not in the FES High subtype may mean that lower loading on this variable was associated with better functioning, including the improvement in GAF, in FES Low, but not in FES High.
The findings from this study can be examined through the lens of BBB properties. For example, the BBB is a dynamic system, created by endothelial cells that form the walls of the capillaries during fetal life and is well-formed by birth. Under normal conditions, the BBB restricts the entry of most blood-derived factors into the brain, which is necessary for proper neuronal development and homeostasis (Abbott et al., 2010). In response to endogenous and exogenous invasions, microglia, or resident immune cells of the central nervous system, are activated and initiate neuroinflammation (Kettenmann et al., 2011). Consequently, peripheral inflammation may induce BBB disruption and increase permeability, which allows for fluid to pass through the barrier and subsequently impact brain volume and thickness (Kelly et al., 2021; Pasternak et al., 2009). This plausible mechanism is applicable to the thickening observed in the FES High group and significant thinning in the FES Low group, where low levels of peripheral inflammation may not affect the BBB, resulting in gray matter loss. However, it is important to note that others have found opposite relationships to our own, including high inflammation subtypes being associated with lower pars opercularis volume (Fillman et al., 2016). This discrepancy could be due to the fact that volume is comprised of thickness and surface area, and in this work, we primarily report on thickness measures since they are generally associated with neurodegenerative changes.
Limitations
The present study has some limitations that require consideration when interpreting the results. These include small sample size, cross-sectional data, unavailable data on CRP, a strong marker of inflammation in FEP (Steiner et al., 2020) or tight junction proteins (such as CLDN5, OCLN, ZO1), absence of a validation sample, and unavailable data on potentially confounding factors (storage days, sample set, hemolysis score, autoimmune antibody levels, exposure to infectious agents, smoking, body mass index, medical comorbidities, trauma, depression, anxiety, sleep-related issues, and status of prior substance use) (de Jager et al., 2009; Leng et al., 2008; Raghava et al., 2021). Furthermore, as HCs were not categorized based on their inflammatory profiles, we could not conclude that elevated inflammation is a unique characteristic of FES, thereby is involved in the pathology of FES. Regarding brain connectivity analyses, many graph-theoretic measures were developed to study non-biological complex systems and have since been adapted to neuroscientific ends. These measures had demonstrated behavioral and/ or clinical significance in schizophrenia (Bassett et al., 2008; Lynall et al., 2010; Zalesky et al., 2011) but the development of novel, neurobiologically principled measures that more accurately capture the dynamics of information processing throughout the brain network will be an important avenue of future work (Fornito et al., 2013).
Supplementary Material
Highlights.
36% of first episode schizophrenia patients were in the high inflammation subtype
The high inflammation subtype exhibited greater cortical thickness compared to the low inflammation subtype
The low inflammation subtype had lower cortical and subcortical measures compared to controls
Global and nodal network topological differences were found between subtypes and controls
Individual cytokines and inflammatory signatures were associated with cognition and symptom measures
Acknowledgment
The authors thank the participants and families who took part in this study, Jean Miewald and Deborah Montrose for collecting data, and the late Prof. Jeffrey Yao PhD.
This study was supported by National Institutes of Health (NIH) [Grants MH45156 (MK), MH45203 (MK), MH64023 (MK), MH58141 (JY), KO2 MH 01180 (MK), c UL1 RR024153], the NIH/National Center for Research Resources (NCRR)/General Clinical Research Centers Grant M01 RR00056, Department of Veterans Affairs (Merit Reviews and Senior Research Career Scientist Award), the VA Pittsburgh Healthcare System, Harvard Catalyst, The Harvard Clinical and Translational Science Center, and Harvard University and its affiliated academic healthcare centers.
Footnotes
Conflict of interest
There is no conflict of interest concerning the authors in conducting this study and preparing the manuscript.
Publisher's Disclaimer: This is a PDF file of an unedited manuscript that has been accepted for publication. As a service to our customers we are providing this early version of the manuscript. The manuscript will undergo copyediting, typesetting, and review of the resulting proof before it is published in its final form. Please note that during the production process errors may be discovered which could affect the content, and all legal disclaimers that apply to the journal pertain.
References
- Abbott NJ, Patabendige AAK, Dolman DEM, Yusof SR, Begley DJ, 2010. Structure and function of the blood–brain barrier. Neurobiol. Dis., Special Issue: Blood Brain Barrier 37, 13–25. 10.1016/j.nbd.2009.07.030 [DOI] [PubMed] [Google Scholar]
- Andreasen NC, 1990. Methods for assessing positive and negative symptoms, in: Schizophrenia: Positive and Negative Symptoms and Syndromes, Modern Problems of Pharmacopsychiatry, Vol. 24. Karger, Basel, Switzerland, pp. 73–88. [DOI] [PubMed] [Google Scholar]
- Balusu S, Van Wonterghem E, De Rycke R, Raemdonck K, Stremersch S, Gevaert K, Brkic M, Demeestere D, Vanhooren V, Hendrix A, Libert C, Vandenbroucke RE, 2016. Identification of a novel mechanism of blood-brain communication during peripheral inflammation via choroid plexus-derived extracellular vesicles. EMBO Mol. Med. 8, 1162–1183. 10.15252/emmm.201606271 [DOI] [PMC free article] [PubMed] [Google Scholar]
- Barbosa S, Martinuzzi E, Sommer IE, Dazzan P, McGuire P, Arango C, Diaz-Caneja CM, Fleischhacker WW, Rujescu D, Glenthøj B, Winter-van Rossum I, Kahn RS, Yolken R, Lewis S, Drake R, Leucht S, Gilet C, Khalfallah O, Davidovic L, Ibrahim EC, Belzeaux R, Leboyer M, Glaichenhaus N, OPTiMiSE Study Group, 2021. Baseline Levels of C-Reactive Protein and Proinflammatory Cytokines Are Not Associated With Early Response to Amisulpride in Patients With First Episode Psychosis: The OPTiMiSE Cohort Study. Schizophr. Bull. Open 2. 10.1093/schizbullopen/sgab017 [DOI] [Google Scholar]
- Bassett DS, Bullmore E, Verchinski BA, Mattay VS, Weinberger DR, Meyer-Lindenberg A, 2008. Hierarchical organization of human cortical networks in health and schizophrenia. J. Neurosci. Off. J. Soc. Neurosci. 28, 9239–9248. 10.1523/JNEUROSCI.1929-08.2008 [DOI] [PMC free article] [PubMed] [Google Scholar]
- Bedny M, Pascual-Leone A, Dravida S, Saxe R, 2012. A sensitive period for language in the visual cortex: Distinct patterns of plasticity in congenitally versus late blind adults. Brain Lang. 122, 162–170. 10.1016/j.bandl.2011.10.005 [DOI] [PMC free article] [PubMed] [Google Scholar]
- Bell CC, 1994. DSM-IV: Diagnostic and Statistical Manual of Mental Disorders. JAMA 272, 828–829. 10.1001/jama.1994.03520100096046 [DOI] [Google Scholar]
- Benjamini Y, Hochberg Y, 1995. Controlling the False Discovery Rate: A Practical and Powerful Approach to Multiple Testing. J. R. Stat. Soc. Ser. B Methodol. 57, 289–300. [Google Scholar]
- Bishop J, Zhang L, Lizano P, 2021. Inflammation subtypes and translating inflammation-related genetic findings in schizophrenia and related psychoses: a perspective on pathways for treatment stratification and novel therapies. Harv. Rev. Psychiatry. 10.1097/HRP.0000000000000321 [DOI] [PMC free article] [PubMed] [Google Scholar]
- Boerrigter D, Weickert TW, Lenroot R, O’Donnell M, Galletly C, Liu D, Burgess M, Cadiz R, Jacomb I, Catts VS, Fillman SG, Weickert CS, 2017. Using blood cytokine measures to define high inflammatory biotype of schizophrenia and schizoaffective disorder. J. Neuroinflammation 14, 188. 10.1186/s12974-017-0962-y [DOI] [PMC free article] [PubMed] [Google Scholar]
- Bollobás B, Thomason A, 1985. Random Graphs of Small Order, in: Karoński M, Ruciński A (Eds.), North-Holland Mathematics Studies, Random Graphs ‘83. North-Holland, pp. 47–97. 10.1016/S0304-0208(08)73612-0 [DOI] [Google Scholar]
- Brown S, Birtwistle J, Roe L, Thompson C, 1999. The unhealthy lifestyle of people with schizophrenia. Psychol. Med. 29, 697–701. 10.1017/s0033291798008186 [DOI] [PubMed] [Google Scholar]
- Buchanan RW, Heinrichs DW, 1989. The Neurological Evaluation Scale (NES): a structured instrument for the assessment of neurological signs in schizophrenia. Psychiatry Res. 27, 335–350. 10.1016/0165-1781(89)90148-0 [DOI] [PubMed] [Google Scholar]
- Buckley PF, 2019. Neuroinflammation and Schizophrenia. Curr. Psychiatry Rep. 21, 72. 10.1007/s11920-019-1050-z [DOI] [PubMed] [Google Scholar]
- Cai HQ, Catts VS, Webster MJ, Galletly C, Liu D, O’Donnell M, Weickert TW, Weickert CS, 2020. Increased macrophages and changed brain endothelial cell gene expression in the frontal cortex of people with schizophrenia displaying inflammation. Mol. Psychiatry 25, 761–775. 10.1038/s41380-018-0235-x [DOI] [PMC free article] [PubMed] [Google Scholar]
- Cai HQ, Catts VS, Webster MJ, Galletly C, Liu D, O’Donnell M, Weickert TW, Weickert CS, 2018. Increased macrophages and changed brain endothelial cell gene expression in the frontal cortex of people with schizophrenia displaying inflammation. Mol. Psychiatry 25, 761–775. 10.1038/s41380-018-0235-x [DOI] [PMC free article] [PubMed] [Google Scholar]
- Cannon TD, Chung Y, He G, Sun D, Jacobson A, van Erp TGM, McEwen S, Addington J, Bearden CE, Cadenhead K, Cornblatt B, Mathalon DH, McGlashan T, Perkins D, Jeffries C, Seidman LJ, Tsuang M, Walker E, Woods SW, Heinssen R, North American Prodrome Longitudinal Study Consortium, 2015. Progressive reduction in cortical thickness as psychosis develops: a multisite longitudinal neuroimaging study of youth at elevated clinical risk. Biol. Psychiatry 77, 147–57. 10.1016/j.biopsych.2014.05.023 [DOI] [PMC free article] [PubMed] [Google Scholar]
- Catts VS, Wong J, Fillman SG, Fung SJ, Shannon Weickert C, 2014. Increased expression of astrocyte markers in schizophrenia: Association with neuroinflammation. Aust. N. Z. J. Psychiatry 48, 722–734. 10.1177/0004867414531078 [DOI] [PubMed] [Google Scholar]
- Chen P, Chen F, Chen G, Zhong S, Gong J, Zhong H, Ye T, Tang G, Wang J, Luo Z, Qi Z, Jia Y, Yang H, Yin Z, Huang L, Wang Y, 2020. Inflammation is associated with decreased functional connectivity of insula in unmedicated bipolar disorder. Brain. Behav. Immun. 89, 615–622. 10.1016/j.bbi.2020.07.004 [DOI] [PubMed] [Google Scholar]
- Crespo-Facorro B, Roiz-Santiáñez R, Pelayo-Terán JM, González-Blanch C, Pérez-Iglesias R, Gutiérrez A, de Lucas EM, Tordesillas D, Vázquez-Barquero JL, 2007. Caudate nucleus volume and its clinical and cognitive correlations in first episode schizophrenia. Schizophr. Res. 91, 87–96. 10.1016/j.schres.2006.12.015 [DOI] [PubMed] [Google Scholar]
- de Jager W, Bourcier K, Rijkers GT, Prakken BJ, Seyfert-Margolis V, 2009. Prerequisites for cytokine measurements in clinical trials with multiplex immunoassays. BMC Immunol. 10, 52. 10.1186/1471-2172-10-52 [DOI] [PMC free article] [PubMed] [Google Scholar]
- Desikan RS, Ségonne F, Fischl B, Quinn BT, Dickerson BC, Blacker D, Buckner RL, Dale AM, Maguire RP, Hyman BT, Albert MS, Killiany RJ, 2006. An automated labeling system for subdividing the human cerebral cortex on MRI scans into gyral based regions of interest. NeuroImage 31, 968–980. 10.1016/j.neuroimage.2006.01.021 [DOI] [PubMed] [Google Scholar]
- Dickerson F, Stallings C, Origoni A, Boronow J, Yolken R, 2007. C-reactive protein is associated with the severity of cognitive impairment but not of psychiatric symptoms in individuals with schizophrenia. Schizophr. Res. 93, 261–265. 10.1016/j.schres.2007.03.022 [DOI] [PubMed] [Google Scholar]
- Driscoll ME, Bollu PC, Tadi P, 2021. Neuroanatomy, Nucleus Caudate, in: StatPearls. StatPearls Publishing, Treasure Island (FL). [PubMed] [Google Scholar]
- Ellman LM, Deicken RF, Vinogradov S, Kremen WS, Poole JH, Kern DM, Tsai WY, Schaefer CA, Brown AS, 2010. Structural brain alterations in schizophrenia following fetal exposure to the inflammatory cytokine interleukin-8. Schizophr. Res. 121, 46–54. 10.1016/j.schres.2010.05.014 [DOI] [PMC free article] [PubMed] [Google Scholar]
- Endicott J, Spitzer RL, Fleiss JL, Cohen J, 1976. The Global Assessment Scale: A Procedure for Measuring Overall Severity of Psychiatric Disturbance. Arch. Gen. Psychiatry 33, 766–771. 10.1001/archpsyc.1976.01770060086012 [DOI] [PubMed] [Google Scholar]
- Fernandes BS, Steiner J, Bernstein H-G, Dodd S, Pasco JA, Dean OM, Nardin P, Gonçalves C-A, Berk M, 2016. C-reactive protein is increased in schizophrenia but is not altered by antipsychotics: meta-analysis and implications. Mol. Psychiatry 21, 554–564. 10.1038/mp.2015.87 [DOI] [PubMed] [Google Scholar]
- Ferrante AW, 2007. Obesity-induced inflammation: a metabolic dialogue in the language of inflammation. J. Intern. Med. 262, 408–414. 10.1111/j.1365-2796.2007.01852.x [DOI] [PubMed] [Google Scholar]
- Fillman SG, Cloonan N, Catts VS, Miller LC, Wong J, McCrossin T, Cairns M, Weickert CS, 2013. Increased inflammatory markers identified in the dorsolateral prefrontal cortex of individuals with schizophrenia. Mol. Psychiatry 18, 206–214. 10.1038/mp.2012.110 [DOI] [PubMed] [Google Scholar]
- Fillman SG, Sinclair D, Fung SJ, Webster MJ, Shannon Weickert C, 2014. Markers of inflammation and stress distinguish subsets of individuals with schizophrenia and bipolar disorder. Transl. Psychiatry 4, e365–e365. 10.1038/tp.2014.8 [DOI] [PMC free article] [PubMed] [Google Scholar]
- Fillman SG, Weickert TW, Lenroot RK, Catts SV, Bruggemann JM, Catts VS, Weickert CS, 2016. Elevated peripheral cytokines characterize a subgroup of people with schizophrenia displaying poor verbal fluency and reduced Broca’s area volume. Mol. Psychiatry 21, 1090–1098. 10.1038/mp.2015.90 [DOI] [PMC free article] [PubMed] [Google Scholar]
- Fornito A, Zalesky A, Breakspear M, 2013. Graph analysis of the human connectome: promise, progress, and pitfalls. NeuroImage 80, 426–444. 10.1016/j.neuroimage.2013.04.087 [DOI] [PubMed] [Google Scholar]
- Fornito A, Zalesky A, Pantelis C, Bullmore ET, 2012. Schizophrenia, neuroimaging and connectomics. NeuroImage 62, 2296–2314. 10.1016/j.neuroimage.2011.12.090 [DOI] [PubMed] [Google Scholar]
- Gao Y, Liu L, Li Q, Wang Y, 2015. Differential alterations in the morphology and electrophysiology of layer II pyramidal cells in the primary visual cortex of a mouse model prenatally exposed to LPS. Neurosci. Lett. 591, 138–143. 10.1016/j.neulet.2015.02.043 [DOI] [PubMed] [Google Scholar]
- Goff DC, Zeng B, Ardekani BA, Diminich ED, Tang Y, Fan X, Galatzer-Levy I, Li C, Troxel AB, Wang J, 2018. Association of Hippocampal Atrophy With Duration of Untreated Psychosis and Molecular Biomarkers During Initial Antipsychotic Treatment of First-Episode Psychosis. JAMA Psychiatry 75, 370–378. 10.1001/jamapsychiatry.2017.4595 [DOI] [PMC free article] [PubMed] [Google Scholar]
- Goldsmith DR, Rapaport MH, Miller BJ, 2016. A meta-analysis of blood cytokine network alterations in psychiatric patients: comparisons between schizophrenia, bipolar disorder and depression. Mol. Psychiatry 21, 1696–1709. 10.1038/mp.2016.3 [DOI] [PMC free article] [PubMed] [Google Scholar]
- Grahn JA, Parkinson JA, Owen AM, 2008. The cognitive functions of the caudate nucleus. Prog. Neurobiol. 86, 141–155. 10.1016/j.pneurobio.2008.09.004 [DOI] [PubMed] [Google Scholar]
- Hamilton M, 1960. A rating scale for depression. J. Neurol. Neurosurg. Psychiatry 23, 56–62. 10.1136/jnnp.23.1.56 [DOI] [PMC free article] [PubMed] [Google Scholar]
- Haro JM, Kamath SA, Ochoa S, Novick D, Rele K, Fargas A, Rodríguez MJ, Rele R, Orta J, Kharbeng A, Araya S, Gervin M, Alonso J, Mavreas V, Lavrentzou E, Liontos N, Gregor K, Jones PB, 2003. The Clinical Global Impression–Schizophrenia scale: a simple instrument to measure the diversity of symptoms present in schizophrenia. Acta Psychiatr. Scand. 107, 16–23. 10.1034/j.1600-0447.107.s416.5.x [DOI] [PubMed] [Google Scholar]
- Harrison NA, Cooper E, Dowell NG, Keramida G, Voon V, Critchley HD, Cercignani M, 2015. Quantitative magnetization transfer imaging as a biomarker for effects of Systemic inflammation on the brain. Biol. Psychiatry 78, 49–57. 10.1016/j.biopsych.2014.09.023 [DOI] [PMC free article] [PubMed] [Google Scholar]
- Hoang D, Lizano P, Lutz O, Zeng V, Raymond N, Miewald J, Montrose D, Keshavan M, 2021. Thalamic, Amygdalar, and hippocampal nuclei morphology and their trajectories in first episode psychosis: A preliminary longitudinal study✰. Psychiatry Res. Neuroimaging 309, 111249. 10.1016/j.pscychresns.2021.111249 [DOI] [PMC free article] [PubMed] [Google Scholar]
- Hollingshead Four-Factor Index of Socioeconomic Status (SES-Child) — Nathan Kline Institute - Rockland Sample documentation [WWW Document], 1975. URL http://fcon_1000.projects.nitrc.org/indi/enhanced/assessments/ses-child.html (accessed 3.12.21).
- Kelly S, Guimond S, Pasternak O, Lutz O, Lizano P, Cetin-Karayumak S, Sweeney JA, Pearlson G, Clementz BA, McDowell JE, Tamminga CA, Shenton ME, Keshavan MS, 2021. White matter microstructure across brain-based biotypes for psychosis - findings from the bipolar-schizophrenia network for intermediate phenotypes. Psychiatry Res. Neuroimaging 308, 111234. 10.1016/j.pscychresns.2020.111234 [DOI] [PubMed] [Google Scholar]
- Keshavan MS, Sanders RD, Sweeney JA, Diwadkar VA, Goldstein G, Pettegrew JW, Schooler NR, 2003. Diagnostic Specificity and Neuroanatomical Validity of Neurological Abnormalities in First-Episode Psychoses. Am. J. Psychiatry 160, 1298–1304. 10.1176/appi.ajp.160.7.1298 [DOI] [PubMed] [Google Scholar]
- Kettenmann H, Hanisch U-K, Noda M, Verkhratsky A, 2011. Physiology of Microglia. Physiol. Rev. 91, 461–553. 10.1152/physrev.00011.2010 [DOI] [PubMed] [Google Scholar]
- Kongs SK, Thompson LL, Iverson GL, Heaton RK, 2000. WCST-64: Wisconsin Card Sorting Test-64 Card Version. Prof. Man. Psychol. Assess. Resour. Odessa FL. [Google Scholar]
- Kurumaji A, Wakai T, Toru M, 1997. Decreases in peripheral-type benzodiazepine receptors in postmortem brains of chronic schizophrenics. J. Neural Transm. 104, 1361–1370. 10.1007/BF01294737 [DOI] [PubMed] [Google Scholar]
- Leng SX, McElhaney JE, Walston JD, Xie D, Fedarko NS, Kuchel GA, 2008. ELISA and multiplex technologies for cytokine measurement in inflammation and aging research. J. Gerontol. A. Biol. Sci. Med. Sci. 63, 879–884. 10.1093/gerona/63.8.879 [DOI] [PMC free article] [PubMed] [Google Scholar]
- Lizano P, Dhaliwal K, Lutz O, Mothi SS, Miewald J, Montrose D, Keshavan M, 2020a. Trajectory of neurological examination abnormalities in antipsychotic-naïve first-episode psychosis population: a 1 year follow-up study. Psychol. Med. 50, 2057–2065. 10.1017/S0033291719002162 [DOI] [PubMed] [Google Scholar]
- Lizano P, Keshavan MS, Tandon N, Mathew IT, Mothi SS, Montrose DM, Yao JK, 2016. Angiogenic and immune signatures in plasma of young relatives at familial high-risk for psychosis and first-episode patients: A preliminary study. Schizophr. Res. 170, 115–122. 10.1016/j.schres.2015.12.001 [DOI] [PMC free article] [PubMed] [Google Scholar]
- Lizano P, Lutz O, Ling G, Lee AM, Eum S, Bishop JR, Kelly S, Pasternak O, Clementz B, Pearlson G, Sweeney JA, Gershon E, Tamminga C, Keshavan M, 2019. Association of Choroid Plexus Enlargement With Cognitive, Inflammatory, and Structural Phenotypes Across the Psychosis Spectrum. Am. J. Psychiatry 176, 564–572. 10.1176/appi.ajp.2019.18070825 [DOI] [PMC free article] [PubMed] [Google Scholar]
- Lizano P, Lutz O, Xu Y, Rubin LH, Paskowitz L, Lee AM, Eum S, Keedy SK, Hill SK, Reilly JL, Wu B, Tamminga CA, Clementz BA, Pearlson GD, Gershon ES, Keshavan MS, Sweeney JA, Bishop JR, 2020b. Multivariate relationships between peripheral inflammatory marker subtypes and cognitive and brain structural measures in psychosis. Mol. Psychiatry 1–14. 10.1038/s41380-020-00914-0 [DOI] [PMC free article] [PubMed] [Google Scholar]
- Lynall M-E, Bassett DS, Kerwin R, McKenna PJ, Kitzbichler M, Muller U, Bullmore E, 2010. Functional connectivity and brain networks in schizophrenia. J. Neurosci. Off. J. Soc. Neurosci. 30, 9477–9487. 10.1523/JNEUROSCI.0333-10.2010 [DOI] [PMC free article] [PubMed] [Google Scholar]
- Martinuzzi E, Barbosa S, Daoudlarian D, Bel Haj Ali W, Gilet C, Fillatre L, Khalfallah O, Troudet R, Jamain S, Fond G, Sommer I, Leucht S, Dazzan P, McGuire P, Arango C, Diaz-Caneja CM, Fleischhacker W, Rujescu D, Glenthøj B, Winter I, Kahn RS, Yolken R, Lewis S, Drake R, Davidovic L, Leboyer M, Glaichenhaus N, OPTiMiSE Study Group, 2019. Stratification and prediction of remission in first-episode psychosis patients: the OPTiMiSE cohort study. Transl. Psychiatry 9, 20. 10.1038/s41398-018-0366-5 [DOI] [PMC free article] [PubMed] [Google Scholar]
- Mijalkov M, Kakaei E, Pereira JB, Westman E, Volpe G, Alzheimer’s Disease Neuroimaging Initiative, 2017. BRAPH: A graph theory software for the analysis of brain connectivity. PloS One 12, e0178798. 10.1371/journal.pone.0178798 [DOI] [PMC free article] [PubMed] [Google Scholar]
- Mondelli V, Ciufolini S, Belvederi Murri M, Bonaccorso S, Di Forti M, Giordano A, Marques TR, Zunszain PA, Morgan C, Murray RM, Pariante CM, Dazzan P, 2015. Cortisol and Inflammatory Biomarkers Predict Poor Treatment Response in First Episode Psychosis. Schizophr. Bull. 41, 1162–1170. 10.1093/schbul/sbv028 [DOI] [PMC free article] [PubMed] [Google Scholar]
- Monji A, Kato T, Kanba S, 2009. Cytokines and schizophrenia: Microglia hypothesis of schizophrenia. Psychiatry Clin. Neurosci. 63, 257–265. 10.1111/j.1440-1819.2009.01945.x [DOI] [PubMed] [Google Scholar]
- Oldfield RC, 1971. The assessment and analysis of handedness: The Edinburgh inventory. Neuropsychologia 9, 97–113. 10.1016/0028-3932(71)90067-4 [DOI] [PubMed] [Google Scholar]
- Overall JE, Gorham DR, 1962. The Brief Psychiatric Rating Scale. Psychol. Rep. 10, 799–812. 10.2466/pr0.1962.10.3.799 [DOI] [Google Scholar]
- Pasternak O, Sochen N, Gur Y, Intrator N, Assaf Y, 2009. Free water elimination and mapping from diffusion MRI. Magn. Reson. Med. 62, 717–730. 10.1002/mrm.22055 [DOI] [PubMed] [Google Scholar]
- Perkins DO, Jeffries CD, Addington J, Bearden CE, Cadenhead KS, Cannon TD, Cornblatt BA, Mathalon DH, McGlashan TH, Seidman LJ, Tsuang MT, Walker EF, Woods SW, Heinssen R, 2015. Towards a psychosis risk blood diagnostic for persons experiencing high-risk symptoms: preliminary results from the NAPLS project. Schizophr. Bull. 41, 419–428. 10.1093/schbul/sbu099 [DOI] [PMC free article] [PubMed] [Google Scholar]
- Pillai A, Howell KR, Ahmed AO, Weinberg D, Allen KM, Bruggemann J, Lenroot R, Liu D, Galletly C, Weickert CS, Weickert TW, 2016. Association of serum VEGF levels with prefrontal cortex volume in schizophrenia. Mol. Psychiatry 21, 686–692. 10.1038/mp.2015.96 [DOI] [PubMed] [Google Scholar]
- Pillinger T, Osimo EF, Brugger S, Mondelli V, McCutcheon RA, Howes OD, 2019. A Meta-analysis of Immune Parameters, Variability, and Assessment of Modal Distribution in Psychosis and Test of the Immune Subgroup Hypothesis. Schizophr. Bull 45, 1120–1133. 10.1093/schbul/sby160 [DOI] [PMC free article] [PubMed] [Google Scholar]
- Pollmächer T, Haack M, Schuld A, Kraus T, Hinze-Selch D, 2000. Effects of antipsychotic drugs on cytokine networks. J. Psychiatr. Res. 34, 369–382. 10.1016/s0022-3956(00)00032-7 [DOI] [PubMed] [Google Scholar]
- Pong S, Karmacharya R, Sofman M, Bishop JR, Lizano P, 2020. The Role of Brain Microvascular Endothelial Cell and Blood-Brain Barrier Dysfunction in Schizophrenia. Complex Psychiatry 6, 30–46. 10.1159/000511552 [DOI] [PMC free article] [PubMed] [Google Scholar]
- Raghava JM, Mandl RCW, Nielsen MØ, Fagerlund B, Glenthøj BY, Rostrup E, Ebdrup BH, 2021. Multimodal assessment of white matter microstructure in antipsychotic-naïve schizophrenia patients and confounding effects of recreational drug use. Brain Imaging Behav. 15, 36–48. 10.1007/s11682-019-00230-4 [DOI] [PubMed] [Google Scholar]
- Raison CL, Rutherford RE, Woolwine BJ, Shuo C, Schettler P, Drake DF, Haroon E, Miller AH, 2013. A randomized controlled trial of the tumor necrosis factor antagonist infliximab for treatment-resistant depression: the role of baseline inflammatory biomarkers. JAMA Psychiatry 70, 31–41. 10.1001/2013.jamapsychiatry.4 [DOI] [PMC free article] [PubMed] [Google Scholar]
- Rajkowska G, Selemon LD, Goldman-Rakic PS, 1998. Neuronal and glial somal size in the prefrontal cortex: A postmortem morphometric study of schizophrenia and Huntington disease. Arch. Gen. Psychiatry 55, 215–224. 10.1001/archpsyc.55.3.215 [DOI] [PubMed] [Google Scholar]
- Rubinov M, Bullmore, Ed., 2013. Schizophrenia and abnormal brain network hubs. Dialogues Clin. Neurosci. 15, 339–349. [DOI] [PMC free article] [PubMed] [Google Scholar]
- Scanlon C, Anderson-Schmidt H, Kilmartin L, McInerney S, Kenney J, McFarland J, Waldron M, Ambati S, Fullard A, Logan S, Hallahan B, Barker GJ, Elliott MA, McCarthy P, Cannon DM, McDonald C, 2014. Cortical thinning and caudate abnormalities in first episode psychosis and their association with clinical outcome. Schizophr. Res. 159, 36–42. 10.1016/j.schres.2014.07.030 [DOI] [PubMed] [Google Scholar]
- Selemon LD, Rajkowska G, Goldman-Rakic PS, 1995. Abnormally High Neuronal Density in the Schizophrenic Cortex: A Morphometric Analysis of Prefrontal Area 9 and Occipital Area 17. Arch. Gen. Psychiatry 52, 805–818. 10.1001/archpsyc.1995.03950220015005 [DOI] [PubMed] [Google Scholar]
- Sheffield JM, Kandala S, Tamminga CA, Pearlson GD, Keshavan MS, Sweeney JA, Clementz BA, Lerman-Sinkoff DB, Hill SK, Barch DM, 2017. Transdiagnostic Associations Between Functional Brain Network Integrity and Cognition. JAMA Psychiatry 74, 605–613. 10.1001/jamapsychiatry.2017.0669 [DOI] [PMC free article] [PubMed] [Google Scholar]
- Steiner J, Frodl T, Schiltz K, Dobrowolny H, Jacobs R, Fernandes BS, Guest PC, Meyer-Lotz G, Borucki K, Bahn S, Bogerts B, Falkai P, Bernstein H-G, 2020. Innate Immune Cells and C-Reactive Protein in Acute First-Episode Psychosis and Schizophrenia: Relationship to Psychopathology and Treatment. Schizophr. Bull. 46, 363–373. 10.1093/schbul/sbz068 [DOI] [PMC free article] [PubMed] [Google Scholar]
- Stubbs B, Firth J, Berry A, Schuch FB, Rosenbaum S, Gaughran F, Veronesse N, Williams J, Craig T, Yung AR, Vancampfort D, 2016. How much physical activity do people with schizophrenia engage in? A systematic review, comparative meta-analysis and meta-regression. Schizophr. Res. 176, 431–440. 10.1016/j.schres.2016.05.017 [DOI] [PubMed] [Google Scholar]
- Tang G, Chen P, Chen G, Zhong S, Gong J, Zhong H, Ye T, Chen F, Wang J, Luo Z, Qi Z, Jia Y, Wang Y, Huang L, 2021. Inflammation is correlated with abnormal functional connectivity in unmedicated bipolar depression: an independent component analysis study of resting-state fMRI. Psychol. Med 1–11. 10.1017/S003329172100009X [DOI] [PubMed] [Google Scholar]
- Uranova NA, Zimina IS, Vikhreva OV, Krukov NO, Rachmanova VI, Orlovskaya DD, 2010. Ultrastructural damage of capillaries in the neocortex in schizophrenia. World J. Biol. Psychiatry 11, 567–578. 10.3109/15622970903414188 [DOI] [PubMed] [Google Scholar]
- van Erp TGM, Walton E, Hibar DP, Schmaal L, Jiang W, Glahn DC, Pearlson GD, Yao N, Fukunaga M, Hashimoto R, Okada N, Yamamori H, Bustillo JR, Clark VP, Agartz I, Mueller BA, Cahn W, de Zwarte SMC, Hulshoff Pol HE, Kahn RS, Ophoff RA, van Haren NEM, Andreassen OA, Dale AM, Doan NT, Gurholt TP, Hartberg CB, Haukvik UK, Jørgensen KN, Lagerberg TV, Melle I, Westlye LT, Gruber O, Kraemer B, Richter A, Zilles D, Calhoun VD, Crespo-Facorro B, Roiz-Santiañez R, Tordesillas-Gutiérrez D, Loughland C, Carr VJ, Catts S, Cropley VL, Fullerton JM, Green MJ, Henskens FA, Jablensky A, Lenroot RK, Mowry BJ, Michie PT, Pantelis C, Quidé Y, Schall U, Scott RJ, Cairns MJ, Seal M, Tooney PA, Rasser PE, Cooper G, Shannon Weickert C, Weickert TW, Morris DW, Hong E, Kochunov P, Beard LM, Gur RE, Gur RC, Satterthwaite TD, Wolf DH, Belger A, Brown GG, Ford JM, Macciardi F, Mathalon DH, O’Leary DS, Potkin SG, Preda A, Voyvodic J, Lim KO, McEwen S, Yang F, Tan Y, Tan S, Wang Z, Fan F, Chen J, Xiang H, Tang S, Guo H, Wan P, Wei D, Bockholt HJ, Ehrlich S, Wolthusen RPF, King MD, Shoemaker JM, Sponheim SR, De Haan L, Koenders L, Machielsen MW, van Amelsvoort T, Veltman DJ, Assogna F, Banaj N, de Rossi P, Iorio M, Piras F, Spalletta G, McKenna PJ, Pomarol-Clotet E, Salvador R, Corvin A, Donohoe G, Kelly S, Whelan CD, Dickie EW, Rotenberg D, Voineskos AN, Ciufolini S, Radua J, Dazzan P, Murray R, Reis Marques T, Simmons A, Borgwardt S, Egloff L, Harrisberger F, Riecher-Rössler A, Smieskova R, Alpert KI, Wang L, Jönsson EG, Koops S, Sommer IEC, Bertolino A, Bonvino A, Di Giorgio A, Neilson E, Mayer AR, Stephen JM, Kwon JS, Yun J-Y, Cannon DM, McDonald C, Lebedeva I, Tomyshev AS, Akhadov T, Kaleda V, Fatouros-Bergman H, Flyckt L, Karolinska Schizophrenia Project, Busatto GF, Rosa PGP, Serpa MH, Zanetti MV, Hoschl C, Skoch A, Spaniel F, Tomecek D, Hagenaars SP, McIntosh AM, Whalley HC, Lawrie SM, Knöchel C, Oertel-Knöchel V, Stäblein M, Howells FM, Stein DJ, Temmingh HS, Uhlmann A, Lopez-Jaramillo C, Dima D, McMahon A, Faskowitz JI, Gutman BA, Jahanshad N, Thompson PM, Turner JA, 2018. Cortical Brain Abnormalities in 4474 Individuals With Schizophrenia and 5098 Control Subjects via the Enhancing Neuro Imaging Genetics Through Meta Analysis (ENIGMA) Consortium . Biol. Psychiatry 84, 644–654. 10.1016/j.biopsych.2018.04.023 [DOI] [PMC free article] [PubMed] [Google Scholar]
- van Kesteren CFMG, Gremmels H, de Witte LD, Hol EM, Van Gool AR, Falkai PG, Kahn RS, Sommer IEC, 2017. Immune involvement in the pathogenesis of schizophrenia: a meta-analysis on postmortem brain studies. Transl. Psychiatry 7, e1075. 10.1038/tp.2017.4 [DOI] [PMC free article] [PubMed] [Google Scholar]
- Watts DJ, Strogatz SH, 1998. Collective dynamics of ‘small-world’ networks. Nature 393, 440–442. 10.1038/30918 [DOI] [PubMed] [Google Scholar]
- Weinberger JF, Raison CL, Rye DB, Montague AR, Woolwine BJ, Felger JC, Haroon E, Miller AH, 2015. Inhibition of tumor necrosis factor improves sleep continuity in patients with treatment resistant depression and high inflammation. Brain. Behav. Immun. 47, 193–200. 10.1016/j.bbi.2014.12.016 [DOI] [PMC free article] [PubMed] [Google Scholar]
- Zalesky A, Fornito A, Seal ML, Cocchi L, Westin C-F, Bullmore ET, Egan GF, Pantelis C, 2011. Disrupted axonal fiber connectivity in schizophrenia. Biol. Psychiatry 69, 80–89. 10.1016/j.biopsych.2010.08.022 [DOI] [PMC free article] [PubMed] [Google Scholar]
- Zhang R, Wei Q, Kang Z, Zalesky A, Li M, Xu Y, Li L, Wang J, Zheng L, Wang B, Zhao J, Zhang J, Huang R, 2015. Disrupted brain anatomical connectivity in medication-naïve patients with first-episode schizophrenia. Brain Struct. Funct. 220, 1145–1159. 10.1007/s00429-014-0706-z [DOI] [PubMed] [Google Scholar]
- Zhang W, Lei D, Keedy SK, Ivleva EI, Eum S, Yao L, Tamminga CA, Clementz BA, Keshavan MS, Pearlson GD, Gershon ES, Bishop JR, Gong Q, Lui S, Sweeney JA, 2020. Brain gray matter network organization in psychotic disorders. Neuropsychopharmacology 45, 666–674. 10.1038/s41386-019-0586-2 [DOI] [PMC free article] [PubMed] [Google Scholar]
- Zhang Y, Catts VS, Sheedy D, McCrossin T, Kril JJ, Shannon Weickert C, 2016. Cortical grey matter volume reduction in people with schizophrenia is associated with neuro-inflammation. Transl. Psychiatry 6, e982. 10.1038/tp.2016.238 [DOI] [PMC free article] [PubMed] [Google Scholar]
Associated Data
This section collects any data citations, data availability statements, or supplementary materials included in this article.