

Abstract
Purpose:
To assess the agreement of the root mean square of successive R-R interval (RMSSD) values when recorded immediately upon waking to values recorded later in the morning prior to practice, and to determine the associations of the RMSSD recordings with performance outcomes in female rowers.
Methods:
A total of 31 National Collegiate Athletic Association Division I rowers were monitored for 6 consecutive days. Two seated RMSSD measurements were obtained on at least 3 mornings using a smartphone-based photoplethysmography application. Each 1-minute RMSSD measure was recorded following a 1-minute stabilization period. The first (T1) measurement occurred at the athlete’s home following waking, while the second (T2) transpired upon arrival at the team’s boathouse immediately before practice. From the measures, the RMSSD mean and coefficient of variation were calculated. Two objective performance assessments were conducted on an indoor rowing ergometer on separate days: 2000-m time trial and distance covered in 30 minutes. Interteam rank was determined by the coaches, based on subjective and objective performance markers.
Results:
The RMSSD mean (intraclass correlation coefficient = .82; 95% CI, .63 to .92) and RMSSD coefficient of variation (intraclass correlation coefficient = .75; 95% CI, .48 to .88) were strongly correlated at T1 and T2, P < .001. The RMSSD mean at T1 and T2 was moderately associated with athlete rank (r = −.55 and r = −.46, respectively), 30-minute distance (r = .40 and r = .41, respectively), and 2000 m at T1 (r = −.37), P < .05. No significant correlations were observed for the RMSSD coefficient of variation.
Conclusion:
Ultrashort RMSSD measurements taken immediately upon waking show very strong agreement with those taken later in the morning, at the practice facility. Future research should more thoroughly investigate the relationship between specific performance indices and the RMSSD mean and coefficient of variation for female collegiate rowers.
Keywords: athletic monitoring, female athletes, RMSSD, rowing, HRV recording time
In recent years, sport-science technology has been at the forefront of athletic monitoring and performance across numerous sport disciplines.1 Among these technologies are the use of short-term measurements of heart-rate variability (HRV), which reflects cardiac autonomic modulation of the heart by expressing the non-linear and complex oscillations that occur between successive heart beats.1,2 HRV monitoring has gained popularity among coaches and athletes as a simple, noninvasive tool to monitor autonomic function for performance and recovery.1,3 Several studies have shown that, during intense training periods, vagal indices of HRV decrease acutely and rebound 24 to 48 hours beyond their pretraining recovery levels, resulting in different performance outcomes for both recreational and highly trained athletes.4-7 Endurance-type sports, such as rowing, place excessive demands on both the aerobic and anaerobic systems.8,9 Such demands result in major physiological perturbations, often characterized by significant fluctuations in heart rate (HR) and, thus, autonomic function.5,6 Given the unique physiologic profile of rowers8 and their typical high training volumes, monitoring day-to-day fluctuations in HRV could provide valuable information regarding recovery and adaptation to training.
The time-domain HRV parameter, root mean square of successive R-R intervals (RMSSD), is the preferred marker of parasympathetic modulated HRV in ambulatory or field-based conditions among athletic populations10,11 in resting conditions across a weekly (or rolling) average. RMSSD is often used with athletes because it is not significantly influenced by breathing frequency,12 can be captured over a short time frame,13 and is easily calculated in Microsoft Excel (Microsoft Corp, Redmond, WA).14 Nonetheless, time constraints in a collegiate sport environment (ie, training scheduling, compliance with National Collegiate Athletic Association [NCAA] regulations, etc) and irregular practice hours are typical challenges faced when implementing monitoring routines in distinct sports settings. To circumvent these issues, several physiologic monitoring devices, including those that measure resting HRV, have been adapted for use in nonlaboratory settings. However, HRV metrics (ie, RMSSD) are extremely sensitive to both methodological and physiological perturbations.2 Therefore, HRV measurements upon waking are preferred to limit the potential influence of external stimuli on the autonomic nervous system and, thus, cardiac autonomic function measured via RMSSD.1,11,15,16 The feasibility of obtaining high athlete compliance and reliable RMSSD measures in an unsupervised, home-based setting remains a concern among coaches and researchers alike. Morning resting RMSSD measures performed on-site at the beginning of regularly scheduled practice sessions, with oversight from trained technicians, seem to represent the most practical and accurate monitoring solution for collegiate athletics. Yet, based on the existing literature, which presents different times of day to perform ultra-short-term RMSSD collection,2 it is unclear whether the reliability of short-term RMSSD measurements is influenced by the timing of when they are performed in the morning hours (ie, measured immediately upon waking vs immediately prior to morning practice). Considering that research collected at different time points may involve different autonomic-nervous-system-altering stimuli, it is uncertain whether researchers are deriving accurate and reliable values of RMSSD and their respective daily fluctuations.
To our knowledge, there are no existing studies that have investigated the within-and between-day reliability of short-term HRV measurements among athletes and the association with athletic performance. Therefore, the primary aim of this study was to assess the agreement between HRV values that were recorded immediately upon waking with the values recorded later in the morning, upon arriving at the practice facility, prior to practice. In addition, this study sought to determine the associations of these HRV measures with performance outcomes in competitive female rowers.
Methods
Participants
A total of 39 females, NCAA Division I collegiate rowers were recruited from the University of Alabama (Tuscaloosa, AL) women’s rowing team to participate in this study. The athletes were members of the same varsity team, with 4 (3) years of competitive rowing experience. Each of the athletes passed a medical examination from university physicians prior to participation in rowing-related activities, and pertinent health histories were collected from the team’s medical staff. Specific exclusion criteria included the following: (1) any diagnosed disability or disease that could influence response to training and/or HR, (2) an injury not allowing full participation in the performance tests, (3) any medication effecting HR, or (4) asthma or any respiratory/breathing disorder. Menstrual cycle and contraception use were identified for each of the participants, but with little conclusive evidence toward this effect on vagal tone, these participants were not excluded from analysis.17,18 Finally, the participants were asked to refrain from alcohol consumption for the entirety of the study, and all subjects self-reported this abstinence.
Written informed consent was obtained by each participant after learning of any potential risks associated with their involvement in the study. This study was approved by the University of Alabama Institutional Review Board in accordance with the Declaration of Helsinki, as well as NCAA Compliance personnel.
Overview of the Study Design
The data collection for this observational study occurred over 1 week during the beginning phase of the participants’ winter training program (January 2018). A 2-week familiarization period preceding the 6-day data collection period, where the athletes were introduced to the HRV recording method, is described below.
HRV Recordings
The HRV recordings were obtained using a previously validated19 photoplethysmography smartphone application, HRV4Training (https://www.hrv4training.com/), downloaded onto each athlete’s personal mobile device. For all recordings, the athletes placed their left index finger directly on the posterior camera sensor of their mobile device. The RMSSD recordings were performed in the upright seated position, with their back supported comfortably by a stable, backed chair, in order to reduce potential parasympathetic saturation commonly observed among highly fit individuals with low resting HR.20 The athletes were instructed to limit any bodily movement and practice spontaneous breathing11,19 before opening the HRV4Training application. The rowers then initiated a 1-minute stabilization period, followed by a 1-minute data acquisition period.19 Ultra-shortened (ie, 2-min) measures of RMSSD have been validated to be accurate and reliable when compared with the 10-minute criterion measure recommended by the task force,2 which is impractical in such athletic environments.15,21,22
During the week of data collection, the rowers were asked to complete 2 ultra-shortened morning RMSSD measurements, using the same personal mobile device with the HRV4Training photoplethysmography application and procedure as in the 2-week familiarization period. However, unlike during the familiarization period where only 1 RMSSD measurement was recorded per day (for a total of 14 d), the study week involved a second RMSSD measurement. The first HRV measurement (T1) was performed at the athlete’s home immediately after waking and elimination, in a seated position with a backed chair. They then proceeded through their normal, prepractice morning routine prior to their arrival at the boathouse. The second HRV measurement (T2) was obtained within 1 hour of T1, upon arrival at the on-campus boathouse for daily practice, according to the same procedures used in T1. All T2 measurements were collected between 5:30 and 6:00 AM in a quiet area of the boathouse, away from the main boat bay, under the supervision of trained graduate research assistants (Figure 1).
Figure 1 —

Training program, including 2 HRV recording times. HRV indicates heart-rate variability; T1, first measurement; T2, second measurement.
Training Program
The same rowing coach provided the training plan for all rowing athletes; as such, the content was similar across all rowing athletes and consisted of on-the-water rowing practice, land-based ergometer training, and strength training. The individual athlete’s rowing ergometer and on-water performance were collected from the coaches at the onset of the data collection and continued throughout the entire study period. A training program, including recording times, is outlined in Figure 1 and Table 1. The athletes did not compete in any formal races during the week of data collection, nor in the period leading up to it.
Table 1.
Full Daily Workout Routine Completed by Each Rowing Athlete Throughout the Study
| Day | Daily workouts |
|---|---|
| Monday | Aerobic warm-up run: 12′ Water workout AM: 24′ outbound, 5–7′ recovery, 30′ return; both at 18/20 spm, alternating every 2c Rowing ergometer workout PM: 2000-m time trial |
| Tuesday | Aerobic warm-up run: 12′ Water workout AM: 4 × 10′ w/3.5′ recovery; at 16/18/20/22 spm, alternating every 4′/3′/2′/1′ Strength workout AM: goal = approximately 60% 1RM—box jumps (3 × 5); front squat (2 × 6); back squat (3 × 8); low box step-up (3 × 5); RDLs (3 × 6) |
| Wednesday | Aerobic warm-up run: 12′ Water workout AM: 4 × 1.5 m w/5′ recovery; (format: 1000 m at 24–26 spm, 500 m at 30 spm rate cap, but must drop split). Each piece with static scrimmage start (1 stroke and go). |
| Thursday | Aerobic warm-up run: 22′ Water workout AM: 10 × (3′ on/1′ off) w/5′–7′ recovery between piece 5 and 6; pieces 1–5 at 24 spm and pieces 6–10 at 26 spm Strength workout AM: goal = approximately 60%–70% 1RM—clean pull (3 × 5 and 2 × 3); scalp retractions (3 × 5); bench press (3 × 6); DB incline bench (3 × 5); DB row (3 × 5); upright row (3 × 5) |
| Friday | Aerobic warm-up run: 12′ Water workout AM: 60′ drill; 30′–40′ SS row; both at 20–24 spm Rowing ergometer workout PM: 30-min ergometer test |
| Saturday | Aerobic warm-up run: 12′ Water workout AM: 60′ of drill/steady state row at 20–24 spm; 2 × 2′ w w/equal recovery (format: 1500 m at 26 spm; 500-m drop split, rate cap at 30 spm) |
Abbreviations: 1RM, 1-repetition maximum; cap, maximum stroke rate possible per minute; DB, dumbbell; piece, specific interval during the workout; RDL, Romanian deadlift; split, amount of time it would take to complete 500 m; spm, strokes per minute; w/, with.
Performance Metrics
Two land-based rowing ergometer tests (2000-m time trial and distance covered in 30 min) were included as performance markers to accompany the third metric, team ranking. The performance records included split and time to completion for each of the athletes’ 2000-m time trial, with a shorter time to completion indicating a greater performance. The 2000-m time trial is a common performance metric used in the sport of rowing to objectively quantify a rower’s ability to effectively move their mass through the stroke compared with their teammates’ and competitors’ ability.9 Successful performance requires an excess of anaerobic threshold, often resulting in >95% VO2max.8 Similarly, the 30-minute ergometer test reflects the number of meters pulled on an indoor ergometer over the course of 30 minutes. The typical NCAA rowing season begins in September, with longer race lengths (ie, 4000–10,000 m) designed to build an endurance base with technical proficiency for the more anaerobically taxing spring races, generally composed of 2000-m tests.8,9 Thus, the winter training period (November–March) of the season focuses on the shift from primarily aerobic to anaerobic thresholds. The rank of each rower within the team (54 athletes in total) was formulated at the end of each week at the discretion of the coaching staff. This ranking system was based on a culmination of the following factors: (1) differences in scores in biweekly ergometer testing, which occurred on Monday and Friday afternoons; the 2 ergometer tests that occurred in the week of data collection were the 2000-m time trial (Monday) and the 30-minute meters (Friday) (see Table 1 for further reference to training intensity and type); (2) racing performance, including but not limited to time trials, small and/or large boat matrices, and/or seat racing; (3) factors relevant to crew combination, namely within crew compatibility individual coachability, technical compatibility, and team balance/harmony; and (4) assessment of competitive readiness and other factors relevant to achieving team objectives (ie, academic eligibility, injury, etc).23
Data and Statistical Analyses
The existing literature24,25 suggests that training adaptation is more precisely reflected by weekly mean values of HRV than by isolated recordings due to the daily perturbations characteristic of autonomic nervous system activity and, thus, HRV. Furthermore, the RMSSD weekly average consisting of 3 or more measures per week or a 7-day running average has been shown to accurately identify any vagal-related changes in athletes and is considered a criterion measure for tracking weekly changes in autonomic function in response to training.25 Therefore, only those athletes who completed both measurements (T1 and T2) on at least 3 of the 6 recording days were included in the final analysis.
Analyses were performed using SPSS (version 23.0; IBM Corp, Armonk, NY) and Microsoft Excel 2016 software. The RMSSD mean and coefficient of variation (CV) were calculated (CV = [SD/mean] × 100; %) for each of the 2 daily recordings on an Excel spreadsheet. The RMSSD coefficients of variation values represent the standard error of the estimate (SEE; ie, absolute reliability) within the interday RMSSD assessments. The mean and CV RMSSD values collected for each athlete at both time points were compared using paired samples t tests. A Shapiro–Wilk test was used to assess the normality of the studied variables and was log transformed in the case of nonnormality. Thus, all daily RMSSD values were log transformed (mean [LnRMSSDM] and coefficient of variation [LnRMSSDCV]), and these values were used for all analyses.1,3,11
The relative reproducibility of the LnRMSSDM and LnRMSSDCV measures between T1 and T2 was calculated using Hopkins spreadsheets.26 The intraclass correlation coefficient and the typical error of measurement were calculated with 95% confidence intervals for reliability determination. The total distribution of the RMSSD mean and RMSSD coefficient of variation (ie, SEE, bias ± 95% limits of agreement [LOA]) scores from the 2 measurement points are presented in Bland–Altman plots.27 The 95% LOA for the total T1 and T2 distributions were generated by multiplying the SD of the score difference by 1.96, then ± from the mean difference to create the upper and lower limits, respectively.
Pearson r correlational analyses were performed to determine if the HRV parameters (LnRMSSDM and LnRMSSDCV) were related to the 2000-m time or 30-minute meters performance tests. Spearman Rho correlational analyses were performed to determine the relationship between rank at T1 and T2 for LnRMSSDM and LnRMSSDCV. Hopkins thresholds were used to interpret the magnitude or strength of the correlation coefficients (ie, intraclass correlation coefficient, Pearson r, Spearman Rho) as follows: <.10 (trivial), .30 (small), .50 (moderate), .70 (large), .90 (very large), and 1 (nearly perfect).26 A priori alpha was set to P < .05, and all data are presented as mean (SD).
Results
A total of 31 (n =31) athletes were included in the final analyses (19.7 [1] y, 26.3 [4] kg/m2). Six athletes were excluded for lack of adequate compliance (ie, at least 3 recordings during the week and 2 each day), and 2 athletes sustained injuries during the study, which did not allow them to complete the assigned workouts. Two subjects were not included in the 30-minute ergometer test correlation because their 30-minute test took place at a different time than the rest of the group due to their academic schedules. The mean of the differences between daily recordings was 34 (13) minutes.
The 2000-m time was 459 (16) seconds (n = 31); the 30-minute distance ergometer test was 7143 (235) m (n = 29); and the rank ranged between 1 and 54, as there were 54 athletes on the team. Very large intraclass correlation coefficients were observed between T1 and T2 for LnRMSSDM and LnRMSSDCV (P < .001), respectively (Table 2). Bland–Altman plots showed tight LOA for both the LnRMSSDM and LnRMSSDCV (Table 2; Figures 2 and 3). The mean HR for T1 was 67 (9) beats per minute and 68 (11) beats per minute for T2, as recorded in the same window as the HRV values. The LnRMSSDM values obtained at both time points were moderately correlated with all of the performance indices (P < .05), except the 2000-m test at T2 (r = −.33, P = .70, small). The LnRMSSDCV was not significantly correlated with any of the performance measures at T1 (rank: P = .124, small; 2000-m time: P = .08, moderate; 30-min meters: P = .052, moderate), or T2 (rank: P = .57, trivial; 2000-m time: P = .29, small; 30-min meters: P = .44, small) (Table 3).
Table 2.
Comparison of the LnRMSSDM and LnRMSSDCV Between Home and Boathouse Measurements
| HRV variable |
Recording location |
Mean (SD) |
ICC (95% CI) |
SEE | TE | Limits of agreement |
|||
|---|---|---|---|---|---|---|---|---|---|
| Bias (95% CI) |
1.96*SD | Lower limits (95% CI) |
Upper limits (95% CI) |
||||||
| LnRMSSDM | T1 | 4.5 (0.5) | .75 (.48 to .88)* | 0.29 | 0.40 | −0.03 (−0.18 to 0.12) | 0.80 | −0.83 (−1.09 to −0.57) | 0.76 (0.51 to 1.02) |
| T2 | 4.5 (0.5) | ||||||||
| LnRMSSDCV | T1 | 8.7 (3.7) | .82 (.63 to .92)* | 2.73 | 3.48 | 0.35 (−0.94 to 1.64) | 6.91 | −6.56 (−8.80 to −4.32) | 7.26 (5.02 to .9.50) |
| T2 | 8.4 (4.4) | ||||||||
Abbreviations: CI, confidence interval; HRV, heart-rate variability; ICC, intraclass correlation coefficient; LnRMSSDM, RMSSD log-transformed mean values; LnRMSSDCV, RMSSD log-transformed coefficient of variation; RMSSD, root mean square of successive R-R intervals; SEE, standard error of the estimate; T1, home (1st) measurement; T2, boathouse (2nd) measurement; TE, technical error.
p < 0.001
Figure 2 —

Bland–Altman method comparing the differences of the means for T1 and T2 LnRMSSDM measurements. The middle line represents the mean bias between the home (T1) and boathouse (T2) measurements (−0.03). The upper limit of agreement is represented by the top line (0.76), and the lower limit of agreement is represented by the bottom line (−0.83), as seen in Table 2. Circles represent individual data points. LnRMSSDM indicates RMSSD log-transformed mean values; RMSSD, root mean square of successive R-R intervals; T1, first measurement; T2, second measurement.
Figure 3 —
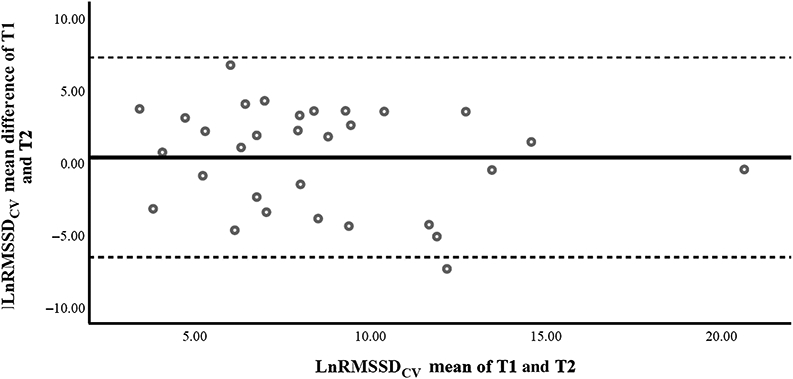
Bland–Altman method comparing the differences of the means for T1 and T2 LnRMSSDCV measurements. The middle line represents the mean bias between the home (T1) and boathouse (T2) measurements (0.35). The upper limit of agreement is represented by the top line (7.26), and the lower limit of agreement is represented by the bottom line (−6.56), as seen in Table 2. Circles represent individual data points. LnRMSSDCV indicates RMSSD log-transformed coefficient of variation; RMSSD, root mean square of successive R-R intervals; T1, first measurement; T2, second measurement.
Table 3.
Pearson r for LnRMSSDM and LnRMSSDCV and Performance Variables
| Performance variable | LnRMSSDM |
LnRMSSDCV |
||
|---|---|---|---|---|
| T1 | T2 | T1 | T2 | |
| Rank | −.55* | −.46* | −.25 | −.06 |
| 2000 m | −.37* | −.33 | −.32 | −.2 |
| 30 min‡ | .40* | .41* | .37 | .15 |
Abbreviations: CV, coefficient of variation; LnRMSSDoy, RMSSD log-transformed CV; LnRMSSDM, RMSSD log-transformed mean values; RMSSD, root mean square of successive R-R intervals; T1, home (1st) measurement; T2, boathouse (2nd) measurement.
p < 0.001
n = 29, all other measures n = 31.
Discussion
The purpose of this study was 2-fold, as follows: (1) to compare the RMSSD values recorded immediately upon waking to the values recorded later in the morning, prior to practice and (2) to determine the associations of these measures with performance outcomes in competitive female rowers. To our knowledge, this is the first study to investigate the agreement of ultra-short LnRMSSD measures spanning an entire week among Division I collegiate female rowers, which represents an understudied population.
Interestingly, the CV of daily log-transformed RMSSD (LnRMSSD) values, which generally characterize perturbations to cardiac autonomic homeostasis (ie, the day-to-day fluctuations of HRV),10 were not correlated with any performance indices at either time point, despite a strong agreement between the T1 and T2 measurements. These findings may speak more to the limitations of the current correlational study design rather than the lack of importance of monitoring LnRMSSDCV longitudinally. Specifically, without consideration of the effects of the overall training load performed by the athletes during the week of data collection, it may be difficult to detect meaningful relationships to specific performance outcomes. Furthermore, this study was completely observational, where the training plan was not altered by the researchers to induce specific perturbations to homeostasis and, as such, did not result in large fluctuations in LnRMSSDCV. It could be that the training program (Table 1) was not sufficient to evoke patterns of variability, or the rowers were already well adapted to the given training plan, as the period of data collection occurred in the middle of the season, which could thus explain the lack of changes in LnRMSSDCV that have been detected in previous studies.10,21,28 For example, Flatt and Esco28 found that weekly LnRMSSDCV values were more sensitive to training load adjustments than LnRMSSDM values across 3 weeks of varying training load in female collegiate soccer players. Finally, it is important to note that the performance markers that were chosen for this study were also not specifically altered or assigned by the research staff themselves, and while the 2000-meter time trial, 30-minute meters, and rank are common markers of performance in collegiate rowing settings,9,23 they may not have been the most appropriate for detecting changes in LnRMSSDM or CV for this population. Future studies should investigate if ultra-shortened LnRMSSDCV measures are a reliable marker of training adaptation and performance indices in collegiate female athletes throughout various periods of their competitive seasons.
One other study has investigated the reliability of ultra-shorted HRV measurements across and between days in team sports. Nakamura et al24 demonstrated superior interday and intraday reliability between LnRMSSD measures in elite rugby union players between 4 consecutive days during a team’s training camp. However, this study only investigated intraday reliability on the first training day of the week, and both of the recordings were conducted at the practice facility within only 10 minutes of the other. Thus, it would be difficult to compare the results of the current study, which investigates a weekly rolling LnRMSSD average, to that of only 1 intraday reliability measure. The weekly rolling average of LnRMSSD collected in the field from at least 3 time points across 7 days does not exactly parallel research models,25 which suggests that 3 random time points across 7 days is sufficient for a true weekly rolling average. However, a minimum of 3 time points does align with standard practice by coaches with moderate to large teams, such as the current sample. While some may consider this a limitation, it seems the most practical alternative to artificially eliminating important data to meet a minimum standard of collected days, which could potentially lead to assumptions of data manipulation. The overarching purpose of the aforementioned study, along with the current study, is to make the HRV measurement more accessible for monitoring training adaptations in the field while considering the actual situations for which the recordings would take place.
Though the sex of the rugby players is not specifically stated in Nakamura et al’s24 study, the majority of the current HRV literature has been conducted in athletic populations consisting of elite (ie, Olympic or national team level), male athletes3,7,28 and, thus, may not be generalizable to the current study sample or other studies involving female athletes. It is unclear how this may have influenced our results, if at all. Future research should consider the effects of variables specific to female athletes in both short- and long-term study designs and their interactions with the sensitivity of HRV measures in parallel with individual weekly training adaptation.
Practical Application
This study utilized a unique approach to HRV monitoring, as it was designed to represent the “real-life” daily activities of the rowers, with limited interruption. Given the tendency of coaches and practitioners to gather HRV data in the practice facility15,21,22 in order to overcome compliance (ie, in this study only 31 of the 54 total rowers volunteered and completed the current study to its length) and financial burdens (ie, ordering only one HRV recording tool to be shared vs ordering enough for a full team), these results are promising for the future of sports science and athletic monitoring. These novel findings suggest that, despite the complexity of cardiac autonomic modulation (captured via HRV measurements)29,30 and its sensitivity to both internal and external stimuli, particularly outside of a controlled laboratory setting, both LnRMSSDM and LnRMSSDCV, when recorded at the practice facility, tend to have tight LOA with the values produced at home, upon waking. Furthermore, trends in LnRMSSDM, when compared with performance measures, can be detected with moderate correlations, with the largest correlations detected in the morning measures. Readers should be aware of the potential decreased sensitivity of measures taken later in the morning when attempting to monitor performance readiness (ie, rank performance measure: r = −.55 at T1 and r = −.46 at T2; see Table 3). Furthermore, the lack of correlation of performance with LnRMSSDCV values should not be attributed to the variable itself, but the current study design and correlations of this nature warrant further research. Our data may lead these practitioners, coaches, and trainers to ponder if this decreased sensitivity is more important than overall compliance and absolute accuracy of the measurements in terms of effective cardiac autonomic athletic monitoring.
Conclusion
Our findings address an important methodological question regarding the time point at which HRV measurements should be recorded. These data suggest that daily monitoring of the LnRMSSDM and LnRMSSDCV measurements performed at home, upon waking in a fasted state (T1), show very strong agreement with those taken later in the morning, prior to practice at the rowing facility (T2). Furthermore, measures of LnRMSSDM were moderately correlated to rank and the 30-minute test at both T1 and T2, and the 2000-m test only for T1. No significant correlations were detected between any of the performance measures and LnRMSSDCV for either T1 or T2.
Acknowledgments
Thank you to the University of Alabama NCAA DI Women’s Rowing Team athletes, coaches, and training staff for allowing the success of this study. Your time and dedication to this science and sport, which is the first of any female collegiate rowing team of your caliber, will undoubtedly help to inspire other young scientists to narrow the gap in female athletics and research. Thank you to Dr Todd Freeborn for your willingness to be a member of my thesis committee; your time and effort are greatly appreciated. Thank you to Ward Dobbs and Zack Cicone for your excellent mentorship and guidance throughout this process.
Contributor Information
Sara R. Sherman, Dept of Kinesiology, University of Alabama, Tuscaloosa, AL, USA.; Integrative Physiology Laboratory, College of Applied Health Sciences, University of Illinois at Chicago, Chicago, IL, USA.
Clifton J. Holmes, Dept of Kinesiology, University of Alabama, Tuscaloosa, AL, USA.
Bjoern Hornikel, Dept of Kinesiology, University of Alabama, Tuscaloosa, AL, USA..
Hayley V. MacDonald, Dept of Kinesiology, University of Alabama, Tuscaloosa, AL, USA.
Michael V. Fedewa, Dept of Kinesiology, University of Alabama, Tuscaloosa, AL, USA.
Michael R. Esco, Dept of Kinesiology, University of Alabama, Tuscaloosa, AL, USA.
References
- 1.Buchheit M Monitoring training status with HR measures: do all roads lead to Rome? Front Physiol. 2014;5:73. PubMed ID: 24578692 doi: 10.3389/fphys.2014.00073 [DOI] [PMC free article] [PubMed] [Google Scholar]
- 2.Task Force of the European Society of Cardiology the North American Society of Pacing Electrophysiology. Heart rate variability: standards of measurement, physiological interpretation, and clinical use. Task force of the European society of cardiology and the North American society of pacing and electrophysiology. Circulation. 1996;93(5):1043–1065. doi: 10.1161/01.CIR.93.5.1043 [DOI] [PubMed] [Google Scholar]
- 3.Esco MR, Flatt AA. Ultra-short-term heart rate variability indexes at rest and post-exercise in athletes: evaluating the agreement with accepted recommendations. J Sports Sci Med. 2014;13(3):535–541. PubMed ID: 25177179 [PMC free article] [PubMed] [Google Scholar]
- 4.Atlaoui D, Pichot V, Lacoste L, Barale F, Lacour J, Chatard J. Heart rate variability, training variation and performance in elite swimmers. Int J Sports Med. 2007;28(5):394–400. PubMed ID: 17111320 doi: 10.1055/s-2006-924490 [DOI] [PubMed] [Google Scholar]
- 5.Garet M, Tournaire N, Roche F, et al. Individual interdependence between nocturnal ANS activity and performance in swimmers. Med Sci Sports Exerc. 2004;36(12):2112–2118. PubMed ID: 15570148 doi: 10.1249/01.MSS.0000147588.28955.48 [DOI] [PubMed] [Google Scholar]
- 6.Iellamo F, Legramante JM, Pigozzi F, et al. Conversion from vagal to sympathetic predominance with strenuous training in high-performance world class athletes. Circulation. 2002;105(23):2719–2724. PubMed ID: 12057984 doi: 10.1161/01.CIR.0000018124.01299.AE [DOI] [PubMed] [Google Scholar]
- 7.Bellenger CR, Fuller JT, Thomson RL, Davison K, Robertson EY, Buckley JD. Monitoring athletic training status through autonomic heart rate regulation: a systematic review and meta-analysis. Sports Med. 2016;46(10):1461–1486. PubMed ID: 26888648 doi: 10.1007/s40279-016-0484-2 [DOI] [PubMed] [Google Scholar]
- 8.Hagerman FC. Applied physiology of rowing. Sports Med. 1984; 1(4):303–326. PubMed ID: 6390606 doi: 10.2165/00007256-198401040-00005 [DOI] [PubMed] [Google Scholar]
- 9.Mäestu J, Jürimäe J, Jürimäe T. Monitoring of performance and training in rowing. Sports Med. 2005;35(7):597–617. PubMed ID: 16026173 [DOI] [PubMed] [Google Scholar]
- 10.Flatt AA, Hornikel B, Esco MR. Heart rate variability and psychometric responses to overload and tapering in collegiate sprint-swimmers. J Sci Med Sport. 2017;20(6):606–610. PubMed ID: 27890479 doi: 10.1016/j.jsams.2016.10.017 [DOI] [PubMed] [Google Scholar]
- 11.Plews DJ, Laursen PB, Stanley J, Kilding AE, Buchheit M. Training adaptation and heart rate variability in elite endurance athletes: opening the door to effective monitoring. Sports Med. 2013;43(9):773–781. PubMed ID: 23852425 doi: 10.1007/s40279-013-0071-8 [DOI] [PubMed] [Google Scholar]
- 12.Penttila J, Helminen A, Jartti T, et al. Time domain, geometrical and frequency domain analysis of cardiac vagal outflow: effects of various respiratory patterns. Clin Physiol. 2001;21(3):365–376. PubMed ID: 11380537 doi: 10.1046/j.1365-2281.2001.00337.x [DOI] [PubMed] [Google Scholar]
- 13.Flatt AA, Esco MR. Heart rate variability stabilization in athletes: towards more convenient data acquisition. Clin Physiol Funct Imaging. 2016;36(5):331–336. PubMed ID: 25754514 doi: 10.1111/cpf.12233 [DOI] [PubMed] [Google Scholar]
- 14.Aubert AE, Seps B, Beckers F. Heart rate variability in athletes. Sports Med. 2003;33(12):889–919. PubMed ID: 12974657 doi: 10.2165/00007256-200333120-00003 [DOI] [PubMed] [Google Scholar]
- 15.Pereira LA, Flatt AA, Ramirez-Campillo R, Loturco I, Nakamura FY. Assessing shortened field-based heart-rate-variability-data acquisition in team-sport athletes. Int J Sports Physiol Perform. 2016;11(2):154–158. PubMed ID: 26115088 doi: 10.1123/ijspp.2015-0038 [DOI] [PubMed] [Google Scholar]
- 16.Schneider C, Hanakam F, Wiewelhove T, et al. Heart rate monitoring in team sports—a conceptual framework for contextualizing heart rate measures for training and recovery prescription. Front Physiol. 2018;9:639. PubMed ID: 29904351 doi: 10.3389/fphys.2018.00639 [DOI] [PMC free article] [PubMed] [Google Scholar]
- 17.Fatisson J, Oswald V, Lalonde F. Influence diagram of physiological and environmental factors affecting heart rate variability: an extended literature overview. Heart Int. 2016;11(1):32–40. doi: 10.5301/heartint.5000232 [DOI] [PMC free article] [PubMed] [Google Scholar]
- 18.Janse de Jonge XA. Effects of the menstrual cycle on exercise performance. Sports Med. 2003;33(11):833–851. PubMed ID: 12959622 doi: 10.2165/00007256-200333110-00004 [DOI] [PubMed] [Google Scholar]
- 19.Plews DJ, Scott B, Altini M, Wood M, Kilding AE, Laursen PB. Comparison of heart rate variability recording with smart phone photoplethysmographic, polar H7 chest strap and electrocardiogram methods. Int J Sports Physiol Perform. 2017;12(10):1324–1328. PubMed ID: 28290720 doi: 10.1123/ijspp.2016-0668 [DOI] [PubMed] [Google Scholar]
- 20.Esco MR, Flatt AA, Nakamura FY. Agreement between a smartphone pulse sensor application and electrocardiography for determining lnRMSSD. J Strength Cond Res. 2017;31(2):380–385. PubMed ID: 28125545 doi: 10.1519/JSC.0000000000001519 [DOI] [PubMed] [Google Scholar]
- 21.Flatt AA, Esco MR, Allen JR, et al. Heart rate variability and training load among national collegiate athletic association division 1 college football players throughout spring camp. J Strength Cond Res. 2018;32(11):3127–3134. doi: 10.1519/JSC.0000000000002241 [DOI] [PubMed] [Google Scholar]
- 22.Nakamura FY, Pereira LA, Cal Abad CC, et al. Adequacy of the ultra-short-term HRV to assess adaptive processes in youth female basketball players. J Hum Kinet. 2017;56(1):73–80. PubMed ID: 28469745 doi: 10.1515/hukin-2017-0024 [DOI] [PMC free article] [PubMed] [Google Scholar]
- 23.Mikulić P, Smoljanović T, Bojanić I, Hannafin JA, Matković BR. Relationship between 2000-m rowing ergometer performance times and World Rowing Championships rankings in elite-standard rowers. J Sports Sci. 2009;27(9):907–913. doi: 10.1080/02640410902911950 [DOI] [PubMed] [Google Scholar]
- 24.Nakamura FY, Pereira LA, Esco MR, et al. Intraday and interday reliability of ultra-short-term heart rate variability in rugby union players. J Strength Cond Res. 2017;31(2):548–551. PubMed ID: 27243917 doi: 10.1519/JSC.0000000000001514 [DOI] [PubMed] [Google Scholar]
- 25.Plews D, Laursen P, Le Meur Y, Hausswirth C, Kilding A, Buchheit M. Monitoring training with heart rate-variability: how much compliance is needed for valid assessment? Int J Sports Physiol Perform. 2014;9(5):783–790. PubMed ID: 24334285 doi: 10.1123/ijspp.2013-0455 [DOI] [PubMed] [Google Scholar]
- 26.Hopkins WG, Marshall SW, Batterham AM, Hanin J. Progressive statistics for studies in sports medicine and exercise science. Med Sci Sports Exerc. 2009;41(1):3–13. PubMed ID: 19092709 doi: 10.1249/MSS.0b013e31818cb278 [DOI] [PubMed] [Google Scholar]
- 27.Bland JM, Altman DG. Statistical methods for assessing agreement between two methods of clinical measurement. Lancet. 1986;1(8476):307–310. PubMed ID: 2868172 doi: 10.1016/S0140-6736(86)90837-8 [DOI] [PubMed] [Google Scholar]
- 28.Flatt AA, Esco MR. Smartphone-derived heart-rate variability and training load in a women’s soccer team. Int J Sports Physiol Perform. 2015;10(8):994–1000. PubMed ID: 25756657 doi: 10.1123/ijspp.2014-0556 [DOI] [PubMed] [Google Scholar]
- 29.Bonnemeier H, Wiegand Uwe KH, Brandes A, et al. Circadian profile of cardiac autonomic nervous modulation in healthy subjects. J Cardiovasc Electrophysiol. 2003;14(8):791–799. PubMed ID: 12890036 doi: 10.1046/j.1540-8167.2003.03078.x [DOI] [PubMed] [Google Scholar]
- 30.Molgaard H, Sorensen KE, Bjerregaard P. Circadian variation and influence of risk factors on heart rate variability in healthy subjects. Am J Cardiol. 1991;68(8):777–784. PubMed ID: 1892086 [DOI] [PubMed] [Google Scholar]