

Abstract
The outbreak of Coronavirus Disease-2019 (COVID-19) has posed a threat to world health. With the increasing number of people infected, healthcare systems, especially those in developing countries, are bearing tremendous pressure. There is an urgent need for the diagnosis of COVID-19 and the prognosis of inpatients. To alleviate these problems, a data-driven medical assistance system is put forward in this article. Based on two real-world data sets in Wuhan, China, the proposed system integrates data from different sources with tools of machine learning (ML) to predict COVID-19 infected probability of suspected patients in their first visit, and then predict mortality of confirmed cases. Rather than choosing an interpretable algorithm, this system separates the explanations from ML models. It can do help to patient triaging and provide some useful advice for doctors.
Keywords: Coronavirus Disease-2019 (COVID-19), diagnosis, machine learning (ML), prognosis
I. Introduction
At the end of 2019, several viral pneumonia cases of unknown cause were found in Wuhan, China. Subsequently, this disease was proved to be able to spread from person to person and was sweeping the world soon. On February 11, 2020, the World Health Organization named it as Coronavirus Disease-2019 (COVID-19) [1]. By October 17, 2020, more than 39 million cases had been confirmed COVID-19 worldwide, among which over 1 million people had died [2]. Some experts have proposed to use the SEIR model to predict the impact of population migration on the spread of COVID-19, thereby providing efficient intervention strategies to cut off the spread transmission [3], [4]. Though this is conducive to decrease the number of infected people in the future, the increasing number of confirmed cases has occupied most of the medical resources and brought a heavy burden to medical systems at present.
Patients with certain clinical features and epidemiology risks are defined as suspected cases [5]. The suspected cases are confirmed with COVID-19 if it is positive for the 2019-nCoV by the real-time polymerase chain reaction (RT-PCR) test for COVID-19 or viral gene sequencing shows high homogeneity to the known 2019-nCoV [6], [7]. However, in practice, many researchers have found false positive or false negative of the results caused by the dirty sampling process, damage to samples in transport, etc., [8]–[10]. Therefore, there is no definitive examination for COVID-19. Hospitals tend to invite expert groups to make a final diagnosis with the help of medical history, physical examination, hematology examination, imaging examination, and so on. Treatment plans are tailored to suit the disease progress under the guideline of examination results. The recommended monitoring items are listed in Table I. Usually, patients take the RT-PCR test or viral gene sequencing at the initial diagnosis. Once the patients are confirmed with COVID-19 and are admitted to the hospital, they are divided into two major categories: 1) general and 2) severe. Doctors are inclined to pay more attention to severe cases.
TABLE I. COVID-19 Monitoring Items for Different Phases.
| Phase | Monitoring Items | |
|---|---|---|
| To Be Confirmed | RT-PCR test, viral gene sequencing [6] | |
| Confirmed | General Condition | blood routine, C Reactive Protein(CRP), procalcitonin(PCT), organ function, coagulation function, arterial blood gas analysis, chest imaging [6] |
| Severe Condition | items in General Condition(above), lactic dehydrogenase(LDH) [5], D-dimer [6], IL-6 [11] | |
It is a tedious and error-prone job to process these data, let alone coming to any conclusions. Using scientific methods to process data and construct a mathematical model to solve problems is an inevitable consequence, Huang et al. [12] leveraged statistical tools to analyze the clinical features of patients infected with COVID-19. These results are meaningful, but it is hard to consider so many variables at one time before making decisions. More direct tools are needed to quickly distinguish a COVID-19 patient from others. Liang et al. [13] developed a clinical risk score system to predict the occurrence of critical illness in hospitalized patients with COVID-19 by the least absolute shrinkage and selection operator (LASSO) regression. It is straightforward but there is room for improvement. A wide range of prediction models for diagnosis and prognosis of covid-19 infection were reviewed in [14]. Kukar et al. [15] utilized machine learning (ML) technology to construct a predictive model for the diagnosis of COVID-19. Pourhomayoun and Shakibi [16] proposed a prediction model based on artificial intelligence (AI) to predict the mortality risk of patients with COVID-19. However, this kind of technology lacks interpretability. Yan et al. [17] collected 485 blood samples and used XGBoost to select three important biomarkers related to the death rate of COVID-19. They also chose a one-tree-based model to predict the mortality of patients with COVID-19. The model can be improved by changing the number of trees; however, as the number of trees increases, it becomes hard to interpret the results. In this circumstance, a black-box model may have better performance. As Molnar [18] proposed, it is possible to interpret a black-box model.
This article presents a two-stage system for COVID-19 diagnosis and prognosis, which will optimize the procedure of a suspected patient coming into the hospital. In the first stage, the model leverages the textual record in the first visit and clinical data. While in the second stage for the inpatients, the model gives convincing and accurate results. The main contributions of this article are summarized as follows.
-
1)
We put forward a general diagnosis–prognosis system to serve the medical process. Compared with other systems [15]–[17] which focus on diagnosis or prognosis, we provide a more comprehensive perspective.
-
2)
Given medical textual record and clinical data, this system can form clinical features for COVID-19 diagnosis. Clinical manifestation, which is often recorded in the form of text, is valuable for diagnosis. Unfortunately, there are few works on COVID-19 textual data. We deal with textual data in patients’ first visit to the hospital and prove that it does help the diagnosis of COVID-19.
-
3)
We use additional models to provide an explanation for black-box models of diagnosis and prognosis. Studies put emphasis on model interpretability [17] or improved accuracy [15], [16], we select a model that performs best and then use explainable methods to explain the results, which is an efficient way to entail an important compromise between model interpretability and precision.
The subsequent sections are organized as follows. In the next section, we give a thorough overview of the system framework. Section III introduces the settings of the experiments, including data set description and performance evaluation. The experimental results and related discussions are shown in Section IV. Section V concludes this article and discusses about future directions.
II. System Model
In this section, we present an overview of the two-stage system. Then, we describe how to deal with data, especially textual data. The models for diagnosis and prognosis have common explainable models; therefore, we introduce explainable models after data preprocessing. Furthermore, the prediction model for diagnosis is described particularly.
A. System Overview
With the outbreak of COVID-19, many suspected people flooded into hospitals in search of medical advice. Most of them will experience several examinations. Once they are confirmed to infect COVID-19, they have to receive different treatments according to disease development indicated by examinations. In order to improve hospital efficiency during the epidemic, this article puts forward a two-stage system for COVID-19 based on patients’ clinical data, as shown in Fig. 1.
Fig. 1.

System overview.
Two stages refer to diagnosis and prognosis. The task of the first stage is to classify patients, determining whether they have been infected by COVID-19 or not. The data set in this stage contains medical textual records, basic information of patients, and examination data. The second stage is an extension of the first stage. It predicts the mortality of the infected patients that are confirmed in the first stage. Based on mortality, these patients can be grouped into general types and serious types. In the process of medical treatment, doctors will pay more attention to serious patients. Theoretically speaking, data in the first stage can be used in the second stage. In this experiment, limited by the obtained data set, the input data in the first stage is different from those in the second stage. No matter what the ML models are for predicting infection or mortality, we use the Shapley additive explanations (SHAP) to provide an explanation for the results.
B. Data Preprocessing
The data processed in this article are mainly about clinical information, including nucleic acid testing results, laboratory tests, patients’ basic information, medical textual records, etc. First, we delete those data and features with too many null values. As for structural examination data, except for textual data, different patients take targeted examination items. The missing items are filled with value −1 to indicate an empty biological indicator. When the data set is large enough, we can train all biological indicator features. However, the training data set is in a small quantity, so we have to do some selections. The categories of examination to the infected and noninfected tend to be different. If all examined items are trained, the difference between examined items of the infected and those of the noninfected will influence results rather than the examination outcomes. Therefore, we tend to choose the examinations that they jointly experience. As for patients’ basic information, we use the mean value or mode value to fill the missing values. More specifically, numerical variables will calculate the mean value of the existing data, while categorical variables prefer to select the value that appears most frequently.
Textual records include records of basic diseases and records of symptoms in Chinese. We use THUOCL [19], a Chinese medical corpus, to cut the sentences. The prime symptoms are fever and feebleness; hypertension and diabetes are the most common basic diseases.
Then, we use term frequency inverse document frequency (TF-IDF) [20] to transfer records of basic diseases and symptoms to be structural data, i.e., vectors. The TF-IDF algorithm assumes that the most significant words for differentiating documents shall be those appearing in the document in high frequency but appearing in other documents of the whole document set in low frequency. Suppose there are
 documents. One of the documents is noted as
 . As for a term
 , its TF-IDF value is the product of term frequency (TF) and a scaling factor. The scaling factor is called inverse document frequency (IDF).
 is the times of word
 appearing in document
 .
.
 is the number of documents that contain the term
 . IDF reflects the universality of keywords. The more universal a word is, the lower its IDF value is. The TF-IDF weight of word
 in document
 is
is
 |
C. Predictive Models
After preprocessing features, we try to build two accurate predictive models for the two-stage system because the input data of diagnosis and prognosis are different. Though explainability and interpretability are used interchangeably in [21], someone pointed out the subtle difference. Interpretable models have meaningful parameters to explain predicted results, typical examples are the linear models, naive Bayes, and decision trees [22]. As the prediction model becomes complicated, even originally interpretable models could become hard to interpret. For example, compared with a single decision tree, the random forest is not directly interpretable. In contrast, explainable ML creates a post-hoc model to explain ML model [21]. Fig. 2 provides a detailed description of explainable ML. The real world will generate quite a lot of data. The data are processed into a structured format to be used as input to the model. ML models can learn knowledge and make predictions. Then, interpretability methods explain the predictive results in a more understandable way to humans.
Fig. 2.

Explainable model.
We adopted SHAP [23], a method from the coalitional game theory, to explain the individual prediction results. For every sample, the ML model will produce a predicted value. SHAP calculates the contribution of each feature to the prediction result. The contribution is called the Shapley value, which can indicate the impact of features on the sample. Suppose there are
 samples and each sample has
 features. The
 th feature of the
 th sample is denoted as
 ; the predictive value of the
 th sample in model is
 . The baseline (mean value of target variables of all samples) of all data is
 . The Shapley value of the
 th sample complies with the following equation:
 |
In the above equation,
 is the contribution of the
 th feature to sample
 .
.
 indicates that the
 th feature will increase the prediction value.
At the time of diagnosis, the most distinctive data are the doctors’ textual records which are transformed into a vector in the preprocessing stage. The textual vector may be too large to be comparable with other variables, so we apply principal components analysis (PCA) first. Except for doctors’ records, the patients may do some examinations in their first visit. These numerical outcomes are used to train an ML model. Then, the results are explained by SHAP. The composite model architecture is shown in Fig. 3. The model of prognosis is similar to the model of diagnosis except for the part of PCA.
Fig. 3.

Infection predicting model.
As the patient is confirmed to infect COVID-19 and moved into the hospital, he or she will do more examinations regularly to monitor the disease development. The numerical examination results are updated frequently, therefore, we abandon the textual features for the mortality predicting model. Using three biomarkers summarized in [17], we compared the effects of multiple models and chose the classifier that performs best.
III. Experiments
In this section, we give a detailed introduction to two experimental data sets. After that, the performance metrics are listed to evaluate the proposed methods.
A. Data Sets
This experiment contains two data sets that are used in the first stage and the second stage, respectively. The first data set comes from a hospital in Wuhan, China, including medical information of 350 patients who have similar symptoms. 244 patients have been confirmed to be infected by COVID-19; while the remaining 106 patients are not infected. This data set contains 85 biological indicators and textual information about basic diseases and symptoms. The diagnosis result (infected or not) is the label. We randomly select 70 samples according to the proportion of positive and negative samples to form a testing set. The remaining data is used to train and validate an ML model. Table II gives statistics of feature variables in the remaining data. Symptoms and basic diseases are two independent columns that contain several sentences or words. We cut the sentences and extract the most frequently used words, as shown in Table II. Symptoms and basic diseases may have a relationship with infection results; therefore, we include them as textual features.
TABLE II. Statistic Information of the First Data Set.
| Characteristics | Overall | Infected | Not Infected | |
|---|---|---|---|---|
| Age, mean(s.d.)(years) | 58.61(15.56) | 60.02(14.86) | 55.39(19.66) | |
| Male,No./No.(%) | 138/280(49.29) | 79/195(40.51) | 59/85(69.41) | |
| Temperature, mean(s.d.)(°C) | 37.67(1.05) | 37.82(0.99) | 37.34(1.11) | |
| Symptoms | Fever | 160 | 130 | 30 |
| Cough | 138 | 112 | 26 | |
| Feebleness | 83 | 75 | 8 | |
| Chest distress | 63 | 50 | 13 | |
| Basic diseases | Hypertension | 69 | 55 | 14 |
| Diabetes | 40 | 36 | 4 | |
| Heart disease | 9 | 8 | 1 | |
The second data set comes from [17], which is available on the Internet. All patients in this data set are infected by COVID-19. It has 485 samples and 110 of them are extracted as an external test data set. Of the remaining 375 cases, 201 patients have been cured to recover; the other 174 patients died. When training the mortality model, we choose lactic dehydrogenase (LDH), lymphocyte, and C-reactive protein (CRP) as features due to the limit of the data set.
B. Performance Measure
Both proposed models are binary classifiers. In terms of diagnosis, Patients that are infected are denoted as class 1 and the others are class 0. When it comes to prognosis, class 1 refers to severe patients and class 0 is the normal patients. Select class
 as the true class, the predictive results can be grouped into four categories: 1) TPi (true positive); 2) FPi (false positive); 3) TNi (true negative); and 4) TNi (false negative). Suppose that the number of instances is
 . Obviously,
 . The frequently used criteria are accuracy, precision, recall, and
 score. They are, respectively, defined as follows:
 |
The predicted results of a binary classifier may change when the threshold changes. Use false positive rate as
 -axis, true positive rate as
 -axis, and change the value of the threshold, we can plot receiver operating characteristic (ROC) curve. In the case of interaction of two curves, area under ROC curve (AUC) is used to measure the generalized performance. To get a more clear insight into the effect of the classifier, we print the macro average score and the weighted average score, which are defined as follows:
 |
In above equations,
 ,
,
 is the number of the samples in the
 th class.
IV. Results and Discussion
In this section, we conduct several experiments to test our system performance. The results are split into two parts: 1) diagnosis model and 2) prognosis model. More precisely speaking, they can be called as the infection predicting model and mortality predicting model, respectively.
A. Infection Predicting Model
In the stage of feature selection, we remove columns and rows that have too many empty values. Then textual features are reduced by PCA. The reduced textual features and numerical features are stacked to form input to the ML model. The gradient boosting decision tree (GBDT) [24] is a perfect choice for classification that has proven to be good in many competitions. We select the GBDT model as the ML method to compare the following three strategies.
-
1)
Only use numerical features, including 28 columns.
-
2)
Only use TF-IDF textual features.
-
3)
Use numerical features and textual features.
GBDT was trained with the following default parameter settings: maximum depth is 3, the number of tree estimators is 75, and learning rate is 0.1. The number of components to keep for PCA is 10. The training and validation results using 100-round fivefold cross-validation are shown in Table III. A combination of numerical features and textual features is demonstrated to outperform only one kind of feature in the validation set.
TABLE III. Performance of the Infection Predicting Model.
| Features | Training Set | Validation Set | ||||||||
|---|---|---|---|---|---|---|---|---|---|---|
| Accuracy | Precision | Recall | F1score | AUC | Accuracy | Precision | Recall | F1score | AUC | |
| Only Numerial Features | 1.0000 | 1.0000 | 1.0000 | 1.0000 | 1.0000 | 0.8372 | 0.8606 | 0.9170 | 0.8869 | 0.9099 |
| Only Textual Features | 0.8679 | 0.8460 | 0.9909 | 0.9127 | 0.9174 | 0.7074 | 0.7228 | 0.9414 | 0.8173 | 0.6645 |
| Both | 1.0000 | 1.0000 | 1.0000 | 1.0000 | 1.0000 | 0.8440 | 0.8571 | 0.9335 | 0.8929 | 0.9171 |
Also, we print the top ten numerical features with the largest weight using GBDT, as shown in Fig. 4. Procalcitonin (PCT) ranks first, this is consistent with many medical findings that PCT has a high relationship with COVID-19 [25], [26]. White blood cell (WBC) is also an outstanding characteristic of peripheral blood leukocyte differential counts in patients with COVID-19 [27].
Fig. 4.

Weights of top ten numerical features in GBDT.
The preprocessed features then input into different ML models. We will pick the best model according to the validation results. This process is similar to the process of the mortality prediction model, which is detailed in the following part.
B. Mortality Predicting Model
We select three features as proposed in [17]. Then, five classic ML methods are chosen as base classifiers: logistic regression, support vector machine (SVM), random forest,
 nearest neighbors, neural network. We train and validate different models in Scikit-learn [28] using 100-round fivefold cross-validation. The results are shown in Table IV. The regularization strength of logistic regression is set to be 0.1 with the optimization method of lbfgs. The number of trees in random forest is 50. The regularization strength of SVM is
 nearest neighbors method uses three neighbors to cluster. The neural network has three layers of size 20, 60, 40 with the adam optimizer.
TABLE IV. Performance of Different Algorithms for Mortality Prediction.
| Algorithm | Training Sets | Validation Sets | ||||||||
|---|---|---|---|---|---|---|---|---|---|---|
| Accuracy | Precision | Recall | F1score | AUC | Accuracy | Precision | Recall | F1score | AUC | |
| Logistic Regression | 0.9320 | 0.9435 | 0.9078 | 0.9252 | 0.9866 | 0.9272 | 0.9411 | 0.9007 | 0.9196 | 0.9848 |
| Random Forest | 0.9840 | 0.9675 | 0.9992 | 0.9831 | 0.9990 | 0.9549 | 0.9319 | 0.9758 | 0.9527 | 0.9883 |
| SVM | 0.9415 | 0.9750 | 0.8970 | 0.9343 | 0.9832 | 0.9397 | 0.9748 | 0.8936 | 0.9317 | 0.9814 |
| K Nearest Neighbors | 0.9320 | 0.9435 | 0.9078 | 0.9252 | 0.9866 | 0.9272 | 0.9411 | 0.9007 | 0.9196 | 0.9848 |
| Neural Network | 0.9459 | 0.9049 | 0.9876 | 0.9443 | 0.9913 | 0.9385 | 0.9003 | 0.9780 | 0.9367 | 0.9840 |
Based on the results in training sets and validation sets, we choose random forest as the final model. In [17], the AUC score is 97.84% for training sets and 95.06% for validation sets using multitree XGBoost [29]. Random forest exceeds XGBoost. Then, we apply random forest to the testing set and get the results, as shown in Table V. The testing results are the same as the results in [17] though we have a higher validation accuracy. This may because the data set is too small.
TABLE V. Performance of the Random Forest Model on the External Test Data Set.
| Precision | Recall | F1score | Accuracy | |
|---|---|---|---|---|
| Survival | 1.00 | 0.97 | 0.98 | 0.97 |
| Death | 0.81 | 1.00 | 0.90 | |
| Macro average | 0.91 | 0.98 | 0.94 | – |
| Weighted average | 0.98 | 0.97 | 0.97 |
Random forest is often thought difficult to explain for it has hundreds of trees; therefore, we use tree SHAP [30] to explain the results of random forest. We have calculated the importance of three variables to result, as shown in Fig. 5. The influence of LDH is most significant; the second is lymphocyte, and the last is CRP.
Fig. 5.

Importance degree of three features.
Then, we visualize feature importance, as shown in Fig. 6. Each row represents a feature; each point represents a sample. The redder the color is, the larger the value is; the bluer the color is, the smaller the value is. Take mortality prediction as a binary classification problem where 1 means death. In Fig. 6, there are many red points on the right of the SHAP value for LDH and CRP, which indicates a large value; as for lymphocyte, blue areas are on the right, which indicates the small lymphocyte leads to death. Overall, when the level of LDH and CRP rises, and the level of lymphocyte decreases, the death rate may increase. It accords with clinical features of death cases in [31].
Fig. 6.

SHAP value of three features.
For further details, we present SHAP value of each variable and the mutual relations with other variables, as shown in Fig. 7. The following normal reference values are provided to better understand the results: the reference value of LDH is 109–245 U/L; the reference value of Lymphocyte proportion is 20%–50%; the reference value of CRP is no more than 8 mg/L.
Fig. 7.
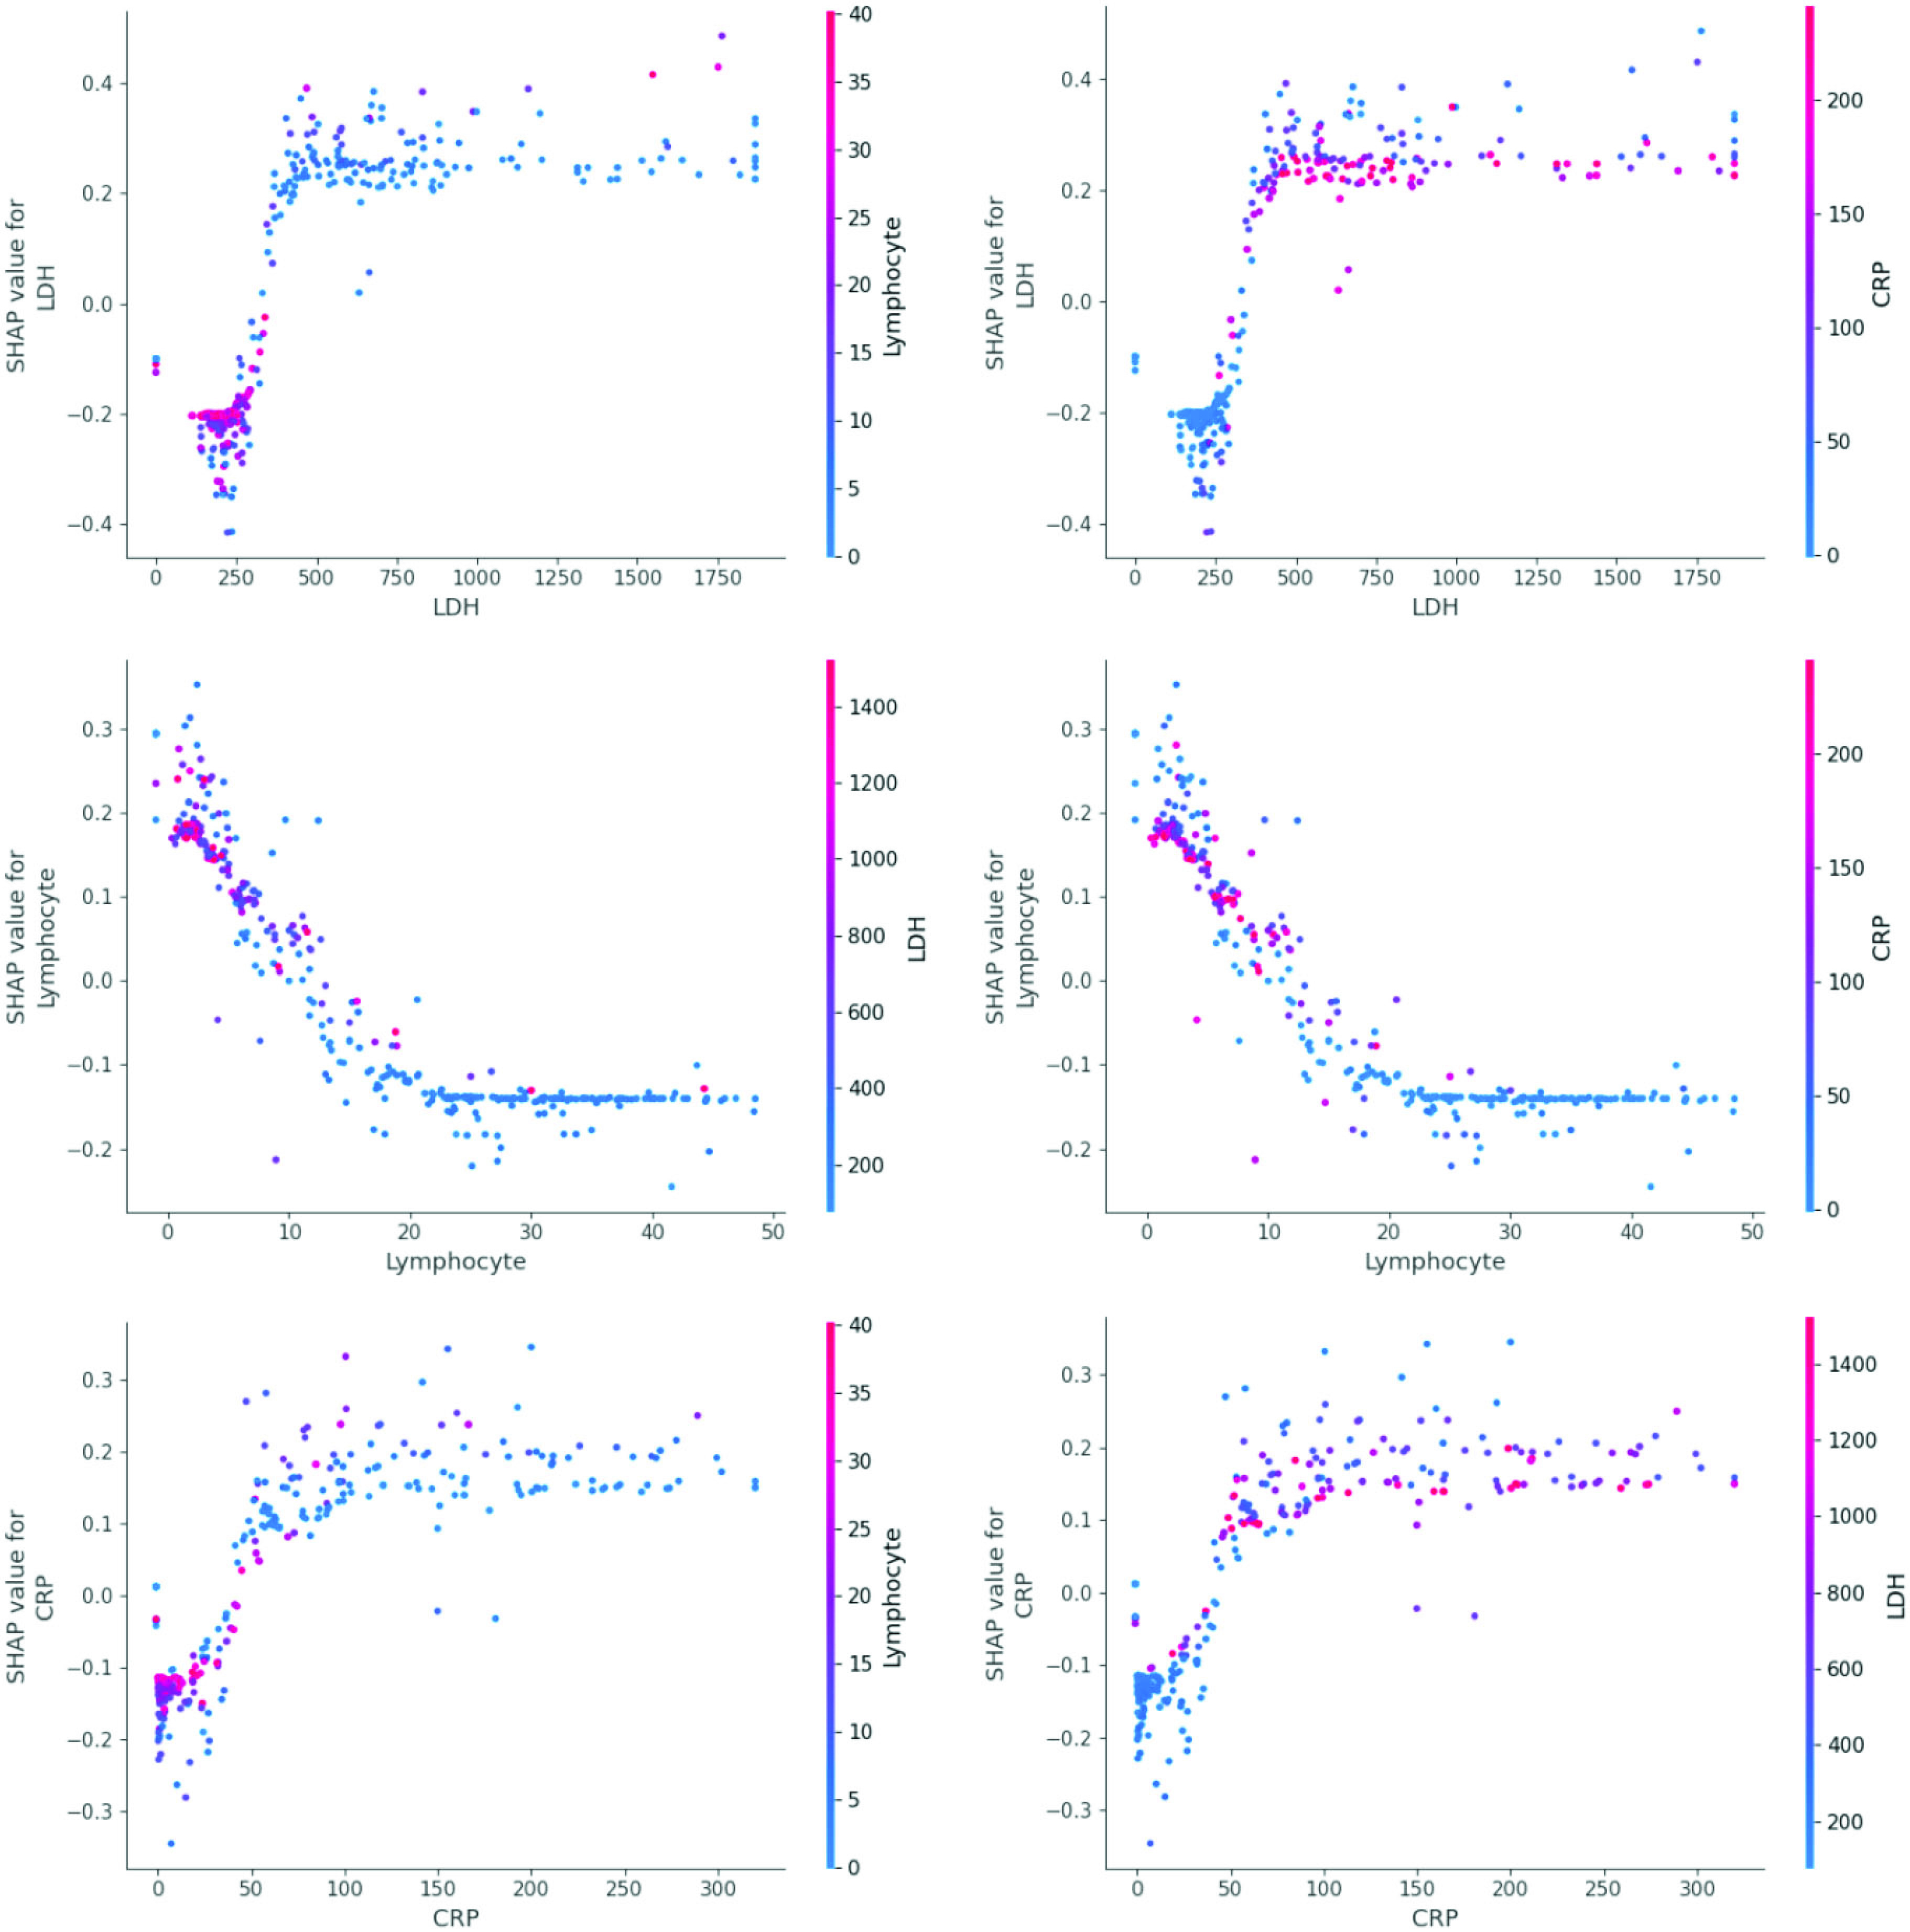
Correlations of three features.
Death probability rises sharply after LDH exceeds 350 U/L. Lymphocyte can be divided into three stages. When lymphocyte is smaller than 5%, the SHAP value is larger than 0, which indicates death can be caused easily. When lymphocyte is 5%–18%, SHAP value becomes negative and lymphocyte plays negative functions to death. When lymphocyte is larger than 18% and lower than 50%, survival probability is relatively high. The boundary of CRP is CRP=50 mg/L. The rise of CRP indicates the rise of death probability. When CRP is about 150 mg/L, death probability will decline slightly.
The six graphs in Fig. 7 show the relations among the three variables. When LDH becomes larger, CRP tends to be larger. There is an inverse relation between lymphocyte and LDH and CRP.
V. Conclusion
This proposed two-stage system has two innovations compared with others. First, it learns and integrates textual information in an earlier diagnosis stage. Second, it uses an explainable model to keep a balance between accuracy and interpretability. In view of applications, this kind of AI system may do help to triage. When a patient with suspected symptoms of COVID-19 goes into the hospital, medical staff can record some basic information and collect the laboratory data to produce a predictive diagnosis, distinguishing between those who have infected COVID-19 and those who do not. The confirmed cases are then isolated from the crowd. More exact data can be input into the mortality predicting model to determine the priority of treatment.
The significance of the proposed system is to use AI to simplify the medical treatment process. Some previous works have provided 5G edge computing methods for deploying AI models in the network edge or vehicle environment, paving the path for the COVID-19 triage system [32]–[35]. For instance, Abdulsalam and Hossain [36] analyzed COVID-19 networking demand and proposed an auction-based mechanism for the automated selection of edge computing services. However, there still has a lot of work to do before practical use. Especially, collecting high-quality data to train model is a long-term process. This is also a shortage of our system. When more data sets are added, more experiments will be conducted to improve the model. Especially, we hope that the input data of the model in the first stage are the same as the input data of the model in the second stage if the data are enough. An adaptive deep learning QoE optimization framework proposed by Wang et al. [37] may be beneficial to the data processing model of COVID-19. Moreover, we will consider mental health of patient in the future [38]–[40].
Biographies

Jiayi Lu received the master’s degree in computer system architecture from the School of Computer Science and Technology, Huazhong University of Science and Technology, Wuhan, China, in 2019, where she is currently pursuing the Ph.D. degree.
Her current research interests include machine learning, data mining, and the Internet of Things.

Renchao Jin received the M.S. and Ph.D. degrees in computer software and theory from Huazhong University of Science and Technology, Wuhan, China, in 1989 and 1998, respectively.
He is currently a Professor with the School of Computer Science and Technology, Huazhong University of Science and Technology. His current research interests involve computer vision, medical image processing and analysis, and artificial intelligence.

Enmin Song (Senior Member, IEEE) received the Ph.D. degree in electrical engineering and computer from Teesside University, Middlesbrough, U.K.
After completing his Ph.D. degree, he was a Postdoctoral Researcher with the University of California at San Francisco, San Francisco, CA, USA. He is currently a Professor with the School of Computer Science and Technology, Huazhong University of Science and Technology, Wuhan, China. His current research interests involve medical image processing and medical image information analysis.
Mubarak Alrashoud (Member, IEEE) received the Ph.D. degree in computer science from Ryerson University, Toronto, ON, Canada, in 2015.
He is currently an Associate Professor and the Head of the Department of Software Engineering, College of Computer and Information Sciences, King Saud University, Riyadh, Saudi Arabia.
Khaled N. Al-Mutib (Member, IEEE) received the Ph.D. degree in computer engineering from the University of Reading, Reading, U.K., in 1997.
He is an Associate Professor with the Department of Software Engineering, College of Computer and Information Sciences, King Saud University, Riyadh, Saudi Arabia. His research interest includes robotics, computation intelligence, and healthcare.
Mabrook S. Al-Rakhami (Member, IEEE) received the master’s degree in IS from King Saud University, Riyadh, Saudi Arabia, where he is currently pursuing the Ph.D. degree with the Department of Information Systems, College of Computer and Information Sciences.
He is currently a Researcher on Research Chair of Pervasive and Mobile Computing.
Funding Statement
This work was supported by the Deanship of Scientific Research at King Saud University, Riyadh, Saudi Arabia, under Project RG-1440-135.
Contributor Information
Jiayi Lu, Email: jiayilu@hust.edu.cn.
Renchao Jin, Email: jrc@hust.edu.cn.
Enmin Song, Email: esong@hust.edu.cn.
Mubarak Alrashoud, Email: malrashoud@ksu.edu.sa.
Khaled N. Al-Mutib, Email: muteb@ksu.edu.sa.
Mabrook S. Al-Rakhami, Email: malrakhami@ksu.edu.sa.
References
- [1].Wu Y., Chen C., and Chan Y., “The outbreak of COVID-19: An overview,” J. Chin. Med. Assoc., vol. 83, no. 3, pp. 217–220, 2020. [DOI] [PMC free article] [PubMed] [Google Scholar]
- [2].WHO Coronavirus Disease (COVID-19) Dashboard, World Health Org., Geneva, Switzerland, 2020. [Online]. Available: http://covid19.who.int [Google Scholar]
- [3].Yang Z.et al. , “Modified SEIR and AI prediction of the epidemics trend of COVID-19 in China under public health interventions,” J. Thoracic Dis., vol. 12, no. 3, pp. 165–174, 2020. [DOI] [PMC free article] [PubMed] [Google Scholar]
- [4].Chen M.et al. , “The introduction of population migration to SEIAR for COVID-19 epidemic modeling with an efficient intervention strategy,” Inf. Fusion, vol. 64, pp. 252–258, Aug. 2020. [DOI] [PMC free article] [PubMed] [Google Scholar]
- [5].Notice on the Issuance of a Programme for the Diagnosis and Treatment of Novel Coronavirus (2019-nCoV) Infected Pneumonia (Trial Version 7), Gen. Office Nat. Health Committee Office State Admin. Traditional Chin. Med., Beijing, China, 2020. [Online]. Available: http://bgs.satcm.gov.cn/zhengcewenjian/2020-03-04/13594.html [Google Scholar]
- [6].Jin Y.et al. , “A rapid advice guideline for the diagnosis and treatment of 2019 novel coronavirus (2019-nCoV) infected pneumonia (standard version),” Military Med. Res., vol. 7, no. 1, p. 4, 2020. [DOI] [PMC free article] [PubMed] [Google Scholar]
- [7].Hossain M. S., Muhammad G., and Guizani N., “Explainable AI and mass surveillance system-based healthcare framework to combat COVID-I9 like pandemics,” IEEE Netw., vol. 34, no. 4, pp. 126–132, Jul./Aug. 2020. [Google Scholar]
- [8].Ai T.et al. , “Correlation of chest CT and RT-PCR testing for coronavirus disease 2019 (COVID-19) in China: A report of 1014 cases,” Radiology, vol. 296, no. 2, 2020, Art. no. 200642. [DOI] [PMC free article] [PubMed] [Google Scholar]
- [9].Tahamtan A. and Ardebili A., “Real-time RT-PCR in COVID-19 detection: Issues affecting the results,” Expert Rev. Mol. Diagn., vol. 20, no. 5, pp. 453–454, 2020. [DOI] [PMC free article] [PubMed] [Google Scholar]
- [10].Wang Y., Kang H., Liu X., and Tong Z., “Combination of RT-qPCR testing and clinical features for diagnosis of COVID-19 facilitates management of SARS-CoV-2 outbreak,” J. Med. Virol., vol. 92, no. 6, pp. 538–539, 2020. [DOI] [PMC free article] [PubMed] [Google Scholar]
- [11].Liu T.et al. (2020). The Potential Role of IL-6 in Monitoring Coronavirus Disease 2019. [Online]. Available: https://doi.org/10.1101/2020.03.01.20029769 [Google Scholar]
- [12].Huang C.et al. , “Clinical features of patients infected with 2019 novel coronavirus in Wuhan, China,” Lancet, vol. 395, pp. 497–506, Feb. 2020. [DOI] [PMC free article] [PubMed] [Google Scholar]
- [13].Liang W.et al. , “Development and validation of a clinical risk score to predict the occurrence of critical illness in hospitalized patients with COVID-19,” JAMA Internal Med., vol. 180, no. 8, pp. 1081–1089, 2020. [DOI] [PMC free article] [PubMed] [Google Scholar]
- [14].Wynants L.et al. , “Prediction models for diagnosis and prognosis of COVID-19 infection: Systematic review and critical appraisal,” BMJ, vol. 369, p. m1328, Apr. 2020. [DOI] [PMC free article] [PubMed] [Google Scholar]
- [15].Kukar M.et al. , “COVID-19 diagnosis by routine blood tests using machine learning,” 2020. [Online]. Available: https://arXiv:2006.03476 [DOI] [PMC free article] [PubMed] [Google Scholar]
- [16].Pourhomayoun M. and Shakibi M.. (2020). Predicting Mortality Risk in Patients With COVID-19 Using Artifificial Intelligence to Help Medical Decision-Making. [Online]. Available: https://doi.org/10.1101/2020.03.30.20047308 [DOI] [PMC free article] [PubMed] [Google Scholar]
- [17].Yan L.et al. , “An interpretable mortality prediction model for COVID-19 patients,” Nat. Mach. Intell., vol. 2, no. 5, pp. 283–288, 2020. [Google Scholar]
- [18].Molnar C.. Interpretable Machine Learning. Accessed: Nov. 2020. [Online]. Available: https://christophm.github.io/interpretable-ml-book/ [Google Scholar]
- [19].Han S.et al. (2016). THUOCL: Tsinghua Open Chinese Lexicon. Accessed: Nov. 2020. [Online]. Available: https://github.com/thunlp/THUOCL [Google Scholar]
- [20].Weiss S. M., Indurkhya N., and Zhang T., Fundamentals of Predictive Text Mining. London, U.K.: Springer, 2010. [Google Scholar]
- [21].Tjoa E. and Guan C., “A survey on explainable artificial intelligence (XAI): Towards medical XAI,” 2019. [Online]. Available: https://arXiv:1907.07374 [DOI] [PubMed] [Google Scholar]
- [22].Carvalho D. V., Pereira E. M., and Cardoso J. S., “Machine learning interpretability: A survey on methods and metrics,” Electronics, vol. 8, no. 8, p. 832, 2019. [Google Scholar]
- [23].Lundberg S. M. and Lee S., “A unified approach to interpreting model predictions,” in Proc. 31st Int. Conf. Neural Inf. Process. Syst. (NIPS), 2017, pp. 4768–4777. [Google Scholar]
- [24].Friedman J. H., “Greedy function approximation: A gradient boosting machine,” Ann. Stat., vol. 29, no. 5, pp. 1189–1232, 2001. [Google Scholar]
- [25].Lippi G. and Plebani M., “Procalcitonin in patients with severe coronavirus disease 2019 (COVID-19): A meta-analysis,” Clinica Chimica Acta, vol. 505, pp. 190–191, Jun. 2020. [DOI] [PMC free article] [PubMed] [Google Scholar]
- [26].Liu F.et al. , “Prognostic value of interleukin-6, C-reactive protein, and procalcitonin in patients with COVID-19,” J. Clin. Virol., vol. 127, Jun. 2020, Art. no. 104370. [DOI] [PMC free article] [PubMed] [Google Scholar]
- [27].Li Y.et al. , “Characteristics of peripheral blood leukocyte differential counts in patients with COVID-19,” Chin. J. Internal Med., vol. 59, no. 5, pp. 372–374, 2020. [DOI] [PubMed] [Google Scholar]
- [28].Pedregosa F.et al. , “Scikit-learn: Machine learning in python,” J. Mach. Learn. Res., vol. 12, no. 85, pp. 2825–2830, 2011. [Google Scholar]
- [29].Chen T., and Guestrin C., “XGBoost: A scalable tree boosting system,” in Proc. 22nd ACM SIGKDD Int. Conf. Knowl. Discovery Data Min., 2016, pp. 785–794. [Google Scholar]
- [30].Lundberg S. M., Erion G. G., and Lee S., “Consistent individualized feature attribution for tree ensembles,” 2018. [Online]. Available: https://arXiv:1802.03888 [Google Scholar]
- [31].Li X.et al. (2020). Clinical Characteristics of 25 Death Cases Infected With COVID-19 Pneumonia: A retrospective Review of Medical Records in a Single Medical Center, Wuhan, China. [Online]. Available: https://doi.org/2020.10.1101/2020.02.19.20025239 [DOI] [PMC free article] [PubMed] [Google Scholar]
- [32].Chen M.et al. , “Living with I-Fabric: Smart living powered by intelligent fabric and deep analytics,” IEEE Netw., vol. 34, no. 5, pp. 156–163, Sep. 2020. [Google Scholar]
- [33].Rahman M. A., Hossain M. S., Alrajeh M. A., and Guizani N., “B5G and explainable deep learning assisted healthcare vertical at the edge: COVID-19 perspective,” IEEE Netw., vol. 34, no. 4, pp. 98–105, Jul./Aug. 2020. [Google Scholar]
- [34].Zhang J.et al. , “Energy-latency tradeoff for energy-aware offloading in mobile edge computing networks,” IEEE Internet Things J., vol. 5, no. 4, pp. 2633–2645, Aug. 2018. [Google Scholar]
- [35].Hossain M. S., “Cloud-supported cyber–physical localization framework for patients monitoring,” IEEE Syst. J., vol. 11, no. 1, pp. 118–127, Mar. 2017. [Google Scholar]
- [36].Abdulsalam Y. and Hossain M. S., “COVID-19 networking demand: An auction-based mechanism for automated selection of edge computing services,” IEEE Trans. Netw. Sci. Eng., early access, Sep. 24, 2020, doi: 10.1109/TNSE.2020.3026637. [DOI] [PMC free article] [PubMed]
- [37].Wang R., Chen M., Guizani N., Li Y., Gharavi H., and Hwang K., “DeepNetQoE: Self-adaptive QoE optimization framework of deep networks,” 2020. [Online]. Available: https://arXiv:2007.10878 [DOI] [PMC free article] [PubMed] [Google Scholar]
- [38].Chen M., Jiang Y., Cao Y., and Zomaya A., “CreativeBioMan: A brain- and body-wearable, computing-based, creative gaming system,” IEEE Syst., Man, Cybern. Mag., vol. 6, no. 1, pp. 14–22, Jan. 2020. [Google Scholar]
- [39].Hu X.et al. , “Emotion-aware cognitive system in multi-channel cognitive radio ad hoc networks,” IEEE Commun. Mag., vol. 56, no. 4, pp. 180–187, Apr. 2018. [Google Scholar]
- [40].Chen M. and Hao Y., “Label-less learning for emotion cognition,” IEEE Trans. Neural Netw. Learn. Syst., vol. 31, no. 7, pp. 2430–2440, Jul. 2020. [DOI] [PubMed] [Google Scholar]