

Abstract
This review paper discusses the properties of nanomaterials, namely graphene, molybdenum disulfide, carbon nanotubes, and quantum dots for unique sensing applications. Based on the specific analyte to be detected and the functionalization techniques that are employed, some noteworthy sensors that have been developed are discussed. Further, biocompatible sensors fabricated from these materials capable of detecting specific chemical compounds are also highlighted for COVID-19 detection purposes, which can aid in efficient and reliable sensing as well as timely diagnosis.
Keywords: Graphene, quantum dots (QDs), sensors, biocompatible, COVID-19
I. Introduction
Nanomaterials such as graphene, transition metal dichalcogenides and carbon nanotubes have attracted research efforts steadily over the last decade for numerous applications, as a result of their unique properties. For use in sensors, the superior electronic [1], optical [2], mechanical [3] and structural [4] properties of 2D substances and thin films, such as a high surface-to-volume ratio, enhanced flexibility, optical transparency, presence of multiple reaction sites, and high surface sensitivity, all contribute towards efficient sensing and detection of a range of analytes and molecules [5], [6].
Additionally, quantum dots are also beginning to be increasingly incorporated in sensors and imaging owing to their singular properties – large Stokes shift, narrow emission band, large molar absorption coefficient, long excited state lifetimes, high fluorescence quantum yields, superior resistance to chemical degradation, photobleaching and a high two-photon absorption cross section.
In this review, we have explored advances in sensors fabricated using these nanomaterials and discussed the application of these sensors for biosensing and, in particular, for detection of severe acute respiratory syndrome coronavirus 2 (SARS-CoV-2) virus.
II. Materials For Biosensors
A. Graphene
Graphene is a zero-bandgap semiconductor and possesses a low defect crystal structure. Owing to its pi-bonds, graphene exhibits extremely superior electrical conductivity by transforming chemical signals into electric current through transduction. It also depicts enhanced mechanical properties, including high tensile strength, flexibility, and elastic modulus. In spite of being atomically thin, it exhibits high absorbance, and is also thermally as well as chemically stable. Moreover, graphene can be incorporated with other polymer nanocomposite materials to obtain desirable properties for detecting trace amounts of specific compounds or harmful toxic elements such as heavy metals or industrial chemicals [7], [8].
Based on the specific target molecule or gas to be detected by the sensor, graphene can be functionalized with different compositions of metal oxides. The ease of availability of materials, combined with the advantage of graphene’s biocompatibility, have led to several graphene-based biosensors being fabricated, for the detection of specialized compounds [9], such as paracetomol [10], ascorbic acid [11], aromatic isomers [12], prostate specific antigen(PSA) [13], and hemoglobin(Hb) [14].
Sun et al. fabricated an electrochemical DNA biosensor for the detection of MON810, a genetically modified gene sequence via electrostatic adsorption through an electrochemical reduced graphene (ERG) film with a modified carbon ionic liquid electrode (CILE). The sensor displayed high sensitivity and the presence of the ERG film contributed towards increasing the adsorption of the probe ssDNA, which further enhances the response of methylene blue (MB), an electrochemical indicator, which can interact with DNA [15].
To harness the electrocatalytic energy of functionalized graphene sheets (FGS) for sensing glucose, Wu et al. reported a sensor consisting of a bionanocomposite film prepared by electrodeposition of modified platinum nanoparticles on the FGS (which was initially dispersed in a solution of chitosan and glassy-carbon electrode) and subsequent modification of the resultant film with enzymes. Lastly, glucose oxidase was immobilized on the film. The resultant biosensor depicted good sensitivity and responsivity, high reproducibility and long-term stability, thereby showing great promise for rapid and accurate glucose monitoring. Moreover, this fabrication method can also be extended for other types of graphene-based biosensors [16].
These graphene-based sensors have been summarized in tcolor table I for easy reference.
TABLE I. Graphene Based Biosensors.
| S. NO. | ANALYTE | BIOSENSING ELEMENT | ADVANTAGES AND SENSOR CHARACTERISTICS | REFERENCE |
|---|---|---|---|---|
| 1 | Paracetamol | Glassy carbon electrode modified with carbon | High sensitivity and recovery, detection limit of 3.2
 10−8M and 5.2% reproducibility 10−8M and 5.2% reproducibility |
10 |
| 2 | Ascorbic acid | Graphene doped carbon paste electrode | Low overvoltage, good current response and sensitivity, high response rate of 5s, and detection limit of 7
 10−8 M 10−8 M |
11 |
| 3 | Hydroquinone (HQ) and Catechol (CC) | Reduced graphene oxide nanosheet on glassy carbon electrode | Enhanced sensitivity, high reproducibility and stability, detection limits of 0.2,
 for determination of HQ and CC respectively for determination of HQ and CC respectively |
12 |
| 4 | Prostate Specific Antigen (PSA) | Graphene sheet - cobalt hexacyanoferrate nanoparticle - 1-pyrenebutanoic acid, succinimidyl (GS–CoNP–PBSE) on glassy carbon electrode | Label-free detection, high electroactivity, good stability, reproducibility (6.7% standard deviation) and selectivity (<8% current variation due to interfering substances) | 13 |
| 5 | Hemoglobin (Hb) | Graphene nanosheets (PDDA-G), poly (diallyldimethylammonium chloride), and room temperature ionic liquid (RTIL) nanocomposite | Superior electrocatalytic activity, biocompatibility and solubility, linear range from 0.2 – 32.6
 , detection limit of , detection limit of
 at at

|
14 |
| 6 | ssDNA (for detection of transgenic maize MON810) | Modified carbon ionic liquid electrode (using electrochemically reduced graphene) | Good stability, sensitivity and conductivity, simple fabrication procedure, low detection limit of
 mol/L ( mol/L (
 ) ) |
15 |
| 7 | Glucose | Glucose oxidase/Pt/functional graphene sheets/chitosan (GOD/Pt/FGS/chitosan) bionanocomposite film | Good sensitivity, reproducibility, stability and response, low detection limit of

|
16 |
B. Transition Metal Dichalcogenides (TMDs)
Among two dimensional materials, transition metal dichalcogenides (TMDs) garner significant research interest as some of these materials possess the desirable quality of having tunable bandgaps (indirect to direct), which resulting in some unique properties such as photoluminescence. In the family of TMDs, molybdenum disulfide (MoS2), molybdenum diselenide (MoSe2) tungsten disulfide (WS2) and tungsten diselenide (Wse2), have been extensively studied for use in sensors, with special focus on MoS2 due to its superior conductivity, fast electron transfer rate, and easy availability [17]. These advantages allow MoS2 to be efficiently used for many diverse applications, from energy storage and flexible electronics, to biological applications owing to its low toxicity and stable nature [18].
The structural defects present in MoS2 can be used for surface modifications or functionalization, and mono or few layer MoS2 nanosheets depict confinement effects, all of which result in enhanced properties for use in sensors. MoS2-based biosensors have been fabricated and reported to detect biomolecules such as DNA [19] and lactate [20]. Based on the type of MoS2, it may be semi-conducting with a tunable direct bandgap (2H) or metallic (1T) [21].
Lee et al. reported an MoS2 based label-free biosensor utilizing a simplified dielectric-free design for the detection of prostrate specific antigen (PSA) [22]. Huang et al. presented an electrochemical biosensor fabricated from MoS2 nanocomposites [23].
Thus, the unique properties of MoS2 combined with efficient fabrication methods offer exciting opportunities for application in optical, electronic, and electrochemical biosensors.
These MoS2-based biosensors have been summarized in tcolor table II for easy reference.
TABLE II. MoS2 Based Biosensors.
| S. NO. | ANALYTE | BIOSENSING ELEMENT | ADVANTAGES AND SENSOR CHARACTERISTICS | REFERENCE |
|---|---|---|---|---|
| 1 | DNA | Nano-MoS2 modified carbon paste electrode(nanoMoS2/CPE) | Label-free detection, high electrochemical activity, detection limit of 1.9
 10−17 M, good sensitivity, reproducibility and stability 10−17 M, good sensitivity, reproducibility and stability |
19 |
| 2 | Lactate | GC/MoS2/Lox (MoS2 nanosheets, exfoliated onto a glassy carbon electrode, along with lactate oxidase enzyme) | Linear range from 0.056 – 0.77 mM, sensitivity of
 AmM−1, detection limit of AmM−1, detection limit of
 and reproducibility (RSD) = 4.7% and reproducibility (RSD) = 4.7% |
20 |
| 3 | Prostate Specific Antigen (PSA) | Multilayer MoS2 FET | Oxide-free simple design, label-free detection, enhanced sensitivity, | 22 |
| 4 | BPA (bisphenol A) | MoS2 and chitosan-gold nanoparticles modified electrode | Enhanced sensitivity, long-term stability, selectivity and repeatability (RSD=2.53%), detection limit of
 M M |
23 |
C. Carbon Nanotubes (CNTs)
CNTs, another nanomaterial made of carbon, have been extensively studied for applications corresponding to a broad range of fields due to their superior properties. The C-C bond makes them the stiffest and most durable fiber, whether of a one atom thickness (SWCNTs) or consisting of several layers of graphite (MWCNTs). CNTs are also thermally stable and may be metallic or semiconducting based on the fabrication parameters [24]. Due to the surface structure of nanotubes, the adsorbed molecules directly influence its electronic properties, and this sensitivity is an essential characteristic for a sensor [25].
CNT-based biosensors usually consist of a sensitive element, which involves functionalization of the CNT with a specific biomolecule (such as proteins [26]), and a tranducer [27]. Villamizar et al. reported a bioFET consisting of a network of SWCNTs to enable rapid and sensitive detection of Salmonella Infantis and using appropriate antibodies, such a sensor can be extended for the application of sensing other viruses or bacteria [28].
Biosensors utilizing a combination of nanomaterials such as MoS2/MWCNTs have also been reported to combine the individual benefits of the materials [29].
CNT sensors may utilize inter-CNT (when sensing response is due to effects originating within the tubes), intra-CNT (when effects arise at contact points across tubes) or Schottky barrier (relating to effects between the tubes and electrodes) sensing mechanism. The dominant mechanism is dependent on the strength and type of the analyte, device architecture, as well as the defects in the CNT [30].
CNT-based sensors overcome the drawback of carrier migration around perturbed regions in graphene-based sensors, due to their metallic states. Further, CNTs can be functionalized in a noncovalent manner with small aromatic molecules, polymers, or metal nanoparticles to enhance specific sensor selectivity. Alternatively, by utilizing covalent functionalization approaches, the long-term stability, robustness and reproducibility of the sensors can be enhanced [30].
These CNT-based biosensors have been summarized in tcolor table III for easy reference
TABLE III. CNT Based Biosensors.
| S. NO. | ANALYTE | BIOSENSING ELEMENT | ADVANTAGES AND SENSOR CHARACTERISTICS | REFERENCE |
|---|---|---|---|---|
| 1 | Glucose | Bi-enzymatic CNT- poly(amidoamine) (PAMAM) dendrimer nano-composite | Mediator-free detection, high sensitivity, current response of 2200 nA mM−1, rapid response (1 s), wide linear response range, from
 - 1.2 mM, detection limit of - 1.2 mM, detection limit of

|
26 |
| 2 | Salmonella Infantis | Functionalized CNTFETs (network of SWCNTs acting as the conductor channel | High sensitivity, label-free detection, at least 100cfu/mL detected in 1hr, rapid response, similar design can be used to sense other pathogenic bacteria, or viruses if an appropriate molecular receptor is employed | 28 |
| 3 | Sub-femtomolar DNA | DNA probe on a gold nanoparticle and MoS2/MWCNT electrode, along with glucose oxidase | Good conductivity and signal amplification, high sensitivity and selectivity, linear range from 10 – 107 fM, simple fabrication and detection process | 29 |
D. Quantum Dots (QDs)
QDs refer to semiconductor nanostructures of sizes 1 to 10 nm confined in all three dimensions by potential barriers. Quantum confinement effect and a high surface-to-volume ratio cause QDs to exhibit optical and electronic properties that differ remarkably from their bulk counterparts. They are characterized by a broad absorption spectrum which increases in magnitude towards the shorter wavelengths, large Stokes shift and an approximate Gaussian shaped narrow emission band. Due to quantization effects, the bandgap of QDs increases with decreasing diameter. Thus, emission peak wavelength changes with QD size and material, as shown in Fig 1A. This property has been utilized in multicolor imaging and multiplex analyses.
Fig. 1.

A) With decrease in size of QDs the emission band peak shifts towards shorted wavelengths. B) Quantum dots consist of a core-shell structure. The surface maybe coated with a different kind of ligands for linking with molecules. Reprinted from Maysinger, D., Ji, J., Hutter, E., & Cooper, E. (2015). Nanoparticle-Based and Bioengineered Probes and Sensors to Detect Physiological and Pathological Biomarkers in Neural Cells. Frontiers in Neuroscience, 9. doi:10.3389/fnins.2015.00480, an open access source.
QDs have a large molar absorption coefficient, high fluorescence quantum yields with long excited state lifetimes and hence make excellent probes. Additionally, they exhibit superior resistance to chemical degradation, photobleaching and a high two-photon absorption cross section. Their optical properties are dependent on surface chemistry -the number of dangling bonds determines quantum yields and stability. Accordingly, QDS can be functionalized with organic capping ligands as per required application.
1). Traditional QDs:
Traditional QDs (TQDs) consist of II-VI, IV-VI and III-V semiconductors in a core-shell structure, as shown in Fig 2B, and have been popularly researched as optical transducers based on PL activation/quenching caused by physical and chemical interactions on the QD surface.
Fig. 2.
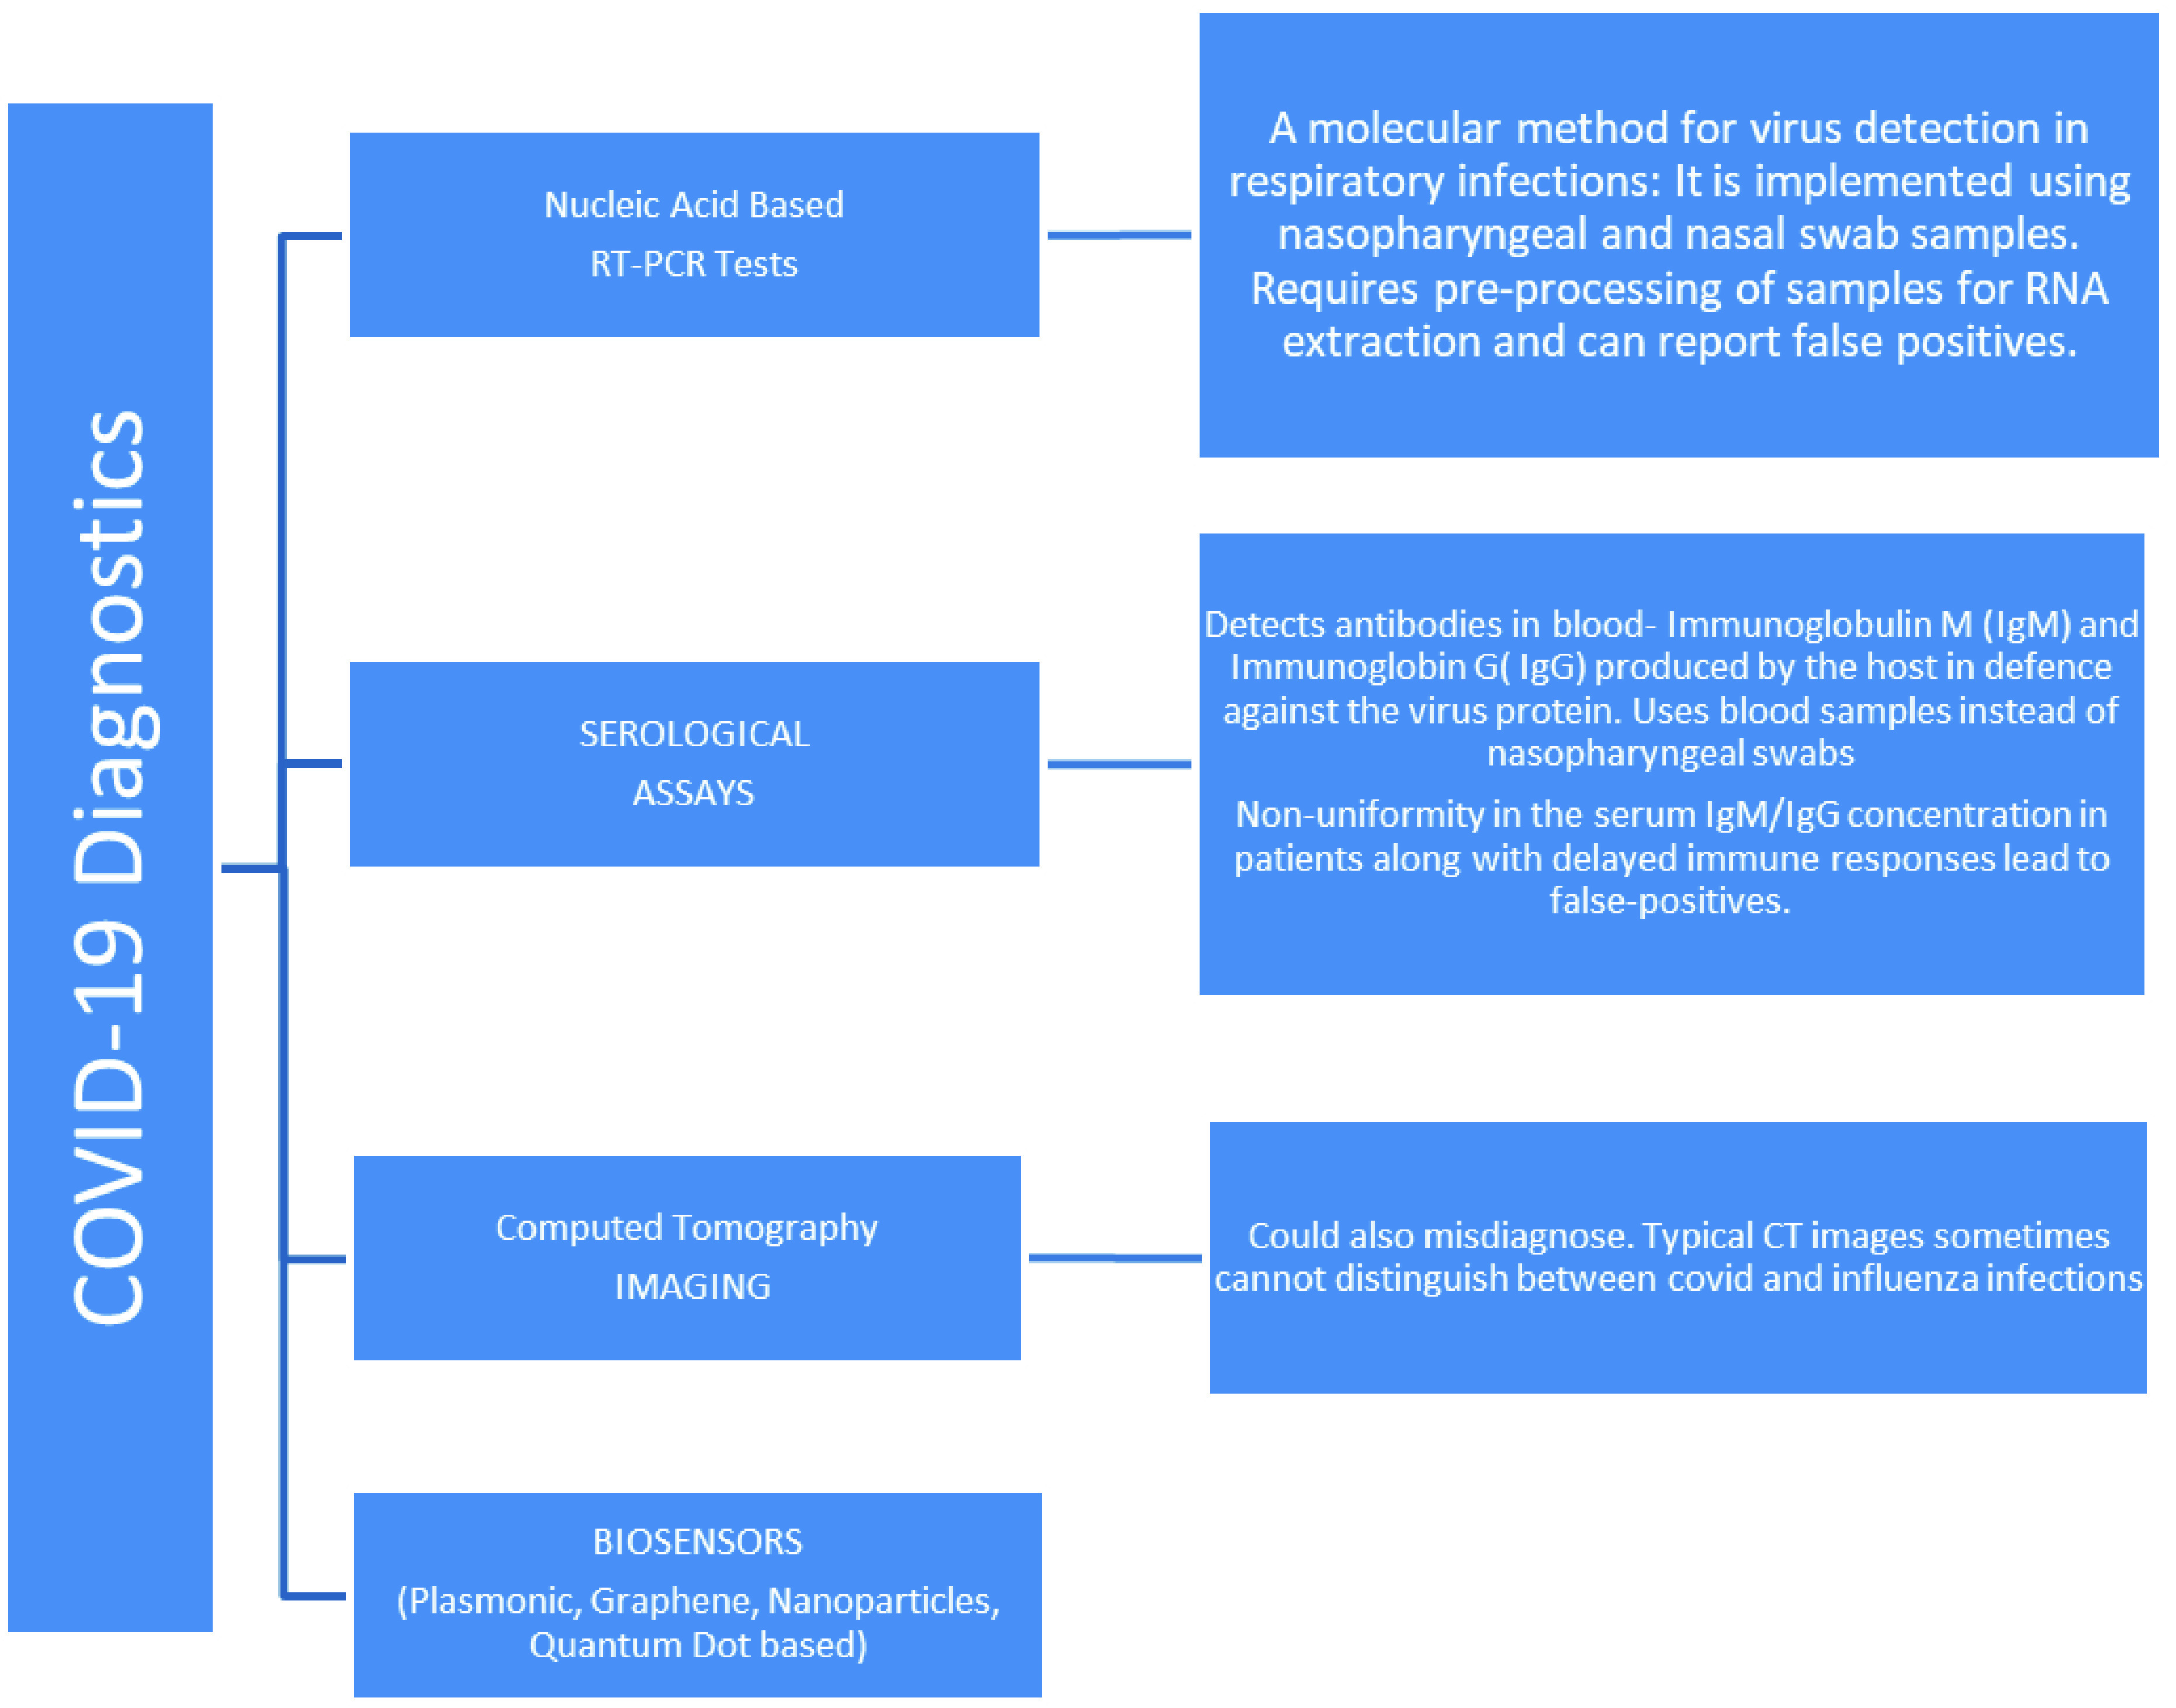
Methods employed for COVID-19 diagnosis.
Förster Resonance Energy Transfer (FRET) involves the energy transfer from a donor excited with radiation to an acceptor nearby in ground state, resulting in fluorescence of the donor decreasing and the acceptor increasing. Sensors with TQDs as acceptors in FRET process have been made for monitoring of DNA using oligonucleotide-modified QDs [31], sensing thrombin [32], nucleases via gold nanoparticle conjugated QDs [33], casein kinase [34] and acetylcholinesterase [35] using CdSe/ZnS QDs, multiplex sensing using streptavidin-coated QDs and gold nanoparticles [36] and identifying recombinant proteins with nickel-NTA (Nitrilotriacetic acid) conjugated CdT/CdS QDs [37]. Common nucleic acid detection methods involve FRET processes in QD-fluorophore systems, QD-QD systems, QD fluorescence quenching or target and QD-conjugate probe hybridization [38].
Similarly, TQDs as acceptors in BRET (Bioluminescence Resonance Energy Transfer) systems have been exploited for biosensing, such as glucose detection via CdTe QDs [39] and nucleic acid using carboxylated QDs [40], as well as in in vivo bioimaging applications [41]. Wang et al. developed a CuFe2O4 nanoparticles and ZnO composite for detection of toxic methylene blue molecules [42].
Apart from their use in optical transducers, TQDs find use in photoelectrochemical and gas sensors. Stretchable and humidity-resistant NO2 gas sensor using PbS colloidal QDs (CQDs) and graphene electrodes [43] and using SnS2 QD/graphene nanostructures [44] have been reported. H2S gas sensors fabricated using SnO2 CQDs - multiwalled carbon nanotubes (MWCNTs) composite [45] and NO2 and ethanol gas sensors using monoclinic WO3 QDs [46] have been reported. Photoelectrochemical sensors using TQDs are based on change in photocurrent due to chemical changes by enzymes, QD-protein interactions and binding reactions between biomolecules [47]. Reported applications include photoelectrochemical detection of acetylcholine [48], oxygen [49], epinephrine [50], and hydrogen [51], [52] to name a few. Although the use of TQDs in a range of biosensing and bioimaging applications has been explored, their cytotoxicity has been a cause of concern. Observed cytotoxic effects have been attributed to release of Cd2+ ions, aggregation of nanoparticles and presence of surface ligands that are cytotoxic. To overcome the issue of toxicity alternative QDs using InGaP, InP, carbon dots, graphene quantum dots etc. are being explored [53].
2). Carbon Dots (CDs):
CDs are QDs with a carbon core and a functional group shell. They exhibit a number of unique properties, inheriting the excellent optical and electronic properties of traditional QDs with desirable inherent properties such as high biocompatibility and low toxicity.
Fluorescent CD sensors use direct analyte-CD interactions, post functionalization of CDs and integration with other molecules. CD sensors for detection of iron, copper and mercury ions [54], catecholamines, dopamine and ascorbic acid [55], proteins and DNA via PL quenching have been developed. Detection of folate receptor positive cancer cells using folic acid - CDs probe [56], Escherichia coli has been detected using mannose-modified fluorescent CDs through the binding of the lectin units of the bacteria and mannose on the CDs and thus tagging the bacteria [57]. Similarly, papaya sourced water-soluble CDs for detection of the bacteria via the same mechanism has been reported [58].
Work has also been done on electrochemical and electrochemiluminescence sensor. Louleb et al. used N-CDs for dopamine detection in human fluids (serum and urine) [59]. Hydrogen bonding between the dopamine -NH3+ moiety and the surface ligands of the N-CDs caused quenching in the fluorescence of the N-CDs, the extent of which was measured and used to determine the concentration of dopamine. CD-nanomaterial combination for epinephrine, glucose, insulin, acetylcholine detection among other biomolecules has also been reported [60].
3). 2D-QDs:
Two-dimensional quantum dots consist of 2D-nanomaterials which consist of graphene, transition metal dichalcogenide (TMD), transition metal oxides, etc. reduced in lateral dimensions and exhibit novel properties along with most properties of their larger 2D form.
Functionalization of 2D-QDs allow for enhancing specific properties and thus for application in various sensors. Chemiluminescence sensors for uric acid and 4-nitrophenol detection, electrochemical sensors for microRNA and caffeic acid detection, and electrochemiluminescence sensors for detecting adenosine triphosphate, metal ions, microRNA and antigens based on 2D-QDs have been developed [61].
Electrochemical sensors based on graphene QDs explored include detection of metronidazole via molecularly imprinted polymers on GQDs and graphene nanoplatelets [62] and more recently, dopamine release detection with composite of GQDs and MWCNTs [63]. An electrode based on graphene QD assembled on gold electrode was developed by Zhang et al. which was able to detect H2O2 by measuring the current during the reduction of H2O2 through electrocatalysis [64].
These QD-based biosensors have been summarized in table IV.
TABLE IV. QD Based Biosensors.
| S. NO. | ANALYTE | BIOSENSING ELEMENT | MECHANISM | REFERENCE |
|---|---|---|---|---|
| 1 | DNA | Thiolated oligonucleotide modified mercaptopropionic acid stabilized CdSe/ZnS QDs | Fluorescent quenching of QDs due FRET process from QDs to dye molecules integrated by telomerase in DNA undergoing replication/telomerisation | 31 |
| 2 | Proteases | Gold nanoparticles tethered QDs via peptide sequence corresponding to target protease | Quenched fluorescent AuNP-QDs show strong emission due to disabled FRET process on account of breaking of peptide chain by target protease | 33 |
| 3 | Recombinant proteins | Carboxylated QDs covalently bound to primary amine group attached Ni2+ and NTA ligand | Detection by binding of fluorescent Ni-NTA QDs with histidine in the his-tagged proteins | 37 |
| 4 | Glucose | Luciferease enzyme-glucose binding protein (GBP) conjugated CdTe QDs | GBP separating QD and enzyme binds with glucose and shortens donor acceptor distance resulting in increase in BRET emission | 39 |
| 5 | Dopamine | Carbon dots Nitrogen doped CDs |
Quenching of fluorescent CDs due electron-hole nonradiative recombination Quenching due to H-bonding between the dopamine-NH3+ moiety and the surface ligands of the N-CDs |
55 59 |
| 6 | Cancer cells | Folic acid - CDs probe | Recovery of fluorescence due to folic acid leaving CD surface to combine with folate receptor on cancer cell | 56 |
| 7 | Escherichia coli | Mannose-modified fluorescent CDs | Tagging of bacteria by binding of the lectin units of the bacteria and mannose on the fluorescent CDs | 57 |
| 8 | microRNA | GQDs as horseradish peroxidase immobilization platform | Increase in current via HRP-GQD catalyzed electrochemical reduction of 3,
 ,5, ,5,
 -tetramethylbenzidine (TMB) -tetramethylbenzidine (TMB) |
61 |
| 9 | Metronidazole (MNZ) | Molecularly imprinted polymers (MIP) on GQDs and graphene nanoplatelet modified glassy carbon electrode (GCE) | MNZ accumulation on GQD-MIP recognition sites on electrode surface | 62 |
| 10 | Peroxide | Graphene QD assembled on gold electrode | Measurement of current due to reduction of H2O2 as it undergoes electrocatalysis | 64 |
III. Biosensors for COVID-19 Diagnosis
The first human cases of Severe Acute Respiratory Syndrome Coronavirus 2 (SARS-CoV-2) or COVID-19 were recorded in Wuhan, China in December, 2019 before the World Health Organization declared the global outbreak of the highly contagious virus a pandemic on March 11, 2020. [65]
Thanks to the continual medicine research traversing the spectrum, from early detection to the treatment- some even highlighting the very possibility of a disease outbreak in the years leading up to 2020 [66], we can rely on several techniques to detect COVID-19 [67], [68]. These include Nucleic Acid Tests-Gene based identification of viral genomic RNA using Reverse Transcription Polymerase Chain Reaction or RT-PCR tests as the gold standard, Serological Immunoassays adopted in conjunction with RT-PCR to get very high detection rates (98.6%) [69], [70], CT Imaging [71] and Biosensors. These are delineated in Fig 2. The current testing standards, however, present certain challenges. The description of the basic working along with advantages and disadvantages of the current diagnostics tests is as follows.
RT-PCR Tests detect viral RNA. Enzymes convert RNA to DNA, which is replicated billions of times due to temperature cycles in the PCR machine, followed by binding of fluorescent markers which give a positive result if the fluorescence crosses a threshold value.
As they only detect the presence of an active virus at the time of testing, RT-PCR tests do not indicate whether a patient had a past infection and has since recovered. They require sample pre-processing for RNA extraction, removing fats, proteins and other molecules present in nasopharyngeal and nasal swab samples. Additionally, given that the virus is distributed non-uniformly along the respiratory tract, negative tests results could also mean the absence of virus at the site of sample collection, not the absence of virus altogether. [72] Samples must be sent to a specialised laboratory from the point of collection/testing site, resulting in longer response time, typically 48 hours. False negatives results arise from incorrect sampling site of swab collection or insufficient viral material in the sample.
Despite the fact that these are generally considered highly sensitive for SARS-CoV-2 detection, sensitivity has been reported as low as 59% in [73], [74]. Reason for low sensitivity could be easy degradation of RNA which can be prevented by immediate frozen storage conditions. Therefore, mishandling samples could result in poor detection. During SARS-CoV-2 viral attack, the host RNA gets damaged and is released as fragments into the bloodstream, making their detection by RT-PCR challenging. Use of nanomaterials such as gold nanoparticles or fluorescent biomarkers can help isolate these RNA fragments and can overcome the detection problem by acting as signal enrichment tools. They typically have a shelf life upto 12 months. [75], [76]
Lateral flow assays (LFA), or the ‘Antibody’ tests as they are popularly called, work by detecting a person’s immune response to infection by the virus. Blood sample is mixed with a buffer liquid in the sample pad of the test strip to control the mobility. Moving across to the release pad, the sample analyte binds with antibodies conjugated with fluorescent nanoparticles, such as colloidal gold. Now containing the capturing antibody bound to the target analyte, the sample interacts with nitrocellulose membrane having multiple test lines, resulting in colorization of the appropriate test line, depending on the presence of Immunoglobulin M (IgM) or Immunoglobin G (IgG).
They present the advantage of a longer shelf life, upto 24 months [77], no need for refrigeration, easily understandable visual results, easier use for point of care use and elimination of the need for additional equipment for processing. Process from finger-stick to results takes within 30 minutes. Notably, they can help diagnose post infection conditions such as multisystem inflammatory syndrome [78].
One main research area is stemming from a shortcoming of LFA in conversion of visual data to quantitative results by digitization. Additionally, as analysis time is dependent on sample viscosity, there is no way to enhance test response using enzymes. Limit of sensitivity is introduced due to restriction on total volume of sample that is used [79]. Since research on COVID-19 virus is still in the development phase, there is no definite time period for which covid-19 antibodies can be believed to last. Thus, a negative test result does not rule out previous infection. Mild infection may not even develop detectable antibodies.
CT Scans: Chest CT Images of patients be atypical with the viral pneumonia infection images as the baseline. Images change at different stages of the disease, as recorded in many studies focusing on the manifestation of COVID-19 in lungs in the form of lobular and patchy ground glass opacities (GGOs), lesions, nodules or cavitation. [80]–[82]. This makes CT Scan a tool to monitor disease evolution.
CT Scans have the benefit of higher sensitivity than RT-PCR- 88% vs 59% and 98% vs 71% have been reported in [73], [74]. The process is simple and equipment easily available in hospitals, making this method a potential rapid screening tool, at least for initial screening, especially in places facing shortage of RT-PCR test kits. However, images obtained from CT Scans for a COVID-19 patient may resemble those obtained in case of influenza infections, making this method fatally unreliable in some cases. Exposure to radiation in CT Scans makes it potentially inapplicable for children and pregnant women. Although it shows high sensitivity, The chest CT appearance is thought to be non-specific- the accuracy in distinguishing covid-19 infection from non covid viral pneumonia, by comparing CT features of the two, has been reported as low as 60% [83].
One challenging area for radiologists is to differentiate between COVID-19 infection and symptoms arising from other pneumonia like infections or lung disorders.
Work done by various research groups working towards nanomaterials based biosensors has reportedly addressed some, although not all, of the above mentioned drawbacks. Pros of using NM based biosensors include rapid response, enhanced selectivity and sensitivity, portability and cost-effectiveness [84], [85]. Moreover, most nanomaterials can be appropriately functionalized to obtain enhanced properties and advantages, including biocompatibility, along with producing satisfactory reproducibility of the biosensors [86].
Despite these advantages, full potential is not yet harnessed for on-site applications, equipment is not widespread for commercial use and existing logistical support exists for standard tests only. Some key attributes that serve as points of comparison while considering nanobiosensors as detection tools complementary with the standard techniques are listed in the comparative table V presented below.
TABLE V. Comparison of Parameters for Standard COVID-19 Tests and Nanobiosensors.
| PARAMETER | RT-PCR | SEROLOGICAL IMMUNOASSAYS | COMPUTER TOMOGRAPHY SCANS | NANOBIOSENSORS |
|---|---|---|---|---|
| Sensitivity | 93% positive in bronchoalveolar lavage fluid [70] | 87.3% to 97.2% [70] | Higher sensitivity than RT-PCR- 88% vs 59% and 98% vs 71% [73], [74] | Very high sensitivity with detection limit as low as 10−18M [93] |
| Response Time | 48 hours | 30 minutes | 30–60 minutes | Real time detection in less than 30 seconds [121] |
| Reliability (Accuracy of Results) | False negatives results arising from incorrect site of swab collection or insufficient viral material in the sample | False negatives results arising from undetectable antibodies | False positive results due to non specificity: accuracy reported as low as 60% [83] | Shows promise to overcome to problem of false positives and negatives reported by the standard RT-PCR tests [105] |
| Portability | Test is done in specialised laboratories away from sample collection site | Lateral flow devices allow point of care testing | In specialised laboratories | Used as hand held devices for commercial POC applications |
In the direction of using biosensors for COVID-19 detection, there have been noteworthy developments, not least due to the fact that biosensors offer advantages of portability, sensitivity, and miniaturization as in the case of chip-based sensors along with small sample requirement. The sensing mechanism of a biosensor in general involves bio recognition elements, transducers and processor for data analysis, as shown in Fig 3. The biologically sensitive material acts like a template for detection while the transducer is responsible for converting the interaction between the bioanalyte an dits receptor into an electrical signal. Finally, the signal is appropriately filtered and amplified to be obtained as output. The Table-VI summarizes some recent advancement in sensors which have shown promise in responding to the novel coronavirus and is the subject of discussion for the following paragraphs.
Fig. 3.

Main Components of a Biosensor.
TABLE VI. Some Recently Developed Biosensors Showing Potential for SARS-COV-2.
| S. NO. | ANALYTE | BIOSENSING ELEMENT | ADVANTAGES | REFERENCE |
|---|---|---|---|---|
| 1 | S1 spike protein of SARS-CoV-2. | Membrane engineered cells electro inserted with human S1 antibody | Ultra rapid, differentiation between different protein concentrations, Detection in the incubation period/in asymptomatic cases | 74 |
| 2 | Nucleocapsid (N) protein of SARS-CoV-2 | Anti-N protein tagged gold NPs on U bent fiber optic probe | Minimal sample pre-processing, rapid, early detection even for low analyte concentration | 77 |
| 3 | RNA | Gold nano-islands grafted with which DNA receptors complementary to the viral RNA sequences | Real time monitoring of virus concentration in air | 82 |
| 4 | Viral proteins from blood/serum | Magnetic NP | Low background noise levels, portability | 102 |
| 5 | Viral spike protein | SARS-CoV-2 spike antibody immobilized graphene sheets | Highly specific and sensitive, detection of virus from clinical samples without preprocessing | 103 |
| 6 | Mitochondrial reactive oxygen species (ROS) in lung cells (from sputum samples) | Working electrode modified with MWCNTs | Monitoring viral infection in asymptomatic cases, real time and sensitive detection in less than 30 seconds. | 105 |
Notably, the S1 spike protein is a major facilitator to the entry of the virus, making anti-S antibodies diagnostic markers [87]. S1 detection reliably indicates the presence of the virus itself [88], [89], even in the incubation period and in asymptomatic cases. A novel bioelectrochemical sensor [90] employs membrane engineered cells electroinserted with human S1 antibody as the biorecognition element for detection of S1 spike protein of SARS-CoV-2. It responds to the binding of the antigens (target analytes-S1 protein) with the inserted antibodies on the cells, resulting in changes in cellular bioelectric properties. This low cost, ultra rapid biosensor allows for differentiation between different protein concentrations. With variation in Binding of the antibodies corresponding to different domains of the S1 subunit, the biosensor could also be used detect out the associated coronaviruses [91], [92].
A Fibre-Optic Absorbance Biosensor invented by researchers from IITM and named P-FAB, employs a multimode U bent fibre optic probe to detect nucleocapsid (N) protein of SARS-CoV-2 [93] from the non-invasive saliva samples [94]. The biosensor achieved a detection limit of 10−18 M, along with displaying benefits such as flexibility as well as sensitive and specific detection. The N protein, like the spike protein, is identified as a major structural protein of the SARS-Cov-2 with a high immunogenic activity, aiding viral RNA replication and present during early infection stages [95]. N protein from the saliva specimen with the detector antibodies (anti-N protein) in the bio-functionalised sensing region prompts a response measurable as absorbance change. A point of care device based on this biosensor has the potential for highly sensitive COVID detection [96], [97].
A novel optical biosensor designed to identify the RNA sequences of the SARS-CoV-2 [98], and aimed at real time monitoring of virus concentration in air, has been shown to be responsive towards SARS-CoV and exhibits the ability to distinguish between RNA of SARS-CoV and SARS-CoV-2, closely related viruses with slightly varying RNA sequences. It consists of gold nanoislands upon which DNA receptors complementary to the RNA sequences of the virus, are grafted. Molecules binding to the functionalised nanostructure help determine the presence of said RNA.
Similar plasmonic biosensors using the combined Plasmonic Photothermal (PPT) and localized surface plasmon resonance (LSPR) effects are being explored for use in clinical diagnostics [99]–[103]. They are highly flexible in the choice of substrate material-from metallic nanoparticles such as gold to 2D films consisting of graphene and silicon nanowires, a number of structures easily fabricated in laboratories provide the required biocompatibility [104]. The dual function LSPR biosensor developed by Qiu et al. is particularly noteworthy due to its high selectivity and sensitivity for detecting SARS-CoV-2, with a low detection limit (0.22 pm concentration). Such a biosensor can aid in overcoming the problem of false positives or negatives reported by the standard RT-PCR tests [105].
Nanoparticles (NPs), as a consequence of their remarkable optical properties, can act as fluorescent probes for biomolecular imaging and detection [106]–[109]. Nanosensing systems based on Gold, Carbon, Silica and magnetic NPs in addition to Quantum Dots, have been extensively explored in relation with cellular detection and monitoring of diseases [110]–[118].
Functionalization using surface engineering on nanoparticles could be a useful tool to target the novel coronavirus. An exciting approach is the use of magnetic NP (MNP) based biosensors operating on the principle of giant magnetoresistance (GMR) for SARS-CoV-2 detection [118]; spin interactions between MNP and non-magnetic viral proteins are responsible for changes in resistance and therefore, magnetization. Magnetic signals detected this way contain low background noise levels due to largely non-magnetic nature of samples such as blood, serum, etc. These GMR based sensors can be translated into portable devices.
Graphene and its derivatives- Graphene oxide (GO), nano-size GO called Graphene QD, few-layer graphene, fluorographene, to name a few- are useful in their roles as components of biosensing systems. For all its interesting characteristics, Graphene is inherently inert with zero band gap, necessitating chemical functionalization using organic and inorganic molecules. Controlling its electronic behaviour by chemical modification would mean tuning the band gap, allowing its application in nanoelectronic devices. Recently, a field effect transistor (FET) based biosensing device making use of surface modified graphene sheets was introduced as a SARS-CoV-2 detector. Viral spike protein being the diagnostic antigen, the device was functionalised with receptors composed of SARS-CoV-2 spike antibody; the results demonstrated reliable detection of the antigen in cultured virus as well as clinical samples [119].
One major side effect reported for COVID-19 virus is the induction of mitochondrial reactive oxygen species (ROS) in lung cells [120]. Thus, a new approach based on sensing the level of ROS-responsible for activation of the NLRP3 inflammasome, a component of the innate immune system- has been introduced by researchers in Iran [121], [122]. It utilizes an electrochemical sensor fabricated using MWCNTs modified electrodes to measure the ROS in fresh sputum samples from patients. The notable advantages of this sensor include its ability to diagnose the viral infection in asymptomatic cases, by simply responding to the changes in ROS levels in the sputum, and the possibility of real time detection of the disease in less than 30 seconds. The tests already conducted on patients show promising results with regard to accuracy and sensitivity, providing a reasonable basis for comparison with the existing clinical tests.
IV. Challenges Ahead
A biosensor requires many capabilities such as high specificity and high sensitivity so that it is able to identify the right analyte in the midst of any other similar contaminants or analytes present. It must be non-toxic to allow use in biological systems and disposable to avoid transfer of infectious diseases. Other requirements include capacity for multiplex sensing of biomolecules for higher accuracy, fast response time with short postprocessing procedures, a long life and cost effectiveness as to increase affordability of the biosensor. Existing biosensors are restricted due to their inability to achieve one or more of the mentioned requirements at the commercial stage and hence the ongoing research is focused on overcoming these limitations to make more accurate and sensitive sensors.
To be able to use graphene-based sensors for widespread commercial purposes, research efforts are focused at finding effective capturing agents to bind target molecules to the sensor surface and looking for solutions to the problem of the susceptibility of graphene’s electrical conductivity to environmental changes, which hinder reliable and regular sensing process and results [123]. For biological applications, CNTs are functionalized with bioreceptors such as proteins or other microorganisms to result in CNT-bioFETs. While such devices offer significant advantages, one limitation is the background electrostatic noise, which can limit the performance of the sensor [124]. Some of the potential challenges when employing QDs as imaging probes include QDs with sizes less than 5nm being eliminated by renal filtration [125]. Additionally, toxicity studies of the nanoparticle cores used as sensor components could reveal the extent of their biocompatibility in biological systems [126], [127].
Notably, graphene and its aforementioned derivatives, beyond the well-researched applications in electronics, are noteworthy candidates for biomedical purposes as well, for instance in drug delivery [128], gene therapy [129], DNA sequencing [130], bio-imaging [131] and biosensing [132]. Considering the impact of biosensors in detection and management of infectious diseases, it will be worthwhile to overcome the current challenges related to their sensitivity, specificity, portability for point of care devices and cost upon commercialization. Current research in biosensors thus aims to develop robust biosensors capable of regeneration for reuse to allow use over a long time reduce cost issues. The key to developing better and more powerful biosensors seems to lie in the effective combination of polymers, nanomaterials and biology.
Biographies

Sakshi Sharma received the bachelor’s degree in engineering physics from the Delhi Technological University (DTU), New Delhi, India, in 2020. In addition to carrying out research as a part of the Nano Fabrication Lab Group, DTU, she has acquired research experience as a part of multiple project groups in several esteemed organizations, i.e., Defense Research and Development Organization (DRDO), Inter University Accelerator Centre, and Indian Institute of Technology (IIT-Delhi). Her primary area of research has been studying the properties dealing with structural, electronic, and magnetic aspects of fabricated low dimensional materials by employing characterization techniques as well as computational modeling. Her interests for the M.S. degree are aligned with engineering nanostructured materials for performance enhancement as well as miniaturization in electronics.

Sonakshi Saini received the B.Tech. degree in engineering physics from Delhi Technological University, India, in 2020. She is currently pursuing the master’s degree with the Department of Materials Science and Engineering, Georgia Institute of Technology, Atlanta, GA, USA. She has undertaken research projects and internships at prestigious organizations in India such as the CSIR-National Physical Laboratory (NPL), Defense Research and Development Organization (DRDO), and Central Electronics Limited (CEL). She is primarily interested in the synthesis and characterization of novel materials as well as materials for sustainable energy, especially solar cells and batteries.

Maya Khangembam received the B.Tech. degree in engineering physics from Delhi Technological University, New Delhi, India, in 2020. She has undertaken internships in Defense Research and Development Organization (DRDO) and Oil and Natural Gas Corporation (ONGC). Her current research interests lie in the synthesis and characterization of novel materials, optimization techniques, and computer modeling of materials for practical applications.

Vinod Singh (Member, IEEE) received the M.Sc. degree in physics from the University of Rajasthan, Jaipur, and the Ph.D. degree in physics from the Indian Institute of Technology (IIT) Delhi. He is currently an Associate Professor with the Department of Applied Physics, Delhi Technological University, New Delhi, India. He was honored with the University Gold Medal in both the B.Sc. and M.Sc. He has the teaching, research, and academic administrative experience of more than 17 years. He has been awarded the Research Excellence Award by DTU for two consecutive years, in 2017 and 2018, respectively, and the Best Presentation Award in Nano India 2017 Conference. He has delivered more than ten invited talks in international and national academic events. He is the Principal Investigator of two sponsored research projects funded by the All India Council for Technical Education and DTU. He was the Convener of a reputed International Conference on Atomic, Molecular, Optical, and Nano Physics with Applications (CAMNP-2019) held in December 2019 at DTU and is the Editor of Springer’s proceedings in physics for CAMNP-2019. Along with holding the position of an editorial board member of Frontiers in Sensors, he is also a member of the Departmental Research Committee (DRC) and the Board of Studies (BOS) of the Department. He is an active researcher, supervising six Ph.D. scholars and has published a patent (granted) and several research papers in international peer-reviewed journals of high repute, including Nature Publishing Group. His research interests include material science, sensors, 2D materials, functional nanomaterials, and their size-dependent properties and applications.
Funding Statement
Thisworkwas supported in part by the Delhi Technological University under the scheme “Research project grant to the faculty of DTU” under Grant DTU/IRD/619/2019/2127; and in part by the AICTE under the scheme “Research Promotion Scheme” under Grant 8-123/FDC/RPS(POLICY-1)/2019-2020.
References
- [1].Vargas-Bernal R., “Electrical properties of two-dimensional materials used in gas sensors,” Sensors, vol. 19, no. 6, p. 1295, Mar. 2019, doi: 10.3390/s19061295. [DOI] [PMC free article] [PubMed] [Google Scholar]
- [2].Jia B., “2D optical materials and the implications for photonics,” APL Photon., vol. 4, no. 8, Aug. 2019, Art. no. 080401, doi: 10.1063/1.5120030. [DOI] [Google Scholar]
- [3].Jiang H., Zheng L., Liu Z., and Wang X., “Two-dimensional materials: From mechanical properties to flexible mechanical sensors,” InfoMat, vol. 2, no. 6, pp. 1077–1094, Nov. 2020, doi: 10.1002/inf2.12072. [DOI] [Google Scholar]
- [4].Chang Y.-Y., Han H. N., and Kim M., “Analyzing the microstructure and related properties of 2D materials by transmission electron microscopy,” Appl. Microsc., vol. 49, no. 1, p. 10, Dec. 2019, doi: 10.1186/s42649-019-0013-5. [DOI] [PMC free article] [PubMed] [Google Scholar]
- [5].Late D. J., Bhat A., and Rout C. S., “Fundamentals and properties of 2D materials in general and sensing applications,” in Fundamentals and Sensing Applications of 2D Materials. Sawston, U.K.: Woodhead, 2019, pp. 5–24. [Google Scholar]
- [6].Morgan H., Rout C. S., and Late D. J., “Future prospects of 2D materials for sensing applications,” in Fundamentals and Sensing Applications of 2D Materials. Sawston, U.K.: Woodhead Publishing, 2019, pp. 481–482. [Google Scholar]
- [7].Mackin C.et al. , “Chemical sensor systems based on 2D and thin film materials,” 2D Mater., vol. 7, no. 2, Feb. 2020, Art. no. 022002, doi: 10.1088/2053-1583/ab6e88. [DOI] [Google Scholar]
- [8].Yavari F. and Koratkar N., “Graphene-based chemical sensors,” J. Phys. Chem. Lett., vol. 3, no. 13, pp. 1746–1753, Jul. 2012, doi: 10.1021/jz300358t. [DOI] [PubMed] [Google Scholar]
- [9].Atta N., El-Ads E., and Galal A., Graphene—A Platform for Sensor and Biosensor Applications, Biosensors—Micro and Nanoscale Applications, Toonika Rinken. London, U.K.: IntechOpen, 2015, pp. 38–84. [Google Scholar]
- [10].Kang X., Wang J., Wu H., Liu J., Aksay I. A., and Lin Y., “A graphene-based electrochemical sensor for sensitive detection of paracetamol,” Talanta, vol. 81, no. 3, pp. 754–759, May 2010, doi: 10.1016/j.talanta.2010.01.009. [DOI] [PubMed] [Google Scholar]
- [11].Li F., Li J., Feng Y., Yang L., and Du Z., “Electrochemical behavior of graphene doped carbon paste electrode and its application for sensitive determination of ascorbic acid,” Sens. Actuators B, Chem., vol. 157, no. 1, pp. 110–114, Sep. 2011, doi: 10.1016/j.snb.2011.03.033. [DOI] [Google Scholar]
- [12].Chen L., Tang Y., Wang K., Liu C., and Luo S., “Direct electrodeposition of reduced graphene oxide on glassy carbon electrode and its electrochemical application,” Electrochemistry Commun., vol. 13, no. 2, pp. 133–137, Feb. 2011, doi: 10.1016/j.elecom.2010.11.033. [DOI] [Google Scholar]
- [13].Li T., Yang M., and Li H., “Label-free electrochemical detection of cancer marker based on graphene–cobalt hexacyanoferrate nanocomposite,” J. Electroanal. Chem., vol. 655, no. 1, pp. 50–55, May 2011, doi: 10.1016/j.jelechem.2011.02.009. [DOI] [Google Scholar]
- [14].Liu K., Zhang J., Yang G., Wang C., and Zhu J.-J., “Direct electrochemistry and electrocatalysis of hemoglobin based on poly(diallyldimethylammonium chloride) functionalized graphene sheets/room temperature ionic liquid composite film,” Electrochemistry Commun., vol. 12, no. 3, pp. 402–405, Mar. 2010, doi: 10.1016/j.elecom.2010.01.004. [DOI] [Google Scholar]
- [15].Sun W.et al. , “Electrochemical sensor for transgenic maize MON810 sequence with electrostatic adsorption DNA on electrochemical reduced graphene modified electrode,” Sens. Actuators B, Chem., vol. 202, pp. 160–166, Oct. 2014, doi: 10.1016/j.snb.2014.05.072. [DOI] [Google Scholar]
- [16].Wu H.et al. , “Glucose biosensor based on immobilization of glucose oxidase in platinum nanoparticles/graphene/chitosan nanocomposite film,” Talanta, vol. 80, no. 1, pp. 403–406, Nov. 2009, doi: 10.1016/j.talanta.2009.06.054. [DOI] [PubMed] [Google Scholar]
- [17].Anichini C., Czepa W., Pakulski D., Aliprandi A., Ciesielski A., and Samorì P., “Chemical sensing with 2D materials,” Chem. Soc. Rev., vol. 47, no. 13, pp. 4860–4908, 2018, doi: 10.1039/c8cs00417j. [DOI] [PubMed] [Google Scholar]
- [18].Sonakshi Saini S. S., Khangembam M., and Singh V., “Structural analysis of the chemical vapour deposition grown molyb-denum disulphide nanofilms for multifaceted applications,” Indian J. Sci. Technol., vol. 13, no. 29, pp. 2973–2980, 2020, doi: 10.17485/IJST/v13i29.1215. [DOI] [Google Scholar]
- [19].Wang X., Nan F., Zhao J., Yang T., Ge T., and Jiao K., “A label-free ultrasensitive electrochemical DNA sensor based on thin-layer MoS₂ nanosheets with high electrochemical activity,” Biosens Bioelectron, vol. 64, pp. 386–391, Feb. 2015, doi: 10.1016/j.bios.2014.09.030. [DOI] [PubMed] [Google Scholar]
- [20].Parra-Alfambra A. M., Casero E., Vázquez L., Quintana C., del Pozo M., and Petit-Domínguez M. D. “MoS₂ nanosheets for improving analytical performance of lactate biosensors,” Sens. Actuators B, Chem., vol. 274, pp. 310–317, Nov. 2018, doi: 10.1016/j.snb.2018.07.124. [DOI] [Google Scholar]
- [21].Zhang W., Zhang P., Su Z., and Wei G., “Synthesis and sensor applications of MoS₂-based nanocomposites,” Nanoscale, vol. 7, no. 44, pp. 18364–18378, 2015, doi: 10.1039/c5nr06121k. [DOI] [PubMed] [Google Scholar]
- [22].Lee J.et al. , “Two-dimensional layered MoS₂ biosensors enable highly sensitive detection of biomolecules,” Sci. Rep., vol. 4, no. 1, p. 7352, Dec. 2014, doi: 10.1038/srep07352. [DOI] [PMC free article] [PubMed] [Google Scholar]
- [23].Huang K.-J., Liu Y.-J., Liu Y.-M., and Wang L.-L., “Molybdenum disulfide nanoflower-chitosan-Au nanoparticles composites based electrochemical sensing platform for bisphenol a determination,” J. Hazardous Mater., vol. 276, pp. 207–215, Jul. 2014, doi: 10.1016/j.jhazmat.2014.05.037. [DOI] [PubMed] [Google Scholar]
- [24].Wang Y. and Yeow J. T. W., “A review of carbon nanotubes-based gas sensors,” J. Sensors, vol. 2009, pp. 1–24, 2009, doi: 10.1155/2009/493904. [DOI] [Google Scholar]
- [25].Zaporotskova I. V., Boroznina N. P., Parkhomenko Y. N., and Kozhitov L. V., “Carbon nanotubes: Sensor properties. A review,” Modern Electron. Mater., vol. 2, no. 4, pp. 95–105, Dec. 2016, doi: 10.1016/j.moem.2017.02.002. [DOI] [Google Scholar]
- [26].Zeng Y.-L.et al. , “Functionalization of multi-walled carbon nanotubes with poly(amidoamine) dendrimer for mediator-free glucose biosensor,” Electrochemistry Commun., vol. 9, no. 1, pp. 185–190, Jan. 2007, doi: 10.1016/j.elecom.2006.08.052. [DOI] [Google Scholar]
- [27].Yang N., Chen X., Ren T., Zhang P., and Yang D., “Carbon nanotube based biosensors,” Sens. Actuators B, Chem., vol. 207, pp. 690–715, Feb. 2015, doi: 10.1016/j.snb.2014.10.040. [DOI] [Google Scholar]
- [28].Villamizar R. A., Maroto A., Rius F. X., Inza I., and Figueras M. J., “Fast detection of Salmonella Infantis with carbon nanotube field effect transistors,” Biosens Bioelectron, vol. 24, no. 2, pp. 279–283, Oct. 2008, doi: 10.1016/j.bios.2008.03.046. [DOI] [PubMed] [Google Scholar]
- [29].Huang K.-J., Liu Y.-J., Wang H.-B., Wang Y.-Y., and Liu Y.-M., “Sub-femtomolar DNA detection based on layered molybdenum disulfide/multi-walled carbon nanotube composites, au nanoparticle and enzyme multiple signal amplification,” Biosensors Bioelectron., vol. 55, pp. 195–202, May 2014, doi: 10.1016/j.bios.2013.11.061. [DOI] [PubMed] [Google Scholar]
- [30].Schroeder V., Savagatrup S., He M., Lin S., and Swager T. M., “Carbon nanotube chemical sensors,” Chem. Rev., vol. 119, no. 1, pp. 599–663, Jan. 2019, doi: 10.1021/acs.chemrev.8b00340. [DOI] [PMC free article] [PubMed] [Google Scholar]
- [31].Patolsky F., Gill R., Weizmann Y., Mokari T., Banin U., and Willner I., “Lighting-up the dynamics of telomerization and DNA replication by CdSe-ZnS quantum dots,” J. Amer. Chem. Soc., vol. 125, no. 46, pp. 13918–13919, 2003, doi: 10.1021/ja035848c. [DOI] [PubMed] [Google Scholar]
- [32].Levy M., Cater S. F., and Ellington A. D., “Quantum-dot aptamer beacons for the detection of proteins,” Chembiochem, vol. 6, no. 12, pp. 2163–2166, Dec. 2005, doi: 10.1002/cbic.200500218. [DOI] [PubMed] [Google Scholar]
- [33].Chang E.et al. , “Protease-activated quantum dot probes,” Biochem. Biophysical Res. Commun., vol. 334, no. 4, pp. 1221–1317, Sep. 2005, doi: 10.1016/j.bbrc.2005.07.028. [DOI] [PubMed] [Google Scholar]
- [34].Freeman R., Finder T., Gill R., and Willner I., “Probing protein kinase (CK₂) and alkaline phosphatase with CdSe/ZnS quantum dots,” Nano Lett, vol. 10, no. 6, pp. 2192–2196, Jun. 2010, doi: 10.1021/nl101052f. [DOI] [PubMed] [Google Scholar]
- [35].Buiculescu R., Hatzimarinaki M., and Chaniotakis N. A., “Biosilicated CdSe/ZnS quantum dots as photoluminescent transducers for acetylcholinesterase-based biosensors,” Anal Bioanal Chem, vol. 398, nos. 7–8, pp. 3015–3021, Dec. 2010, doi: 10.1007/s00216-010-4253-z. [DOI] [PubMed] [Google Scholar]
- [36].Liu Lee J. J. H. and Y L., “Quantum dot encoding of aptamer-linked nanostructures for one-pot simultaneous detection of multiple analytes,” Anal. Chem., vol. 11, no. 79, pp. 4120–4125, 2007, doi: 10.1021/ac070055k. [DOI] [PubMed] [Google Scholar]
- [37].Bae P. K., Kim K. N., Lee S. J., Chang H. J., Lee C. K., and Park J. K., “The modification of quantum dot probes used for the targeted imaging of his-tagged fusion proteins,” Biomaterials, vol. 30, no. 5, pp. 836–842, Feb. 2009, doi: 10.1016/j.biomaterials.2008.10.049. [DOI] [PubMed] [Google Scholar]
- [38].Chaniotakis N. and Buiculescu R., “Semiconductor quantum dots in chemical sensors and biosensors,” in Nanosensors for Chemical and Biological Applications. Cambridge, U.K.: Woodhead, 2014, pp. 267–294. [Google Scholar]
- [39].Hwang E., “Bioluminescence resonance energy transfer (BRET)-based nanostructured biosensor for detection of glucose,” M.S. thesis, Dept. Biomed. Eng., Univ. Western Ontario, London, ON, Canada, 2019, vol. 6782. [Google Scholar]
- [40].Kumar M., Zhang D., Broyles D., and Deo S. K., “A rapid, sensitive, and selective bioluminescence resonance energy transfer (BRET)-based nucleic acid sensing system,” Biosens Bioelectron, vol. 30, no. 1, pp. 9–133, Dec. 2011, doi: 10.1016/j.bios.2011.08.043. [DOI] [PubMed] [Google Scholar]
- [41].Hwang E., Song J., and Zhang J., “Integration of nanomaterials and bioluminescence resonance energy transfer techniques for sensing biomolecules,” Biosensors, vol. 9, no. 1, p. 42, Mar. 2019, doi: 10.3390/bios9010042. [DOI] [PMC free article] [PubMed] [Google Scholar]
- [42].Wang R., Guo M., Hu Y., Zhou J., Wu R., and Yang X., “A molecularly imprinted fluorescence sensor based on the ZnO quantum dot core–shell structure for high selectivity and photolysis function of methylene blue,” ACS Omega, vol. 5, no. 32, pp. 20664–20673, Aug. 2020, doi: 10.1021/acsomega.0c03095. [DOI] [PMC free article] [PubMed] [Google Scholar]
- [43].Song Z.et al. , “Fully stretchable and humidity-resistant quantum dot gas sensors,” ACS Sensors, vol. 3, no. 5, pp. 1048–1055, May 2018, doi: 10.1021/acssensors.8b00263. [DOI] [PubMed] [Google Scholar]
- [44].Huang Y., Jiao W., Chu Z., Nie X., Wang R., and He X., “SnS₂ quantum dot-based optoelectronic flexible sensors for ultrasensitive detection of NO₂ down to 1 ppb,” ACS Appl. Mater. Interfaces, vol. 12, no. 22, pp. 25178–25188, Jun. 2020, doi: 10.1021/acsami.0c05240. [DOI] [PubMed] [Google Scholar]
- [45].Liu H.et al. , “Solution-processed gas sensors employing SnO₂ quantum Dot/MWCNT nanocomposites,” ACS Appl Mater Interfaces, vol. 8, no. 1, pp. 840–846, Jan. 2016, doi: 10.1021/acsami.5b10188. [DOI] [PubMed] [Google Scholar]
- [46].Epifani M.et al. , “Solvothermal, chloroalkoxide-based synthesis of monoclinic WO₃ quantum dots and gas-sensing enhancement by surface oxygen vacancies,” ACS Appl Mater Interfaces, vol. 6, no. 19, pp. 16808–16816, Oct. 2014, doi: 10.1021/am504158r. [DOI] [PubMed] [Google Scholar]
- [47].Yue Z.et al. , “Quantum-dot-based photoelectrochemical sensors for chemical and biological detection,” ACS Appl Mater Interfaces, vol. 5, no. 8, pp. 2800–2814, Apr. 2013, doi: 10.1021/am3028662. [DOI] [PubMed] [Google Scholar]
- [48].Pardo-Yissar V., Katz E., Wasserman J., and Willner I., “Acetylcholine esterase-labeled CdS nanoparticles on electrodes: Photoelectrochemical sensing of the enzyme inhibitors,” J. Amer. Chem. Soc., vol. 125, no. 3, pp. 622–623, Jan. 2003, doi: 10.1021/ja028922k. [DOI] [PubMed] [Google Scholar]
- [49].Shamirian A., Samareh Afsari H., Hassan A., Miller L. W., and Snee P. T., “In vitro detection of hypoxia using a ratiometric quantum dot-based oxygen sensor,” ACS Sensors, vol. 1, no. 10, pp. 1244–1250, Oct. 2016, doi: 10.1021/acssensors.6b00452. [DOI] [PMC free article] [PubMed] [Google Scholar]
- [50].Freires A. S., dos Reis Lima F. M., Yotsumoto-Neto S., Silva S. M., Damos F. S., and de Cássia Silva Luz R., “Exploiting CdSe/ZnS core-shell photocatalyst modified with cytochrome c for epinephrine determination in drugs utilized in cardiopulmonary resuscitation,” Microchemical J., vol. 139, pp. 18–23, Jun. 2018, doi: 10.1016/j.microc.2018.02.008. [DOI] [Google Scholar]
- [51].Sharma R., Kodan N., Singh V., Sharma S. N., and Sinha O. P., “Enhanced photoelectrochemical performance of TiO₂ photoanode decorated with Pd-carbon core shell nanoparticles,” Renew. Energy, vol. 134, pp. 1232–1239, Apr. 2019, doi: 10.1016/j.renene.2018.09.061. [DOI] [Google Scholar]
- [52].Singh V., Dhall S., Kaushal A., and Mehta B. R., “Room temperature response and enhanced hydrogen sensing in size selected Pd-C core-shell nanoparticles: Role of carbon shell and Pd-C interface,” Int. J. Hydrogen Energy, vol. 43, no. 2, pp. 1025–1033, Jan. 2018, doi: 10.1016/j.ijhydene.2017.11.143. [DOI] [Google Scholar]
- [53].Resch-Genger U., Grabolle M., Cavaliere-Jaricot S., Nitschke R., and Nann T., “Quantum dots versus organic dyes as fluorescent labels,” Nature Methods, vol. 5, no. 9, pp. 763–775, Sep. 2008, doi: 10.1038/nmeth.1248. [DOI] [PubMed] [Google Scholar]
- [54].Patir K. and Gogoi S. K., “Nitrogen-doped carbon dots as fluorescence ON–OFF–ON sensor for parallel detection of copper(ii) and mercury(ii) ions in solutions as well as in filter paper-based microfluidic device,” Nanosc. Adv., vol. 1, no. 2, pp. 592–601, Feb. 2019, doi: 10.1039/c8na00080h. [DOI] [PMC free article] [PubMed] [Google Scholar]
- [55].Baruah U., Gogoi N., Konwar A., Jyoti Deka M., Chowdhury D., and Majumdar G., “Carbon dot based sensing of dopamine and ascorbic acid,” J. Nanoparticles, vol. 2014, pp. 1–8, 2014, doi: 10.1155/2014/178518. [DOI] [Google Scholar]
- [56].Liu Q.et al. , “Distinguish cancer cells based on targeting turn-on fluorescence imaging by folate functionalized green emitting carbon dots,” Biosensors Bioelectronics, vol. 64, pp. 25–119, Feb. 2015, doi: 10.1016/j.bios.2014.08.052. [DOI] [PubMed] [Google Scholar]
- [57].Weng C.-I.et al. , “One-step synthesis of biofunctional carbon quantum dots for bacterial labeling,” Biosensors Bioelectron., vol. 68, pp. 1–6, Jun. 2015, doi: 10.1016/j.bios.2014.12.028. [DOI] [PubMed] [Google Scholar]
- [58].Wang N., Wang Y., Guo T., Yang T., Chen M., and Wang J., “Green preparation of carbon dots with papaya as carbon source for effective fluorescent sensing of iron (III) and escherichia coli,” Biosensors Bioelectron., vol. 85, pp. 68–75, Nov. 2016, doi: 10.1016/j.bios.2016.04.089. [DOI] [PubMed] [Google Scholar]
- [59].Louleb M.et al. , “Detection of dopamine in human fluids using N-Doped carbon dots,” ACS Appl. Nano Mater., vol. 3, no. 8, pp. 8004–8011, Aug. 2020, doi: 10.1021/acsanm.0c01461. [DOI] [Google Scholar]
- [60].Li P.et al. , “Group IV nanodots: Newly emerging properties and application in biomarkers sensing,” TrAC Trends Anal. Chem., vol. 131, Oct. 2020, Art. no. 116007, doi: 10.1016/j.trac.2020.116007. [DOI] [Google Scholar]
- [61].Xu Y., Wang X., Zhang W. L., Lv F., and Guo S., “Recent progress in two-dimensional inorganic quantum dots,” Chem. Soc. Rev., vol. 47, no. 2, pp. 586–625, 2018, doi: 10.1039/c7cs00500h. [DOI] [PubMed] [Google Scholar]
- [62].Ensafi A. A., Nasr-Esfahani P., and Rezaei B., “Metronidazole determination with an extremely sensitive and selective electrochemical sensor based on graphene nanoplatelets and molecularly imprinted polymers on graphene quantum dots,” Sens. Actuators B, Chem., vol. 270, pp. 192–199, Oct. 2018, doi: 10.1016/j.snb.2018.05.024. [DOI] [Google Scholar]
- [63].Huang Q., Lin X., Tong L., and Tong Q.-X., “Graphene quantum Dots/Multiwalled carbon nanotubes composite-based electrochemical sensor for detecting dopamine release from living cells,” ACS Sustain. Chem. Eng., vol. 8, no. 3, pp. 1644–1650, Jan. 2020, doi: 10.1021/acssuschemeng.9b06623. [DOI] [Google Scholar]
- [64].Zhang Y.et al. , “Graphene quantum dots/gold electrode and its application in living cell H₂O₂ detection,” Nanoscale, vol. 5, no. 5, pp. 1816–1819, Mar. 2013, doi: 10.1039/c3nr33954h. [DOI] [PubMed] [Google Scholar]
- [65].CDC. (Jul. 1, 2020). Identifying the Source of the Outbreak. Accessed: Oct. 24, 2020. [Online]. Available: https://www.cdc.gov/coronavirus/2019-ncov/cases-updates/about-epidemiology/identifying-source-outbreak.html
- [66].Cheng V. C. C., Lau S. K. P., Woo P. C. Y., and Yuen K. Y., “Severe acute respiratory syndrome coronavirus as an agent of emerging and reemerging infection,” Clin. Microbiol. Rev., vol. 20, no. 4, pp. 660–694, Oct. 2007, doi: 10.1128/CMR.00023-07. [DOI] [PMC free article] [PubMed] [Google Scholar]
- [67].Tang Y.-W., Schmitz J. E., Persing D. H., and Stratton C. W., “Laboratory diagnosis of COVID-19: Current issues and challenges,” J. Clin. Microbiol., vol. 58, no. 6, Apr. 2020, Art. no. e00512, doi: 10.1128/jcm.00512-20. [DOI] [PMC free article] [PubMed] [Google Scholar]
- [68].Kumar R., Nagpal S., Kaushik S., and Mendiratta S., “COVID-19 diagnostic approaches: Different roads to the same destination,” Virus-Disease, vol. 31, no. 2, pp. 97–105, Jun. 2020, doi: 10.1007/s13337-020-00599-7. [DOI] [PMC free article] [PubMed] [Google Scholar]
- [69].Hussein H. A., Hassan R. Y. A., Chino M., and Febbraio F., “Point-of-care diagnostics of COVID-19: From current work to future perspectives,” Sensors, vol. 20, no. 15, p. 4289, Jul. 2020. [DOI] [PMC free article] [PubMed] [Google Scholar]
- [70].Chen J.et al. , “COVID-19 infection: The China and Italy perspectives,” Cell Death Disease, vol. 11, no. 6, p. 438, Jun. 2020, doi: 10.1038/s41419-020-2603-0. [DOI] [PMC free article] [PubMed] [Google Scholar]
- [71].Chung M.et al. , “CT imaging features of 2019 novel coronavirus (2019-nCoV),” Radiology, vol. 295, no. 1, pp. 202–207, Apr. 2020, doi: 10.1148/radiol.2020200230. [DOI] [PMC free article] [PubMed] [Google Scholar]
- [72].What Tests Could Potentially be Used for the Screening, Diagnosis and Monitoring of COVID-19 and What Are Their Advantages and Disadvantages? CEBM. Accessed: Oct. 24, 2020. [Online]. Available: https://www.cebm.net/covid-19/what-tests-could-potentially-be-used-for-the-screening-diagnosis-and-monitoring-of-covid-19-and-what-are-their-advantages-and-disadvantages/
- [73].Fang Y.et al. , “Sensitivity of chest CT for COVID-19: Comparison to RT-PCR,” Radiology, vol. 296, no. 2, pp. E115–E117, Aug. 2020, doi: 10.1148/radiol.2020200432. [DOI] [PMC free article] [PubMed] [Google Scholar]
- [74].Ai T.et al. , “Correlation of chest CT and RT-PCR testing for coronavirus disease 2019 (COVID-19) in China: A report of 1014 cases,” Radiology, vol. 296, no. 2, pp. E32–E40, Aug. 2020, doi: 10.1148/radiol.2020200642. [DOI] [PMC free article] [PubMed] [Google Scholar]
- [75].PCR—FosunPharmaUSA. Accessed: Oct. 28, 2020. [Online]. Available: http://fosunpharmausa.com/covid19/pcr/
- [76].Smart Detect SARS-CoV-2 RRT-PCR Kit/48T. Accessed: Oct. 28, 2020. [Online]. Available: https://supply.unicef.org/s0003891.html
- [77].FDA Emergency Use Authorized COVID-19 IgG/IgM Rapid Test Cassette. Accessed: Oct. 28, 2020. [Online]. Available: https://www.confirmbiosciences.com/covid19-instant-coronavirus-test-kit/
- [78].Feldstein L. R.et al. , “Multisystem inflammatory syndrome in US children and adolescents,” N. Engl. J. Med., vol. 383, no. 4, pp. 334–346, Jul. 2020, doi: 10.1056/NEJMoa2021680. [DOI] [PMC free article] [PubMed] [Google Scholar]
- [79].Koczula K. M. and Gallotta A., “Lateral flow assays,” Essays Biochemistry, vol. 60, no. 1, pp. 111–120, Jun. 2016, doi: 10.1042/EBC20150012. [DOI] [PMC free article] [PubMed] [Google Scholar]
- [80].Pan Y.et al. , “Initial CT findings and temporal changes in patients with the novel coronavirus pneumonia (2019-nCoV): A study of 63 patients in Wuhan, China,” Eur. Radiol., vol. 30, no. 6, pp. 3306–3309, Jun. 2020, doi: 10.1007/s00330-020-06731-x. [DOI] [PMC free article] [PubMed] [Google Scholar]
- [81].Xu X.et al. , “Imaging and clinical features of patients with 2019 novel coronavirus SARS-CoV-2,” Eur. J. Nucl. Med. Mol. Imag., vol. 47, no. 5, pp. 1275–1280, May 2020, doi: 10.1007/s00259-020-04735-9. [DOI] [PMC free article] [PubMed] [Google Scholar]
- [82].Lei J., Li J., Li X., and Qi X., “CT Imaging of the 2019 novel coronavirus (2019-nCoV) pneumonia,” Radiology, vol. 295, no. 1, p. 18, Apr. 2020, doi: 10.1148/radiol.2020200236. [DOI] [PMC free article] [PubMed] [Google Scholar]
- [83].Bai H. X.et al. , “Performance of radiologists in differentiating COVID-19 from non-COVID-19 viral pneumonia at chest CT,” Radiology, vol. 296, no. 2, pp. E46–E54, Aug. 2020, doi: 10.1148/radiol.2020200823. [DOI] [PMC free article] [PubMed] [Google Scholar]
- [84].Yun Y.-H.et al. , “Tiny medicine: Nanomaterial-based biosensors,” Sensors, vol. 9, no. 11, pp. 9275–9299, Nov. 2009, doi: 10.3390/s91109275. [DOI] [PMC free article] [PubMed] [Google Scholar]
- [85].Bhalla N., Pan Y., Yang Z., and Payam A. F., “Opportunities and challenges for biosensors and nanoscale analytical tools for pandemics: COVID-19,” ACS Nano, vol. 14, no. 7, pp. 7783–7807, Jul. 2020, doi: 10.1021/acsnano.0c04421. [DOI] [PMC free article] [PubMed] [Google Scholar]
- [86].Holzinger M., Le Goff A., and Cosnier S., “Nanomaterials for biosensing applications: A review,” Frontiers Chem., vol. 2, p. 63, Aug. 2014, doi: 10.3389/fchem.2014.00063. [DOI] [PMC free article] [PubMed] [Google Scholar]
- [87].Qiu M.et al. , “Antibody responses to individual proteins of SARS coronavirus and their neutralization activities,” Microbes Infection, vol. 7, nos. 5–6, pp. 882–889, May 2005, doi: 10.1016/j.micinf.2005.02.006. [DOI] [PMC free article] [PubMed] [Google Scholar]
- [88].Tan Y.-J.et al. , “Profiles of antibody responses against severe acute respiratory syndrome coronavirus recombinant proteins and their potential use as diagnostic markers,” Clin. Diagnostic Lab. Immunol., vol. 11, no. 2, pp. 362–371, Mar. 2004, doi: 10.1128/cdli.11.2.362-371.2004. [DOI] [PMC free article] [PubMed] [Google Scholar]
- [89].Lu L.et al. , “Immunological characterization of the spike protein of the severe acute respiratory syndrome coronavirus,” J. Clin. Microbiol., vol. 42, no. 4, pp. 1570–1576, Apr. 2004, doi: 10.1128/jcm.42.4.1570-1576.2004. [DOI] [PMC free article] [PubMed] [Google Scholar]
- [90].Mavrikou S., Moschopoulou G., Tsekouras V., and Kintzios S., “Development of a portable, ultra-rapid and ultra-sensitive cell-based biosensor for the direct detection of the SARS-CoV-2 S1 spike protein antigen,” Sensors, vol. 20, no. 11, p. 3121, May 2020. [Online]. Available: https://www.mdpi.com/1424-8220/20/11/3121 [DOI] [PMC free article] [PubMed] [Google Scholar]
- [91].Hulswit R. J. G.et al. , “Human coronaviruses OC43 and HKU1 bind to 9-O-acetylated sialic acids via a conserved receptor-binding site in spike protein domain A,” Proc. Nat. Acad. Sci. USA, vol. 116, no. 7, pp. 2681–2690, 2019, doi: 10.1073/pnas.1809667116. [DOI] [PMC free article] [PubMed] [Google Scholar]
- [92].Park Y.-J.et al. , “Structures of MERS-CoV spike glycoprotein in complex with sialoside attachment receptors,” Nature Struct. Mol. Biol., vol. 26, no. 12, pp. 1151–1157, Dec. 2019, doi: 10.1038/s41594-019-0334-7. [DOI] [PMC free article] [PubMed] [Google Scholar]
- [93].Murugan D., Bhatia H., Sai V. V. R., and Satija J., “P-FAB: A fiber-optic biosensor device for rapid detection of COVID-19,” Trans. Indian Nat. Acad. Eng., vol. 5, no. 2, pp. 211–215, Jun. 2020, doi: 10.1007/s41403-020-00122-w. [DOI] [PMC free article] [PubMed] [Google Scholar]
- [94].Williams E., Bond K., Zhang B., Putland M., and Williamson D. A., “Saliva as a noninvasive specimen for detection of SARS-CoV-2,” J. Clin. Microbiol., vol. 58, no. 8, Apr. 2020, Art. no. e00776, doi: 10.1128/jcm.00776-20. [DOI] [PMC free article] [PubMed] [Google Scholar]
- [95].Liu W.et al. , “Evaluation of nucleocapsid and spike protein-based enzyme-linked immunosorbent assays for detecting antibodies against SARS-CoV-2,” J. Clin. Microbiol., vol. 58, no. 6, Mar. 2020, Art. no. e00461, doi: 10.1128/jcm.00461-20. [DOI] [PMC free article] [PubMed] [Google Scholar]
- [96].Wyllie A. L.et al. , “Saliva or nasopharyngeal swab specimens for detection of SARS-CoV-2,” New England J. Med., vol. 383, no. 13, pp. 1283–1286, 2020, doi: 10.1056/NEJMc2016359. [DOI] [PMC free article] [PubMed] [Google Scholar]
- [97].Verma R. K. and Gupta B. D., “Theoretical modelling of a bi-dimensional U-shaped surface plasmon resonance based fibre optic sensor for sensitivity enhancement,” J. Phys. D, Appl. Phys., vol. 41, no. 9, Apr. 2008, Art. no. 095106, doi: 10.1088/0022-3727/41/9/095106. [DOI] [Google Scholar]
- [98].EMPA. A New Biosensor for the COVID-19 Virus: Detection in the Environment. Accessed: Aug. 30, 2020. [Online]. Available: http://www.sciencedaily.com/releases/2020/04/200421112520.htm
- [99].Qiu G., Gai Z., Tao Y., Schmitt J., Kullak-Ublick G. A., and Wang J., “Dual-functional plasmonic photothermal biosensors for highly accurate severe acute respiratory syndrome coronavirus 2 detection,” ACS Nano, vol. 14, no. 5, pp. 5268–5277, May 2020, doi: 10.1021/acsnano.0c02439. [DOI] [PubMed] [Google Scholar]
- [100].Mejía-Salazar J. R. and Oliveira O. N., “Plasmonic biosensing,” Chem. Rev., vol. 118, no. 20, pp. 10617–10625, Oct. 2018, doi: 10.1021/acs.chemrev.8b00359. [DOI] [PubMed] [Google Scholar]
- [101].Firdous S., Anwar S., and Rafya R., “Development of surface plasmon resonance (SPR) biosensors for use in the diagnostics of malignant and infectious diseases,” Laser Phys. Lett., vol. 15, no. 6, Apr. 2018, Art. no. 065602, doi: 10.1088/1612-202x/aab43f. [DOI] [Google Scholar]
- [102].Soler M., Huertas C. S., and Lechuga L. M., “Label-free plasmonic biosensors for point-of-care diagnostics: A review,” Expert Rev. Mol. Diag., vol. 19, no. 1, pp. 71–81, Jan. 2019, doi: 10.1080/14737159.2019.1554435. [DOI] [PubMed] [Google Scholar]
- [103].Masson J.-F., “Surface plasmon resonance clinical biosensors for medical diagnostics,” ACS Sensors, vol. 2, no. 1, pp. 16–30, Jan. 2017, doi: 10.1021/acssensors.6b00763. [DOI] [PubMed] [Google Scholar]
- [104].Liu J., Jalali M., Mahshid S., and Wachsmann-Hogiu S., “Are plasmonic optical biosensors ready for use in point-of-need applications?” Analyst, vol. 145, no. 2, pp. 364–384, Jan. 2020, doi: 10.1039/C9AN02149C. [DOI] [PubMed] [Google Scholar]
- [105].Michalet X., “Quantum dots for live cells, in vivo imaging, and diagnostics,” Science, vol. 307, no. 5709, pp. 538–544, Jan. 2005, doi: 10.1126/science.1104274. [DOI] [PMC free article] [PubMed] [Google Scholar]
- [106].Mudshinge S. R., Deore A. B., Patil S., and Bhalgat C. M., “Nanoparticles: Emerging carriers for drug delivery,” Saudi Pharmaceutical J., vol. 19, no. 3, pp. 129–141, Jul. 2011, doi: 10.1016/j.jsps.2011.04.001. [DOI] [PMC free article] [PubMed] [Google Scholar]
- [107].Frasco M. and Chaniotakis N., “Semiconductor quantum dots in chemical sensors and biosensors,” Sensors, vol. 9, no. 9, pp. 7266–7286, Sep. 2009. [Online]. Available: https://www.mdpi.com/1424-8220/9/9/7266 [DOI] [PMC free article] [PubMed] [Google Scholar]
- [108].Makwana B. A., Darjee S., Jain V. K., Kongor A., Sindhav G., and Rao M. V., “A comparative study: Metal nanoparticles as fluorescent sensors for biomolecules and their biomedical application,” Sens. Actuators B, Chem., vol. 246, pp. 686–695, Jul. 2017, doi: 10.1016/j.snb.2017.02.054. [DOI] [Google Scholar]
- [109].Eftekhari-Sis B., Karaminejad S., Malekan F., Araghi H. Y., and Akbari A., “CdSe quantum dots based nano-biosensor for detection of 185delAG mutation in BRCA1 gene, responsible for breast cancer,” J. Inorganic Organometallic Polym. Mater., vol. 27, no. 6, pp. 1911–1917, Nov. 2017, doi: 10.1007/s10904-017-0661-2. [DOI] [Google Scholar]
- [110].Nguyen T. H.et al. , “Fluorescence biosensor based on CdTe quantum dots for specific detection of H5N1 avian influenza virus,” Adv. Natural Sci., Nanosci. Nanotechnol., vol. 3, no. 3, Aug. 2012, Art. no. 035014, doi: 10.1088/2043-6262/3/3/035014. [DOI] [Google Scholar]
- [111].Singh R. D.et al. , “Quantum dot based nano-biosensors for detection of circulating cell free miRNAs in lung carcinogenesis: From biology to clinical translation,” Frontiers Genet., vol. 9, Dec. 2018, doi: 10.3389/fgene.2018.00616. [DOI] [PMC free article] [PubMed] [Google Scholar]
- [112].Pasinszki T., Krebsz M., Tung T. T., and Losic D., “Carbon nanomaterial based biosensors for non-invasive detection of cancer and disease biomarkers for clinical diagnosis,” Sensors, vol. 17, no. 8, p. 1919, Aug. 2017. [Online]. Available: https://www.mdpi.com/1424-8220/17/8/1919 [DOI] [PMC free article] [PubMed] [Google Scholar]
- [113].Bhattacharyya D., Sarswat P. K., and Free M. L., “Quantum dots and carbon dots based fluorescent sensors for TB biomarkers detection,” Vacuum, vol. 146, pp. 606–613, Dec. 2017, doi: 10.1016/j.vacuum.2017.02.003. [DOI] [Google Scholar]
- [114].Li Y., Schluesener H. J., and Xu S., “Gold nanoparticle-based biosensors,” Gold Bull., vol. 43, no. 1, pp. 29–41, Mar. 2010, doi: 10.1007/BF03214964. [DOI] [Google Scholar]
- [115].Lai H. C., Chin S. F., Pang S. C., Henry Sum M. S., and Perera D., “Carbon nanoparticles based electrochemical biosensor strip for detection of Japanese encephalitis virus,” J. Nanomaterials, vol. 2017, Dec. 2017, Art. no. 3615707, doi: 10.1155/2017/3615707. [DOI] [Google Scholar]
- [116].Sanvicens N., Pastells C., Pascual N., and Marco M.-P., “Nanoparticle-based biosensors for detection of pathogenic bacteria,” TrAC Trends Anal. Chem., vol. 28, no. 11, pp. 1243–1252, Dec. 2009, doi: 10.1016/j.trac.2009.08.002. [DOI] [Google Scholar]
- [117].Joo K.-I.et al. , “Site-specific labeling of enveloped viruses with quantum dots for single virus tracking,” ACS Nano, vol. 2, no. 8, pp. 1553–1562, Aug. 2008, doi: 10.1021/nn8002136. [DOI] [PMC free article] [PubMed] [Google Scholar]
- [118].Islam M. and Ahsan M. Z., “Plausible approach for rapid detection of SARS-CoV-2 virus by magnetic nanoparticle based biosensors,” Amer. J. Nanosci., vol. 6, pp. 6–13, Jul. 2020, doi: 10.11648/j.ajn.20200602.11. [DOI] [Google Scholar]
- [119].Seo G.et al. , “Rapid detection of COVID-19 causative virus (SARS-CoV-2) in human nasopharyngeal swab specimens using field-effect transistor-based biosensor,” ACS Nano, vol. 14, no. 4, pp. 5135–5142, Apr. 2020, doi: 10.1021/acsnano.0c02823. [DOI] [PubMed] [Google Scholar]
- [120].Saleh J., Peyssonnaux C., Singh K. K., and Edeas M., “Mitochondria and microbiota dysfunction in COVID-19 pathogenesis,” Mitochondrion, vol. 54, pp. 1–7, Sep. 2020, doi: 10.1016/j.mito.2020.06.008. [DOI] [PMC free article] [PubMed] [Google Scholar]
- [121].Miripour Z. S.et al. , “Real-time diagnosis of reactive oxygen species (ROS) in fresh sputum by electrochemical tracing; correlation between COVID-19 and viral-induced ROS in lung/respiratory epithelium during this pandemic,” Biosensors Bioelectron., vol. 165, Oct. 2020, Art. no. 112435, doi: 10.1016/j.bios.2020.112435. [DOI] [PMC free article] [PubMed] [Google Scholar]
- [122].Freeman T. L. and Swartz T. H., “Targeting the NLRP3 inflammasome in severe COVID-19,” Frontiers Immunol., vol. 11, p. 1518, Jun. 2020, doi: 10.3389/fimmu.2020.01518. [DOI] [PMC free article] [PubMed] [Google Scholar]
- [123].Malik R., Tomer V. K., and Chaudhary V., “Hybridized graphene for chemical sensing,” in Functionalized Graphene Nanocomposites and Their Derivatives. Amsterdam, The Netherlands: Elsevier, 2019, pp. 323–338. [Google Scholar]
- [124].Camilli L. and Passacantando M., “Advances on sensors based on carbon nanotubes,” Chemosensors, vol. 6, no. 4, p. 62, Dec. 2018, doi: 10.3390/chemosensors6040062. [DOI] [Google Scholar]
- [125].Soo Choi H.et al. , “Renal clearance of quantum dots,” Nature Biotechnol., vol. 25, no. 10, pp. 1165–1170, Oct. 2007, doi: 10.1038/nbt1340. [DOI] [PMC free article] [PubMed] [Google Scholar]
- [126].Bottrill M. and Green M., “Some aspects of quantum dot toxicity,” Chem. Commun., vol. 47, no. 25, pp. 7039–7050, 2011, doi: 10.1039/C1CC10692A. [DOI] [PubMed] [Google Scholar]
- [127].Clift M. J. D. and Stone V., “Quantum dots: An insight and perspective of their biological interaction and how this relates to their relevance for clinical use,” Theranostics, vol. 2, no. 7, pp. 668–680, 2012, doi: 10.7150/thno.4545. [DOI] [PMC free article] [PubMed] [Google Scholar]
- [128].Liu Z., Robinson J. T., Sun X., and Dai H., “PEGylated nanographene oxide for delivery of water-insoluble cancer drugs,” J. Amer. Chem. Soc., vol. 130, no. 33, pp. 10876–10877, Aug. 2008, doi: 10.1021/ja803688x. [DOI] [PMC free article] [PubMed] [Google Scholar]
- [129].Feng L., Zhang S., and Liu Z., “Graphene based gene transfection,” Nanoscale, vol. 3, no. 3, pp. 1252–1257, Mar. 2011, doi: 10.1039/c0nr00680g. [DOI] [PubMed] [Google Scholar]
- [130].Heerema S. J. and Dekker C., “Graphene nanodevices for DNA sequencing,” Nature Nanotechnol., vol. 11, no. 2, pp. 127–136, Feb. 2016, doi: 10.1038/nnano.2015.307. [DOI] [PubMed] [Google Scholar]
- [131].Peng C., Hu W., Zhou Y., Fan C., and Huang Q., “Intracellular imaging with a graphene-based fluorescent probe,” Small, vol. 6, no. 15, pp. 1686–1692, Jul. 2010, doi: 10.1002/smll.201000560. [DOI] [PubMed] [Google Scholar]
- [132].Zeng Q.et al. , “Self-assembled graphene-enzyme hierarchical nanostructures for electrochemical biosensing,” Adv. Funct. Mater., vol. 20, no. 19, pp. 3366–3372, Oct. 2010, doi: 10.1002/adfm.201000540. [DOI] [Google Scholar]