

Abstract
A novel coronavirus disease 2019 (COVID-19) was detected and has spread rapidly across various countries around the world since the end of the year 2019. Computed Tomography (CT) images have been used as a crucial alternative to the time-consuming RT-PCR test. However, pure manual segmentation of CT images faces a serious challenge with the increase of suspected cases, resulting in urgent requirements for accurate and automatic segmentation of COVID-19 infections. Unfortunately, since the imaging characteristics of the COVID-19 infection are diverse and similar to the backgrounds, existing medical image segmentation methods cannot achieve satisfactory performance. In this article, we try to establish a new deep convolutional neural network tailored for segmenting the chest CT images with COVID-19 infections. We first maintain a large and new chest CT image dataset consisting of 165,667 annotated chest CT images from 861 patients with confirmed COVID-19. Inspired by the observation that the boundary of the infected lung can be enhanced by adjusting the global intensity, in the proposed deep CNN, we introduce a feature variation block which adaptively adjusts the global properties of the features for segmenting COVID-19 infection. The proposed FV block can enhance the capability of feature representation effectively and adaptively for diverse cases. We fuse features at different scales by proposing Progressive Atrous Spatial Pyramid Pooling to handle the sophisticated infection areas with diverse appearance and shapes. The proposed method achieves state-of-the-art performance. Dice similarity coefficients are 0.987 and 0.726 for lung and COVID-19 segmentation, respectively. We conducted experiments on the data collected in China and Germany and show that the proposed deep CNN can produce impressive performance effectively. The proposed network enhances the segmentation ability of the COVID-19 infection, makes the connection with other techniques and contributes to the development of remedying COVID-19 infection.
Keywords: Coronavirus disease 2019 pneumonia, COVID-19, deep learning, segmentation, multi-scale feature
1. Introduction
In December 2019, coronavirus disease 2019 (COVID-19), a new febrile respiratory tract illness caused by severe acute respiratory syndrome coronavirus 2 (SARS-CoV-2) was detected. The typical onset symptoms of COVID-19 patients are fever, cough, myalgia, dyspnea, and muscle aches. Despite the imposition of strict quarantine rule to limit its propagation, the COVID-19 infection has spread rapidly, affecting countries worldwide. At the end of January 2020, the World Health Organization (WHO) declared that COVID-19 becomes a Public Health Emergency of International Concern [1]. As of 11 July 2020, the WHO reported, 14,246,629 worldwide cases with 592,690 deaths [2]. While infection rates are decreasing in China, numbers of new infections are still exponentially growing in many other countries.
Reverse transcription polymerase chain reaction (RT-PCR) is one of the standard diagnostic methods to detect nucleotides from specimens obtained by oropharyngeal swab, nasopharyngeal swab, bronchoalveolar lavage, or tracheal aspirate [3]. However, recent reports have indicated that the sensitivity of RT-PCR might not be high enough for detecting COVID-19 [4], [5], which can possibly be attributed to quality, stability and insufficient viral material in specimens. On the other hand, since chest Computed tomography (CT) images captured from COVID-19 patients frequently show bilateral patchy shadows or ground glass opacity in the lung [6], CT has become a vital complementary tool for detecting the lung associated with COVID-19. Comparing to RT-PCR test, chest CT is relatively easy to operate and has a high sensitivity for screening COVID-19 infection [4]. Therefore, CT could serve as a practical approach for early screening and diagnosis of COVID-19 in China. However, as the increment of confirmed and suspected cases of COVID-19, manually contouring lung lesions is a tedious and labor-intensive task. To speed up diagnosis and improve access to treatment, developing a fast automatic segmentation for COVID-19 infection is critical for the disease assessment.
Recently, with the rapid development of artificial intelligence [7], [8], [9], [10], [11], [12], [13], [14], [15], [16], [17], [18], deep learning technology has been widely used in medical image processing due to its powerful feature representation. Several techniques based on deep learning have been published to detect COVID-19 pneumonia from CT images [19], [20], [21], [22]. Wang et al. [20] developed a deep learning method that could extract COVID-19's graphical features to provide a clinical diagnosis ahead of the pathogenic test. Ayrton [21] adopted the transfer learning technique with ResNet50 backbone to detect COVID-19. Wang et al. [19] introduced a deep convolutional neural network design tailored, called COVID-Net, to detect COVID-19 cases from chest radiography images. Gozes et al. [23] presented a system that utilizes 2D and 3D deep learning models, modified and adapted existing deep network models, and combined them with clinical understanding. Tang et al. [24] trained a random forest (RF) model to assess the severity (non-severe or severe) based on quantitative features. Shi et al. [25] proposed an infection Size Aware Random Forest method (iSARF) for classification. Shan et al. [26] developed a deep learning-based system for segmentation and quantification of infection regions from CT scans. In summary, some deep learning-based methods have been proposed to detect COVID-19 and viral pneumonia in chest CT images. To our knowledge, however, only a few publications have investigated the segmentation task for COVID-19 chest CT images.
In this paper, we try to establish a new tailored deep convolutional neural network (CNN) for segmenting the chest CT images with COVID-19 infections. Fig. 1 shows the chest CT images with COVID-19 infection, which contain ground-glass opacities (GGOs), areas of consolidation, and a mix of both in all lung lobes. Most lesions were located peripherally, with a slight preponderance of dorsal lung areas. Due to the special structure and visual characteristics, the boundaries of COVID-19 infection regions are difficult to distinguish from the chest wall, making accurate segmentation for COVID-19 infection regions difficult. We observe that the boundaries of COVID-19 infection regions will be revealed by adjusting different parameters of window breadth and window locations in annotation processing, as shown in Fig. 1, which can be beneficial for the COVID-19 infection image segmentation.
Fig. 1.

Chest CT images of three patients with laboratory proven COVID-19 pneumonia. As shown in the top row, patchy ground-glass opacities (GGOs) and areas of consolidation bilaterally exist in all lung lobes (highlighted with red bounding box). It is hard to distinguish COVID-19 infection regions from the chest wall. COVID-19 infection regions’ boundaries are highlighted (as indicated by green bounding box) after carefully adjusting the window breadth and window locations for each CT image.
We propose a three-dimensional (3D) convolution-based deep learning method for automatic segmentation of COVID-19 infection regions as well as the entire lung from chest CT images, referred to as COVID-SegNet. The proposed method can be hugely beneficial for the early screening of patients with COVID-19. Inspired by the observation in annotation processing, the boundaries of COVID-19 infection regions are highlighted by adjusting the window breadth and window locations, we extend Squeeze and excitation (SE) unit [27], named Feature Variation (FV) block, for handling the confusing boundaries. The main idea of the FV block is to implicitly enhance the contrast and adjust the intensity in the feature level automatically and adaptively for different images. Based on the captured features of previous layers, the FV block employs channel attention to obtain the global parameter to generate new features. In addition to the channel attention, the FV block uses spatial attention to guide the feature extraction from inputs in the encoder. Aggregating these features can effectively enhance the capability of feature representation for the segmentation of COVID-19. Furthermore, we propose a Progressive Atrous Spatial Pyramid Pooling (PASPP) to handle the challenging shape variations of COVID-19 infection areas. PASPP consists of a base convolution module followed by a cascade of atrous convolutional layers, which uses multistage parallel fusion branches to obtain the final features. Each atrous convolutional layer in PASPP only uses atrous filters with a reasonable dilation rate to cover different receptive fields. And by the progressively aggregated information from atrous convolutional layers, the information from multiple scales is effectively fused, which further promotes the performance of COVID-19 pneumonia segmentation.
The main contributions of the paper can be summarized as:
-
•
We propose a novel deep neural network (COVID-SegNet) for the segmentation of COVID-19 infection regions as well as the entire lung from chest CT images.
-
•
To address the key issue in the delineation of COVID-19 infection regions, a specific block, called Feature Variation (FV) block, is proposed to solve the problem of difficulty distinguishing COVID-19 pneumonia from the lung.
-
•
We introduce Progressive Atrous Spatial Pyramid Pooling (PASPP), which progressively aggregates information and obtains more effective contextual features.
-
•
To train the proposed networks, we maintain a novel and large dataset that consists of 165,667 chest CT images from 861 patients with confirmed COVID-19, which are annotated by experts. Ten cases captured from Germany are also used to test the robustness of the model.
2. Materials
2.1. Dataset Introduction
This study was approved by the medical ethics committees of the participating hospitals. Further consent was waived with approval. In total, chest CT images of 861 patients with confirmed COVID-19 by RT-PCR are included in this study. These CT images were acquired at 5 Chinese hospitals (Beijing Tsinghua Changgung Hospital, Wuhan No.7 Hospital, Zhongnan Hospital of Wuhan University, Tianyou Hospital Affiliated to Wuhan University of Science & Technology, Wuhan's Leishenshan Hospital) between January 2 and February 26, 2020. All imaging data were reconstructed by using a medium sharp reconstruction algorithm with a thickness of 0.625-10 mm (81 percent under 2 mm). To protect privacy, we deleted the personally identifiable information (PII) from all CT scans. A total of 731 patient's CT images were randomly extracted for training. The remaining CT images of 130 patients were used as the testing set.
2.2. Dataset Annotation
Although we captured enough data of the COVID-19 chest CT images, accurate annotated labels are also indispensable. To enable the model to learn on accurate annotations, we build a team of six radiological experts with proficient annotating skills to annotate the areas and boundaries of the lung and COVID-19 infection regions. Also, the quality of the final annotations is assessed by four senior radiologists with frontline clinical experience of COVID-19. The failed case will re-annotate by six radiological experts, and senior radiologists rechecked the results. This process will continue until all of them passed the back-to-back quality test within the two groups.
3. Method
In this section, we start with the overview of the proposed approach, then introduce the feature variation block and progressive atrous spatial pyramid pooling block. We briefly discuss the training strategy and implementation details in the end.
3.1. Network Structure of COVID-SegNet
We present a unified high-accuracy network for the segmentation of COVID-19 infection from chest CT images. This network consists of two parts: Encoder and Decoder. As shown in Fig. 2, the encoder with 4 layers (i.e. E1, E2, E3, E4) obtains robust information via feature extractor and PASPP. Each layer employs residual and FV blocks as the basic operations for feature extractors, except the E4 layer. The residual block adds up the input features and the results after two convolutional layers, which effectively alleviates the vanishing gradient. To preserve multiple contextual information and enlarge the receptive field, we use PASPP with different dilate rates on the final E4 layer. After obtaining the encoded features, the decoder tries to restore the features to its original input size, which can remove the information loss induced by down-sampling from Encoder. The decoder has three layers (D3, D2, D1). Each decoder layer allows the networks to gradually propagate the global contextual information to a higher resolution layer. After a sigmoid activation function, we obtain the final segmentation of COVID-19 infection regions. In addition, the skip connection is adopted to concatenate the output features of the encoder and input features of the decoder. In this paper, the main contribution is we improve the encoder by adding FV block and PASPP block to better capture effective features. The overview of these two blocks is as follows.
Fig. 2.
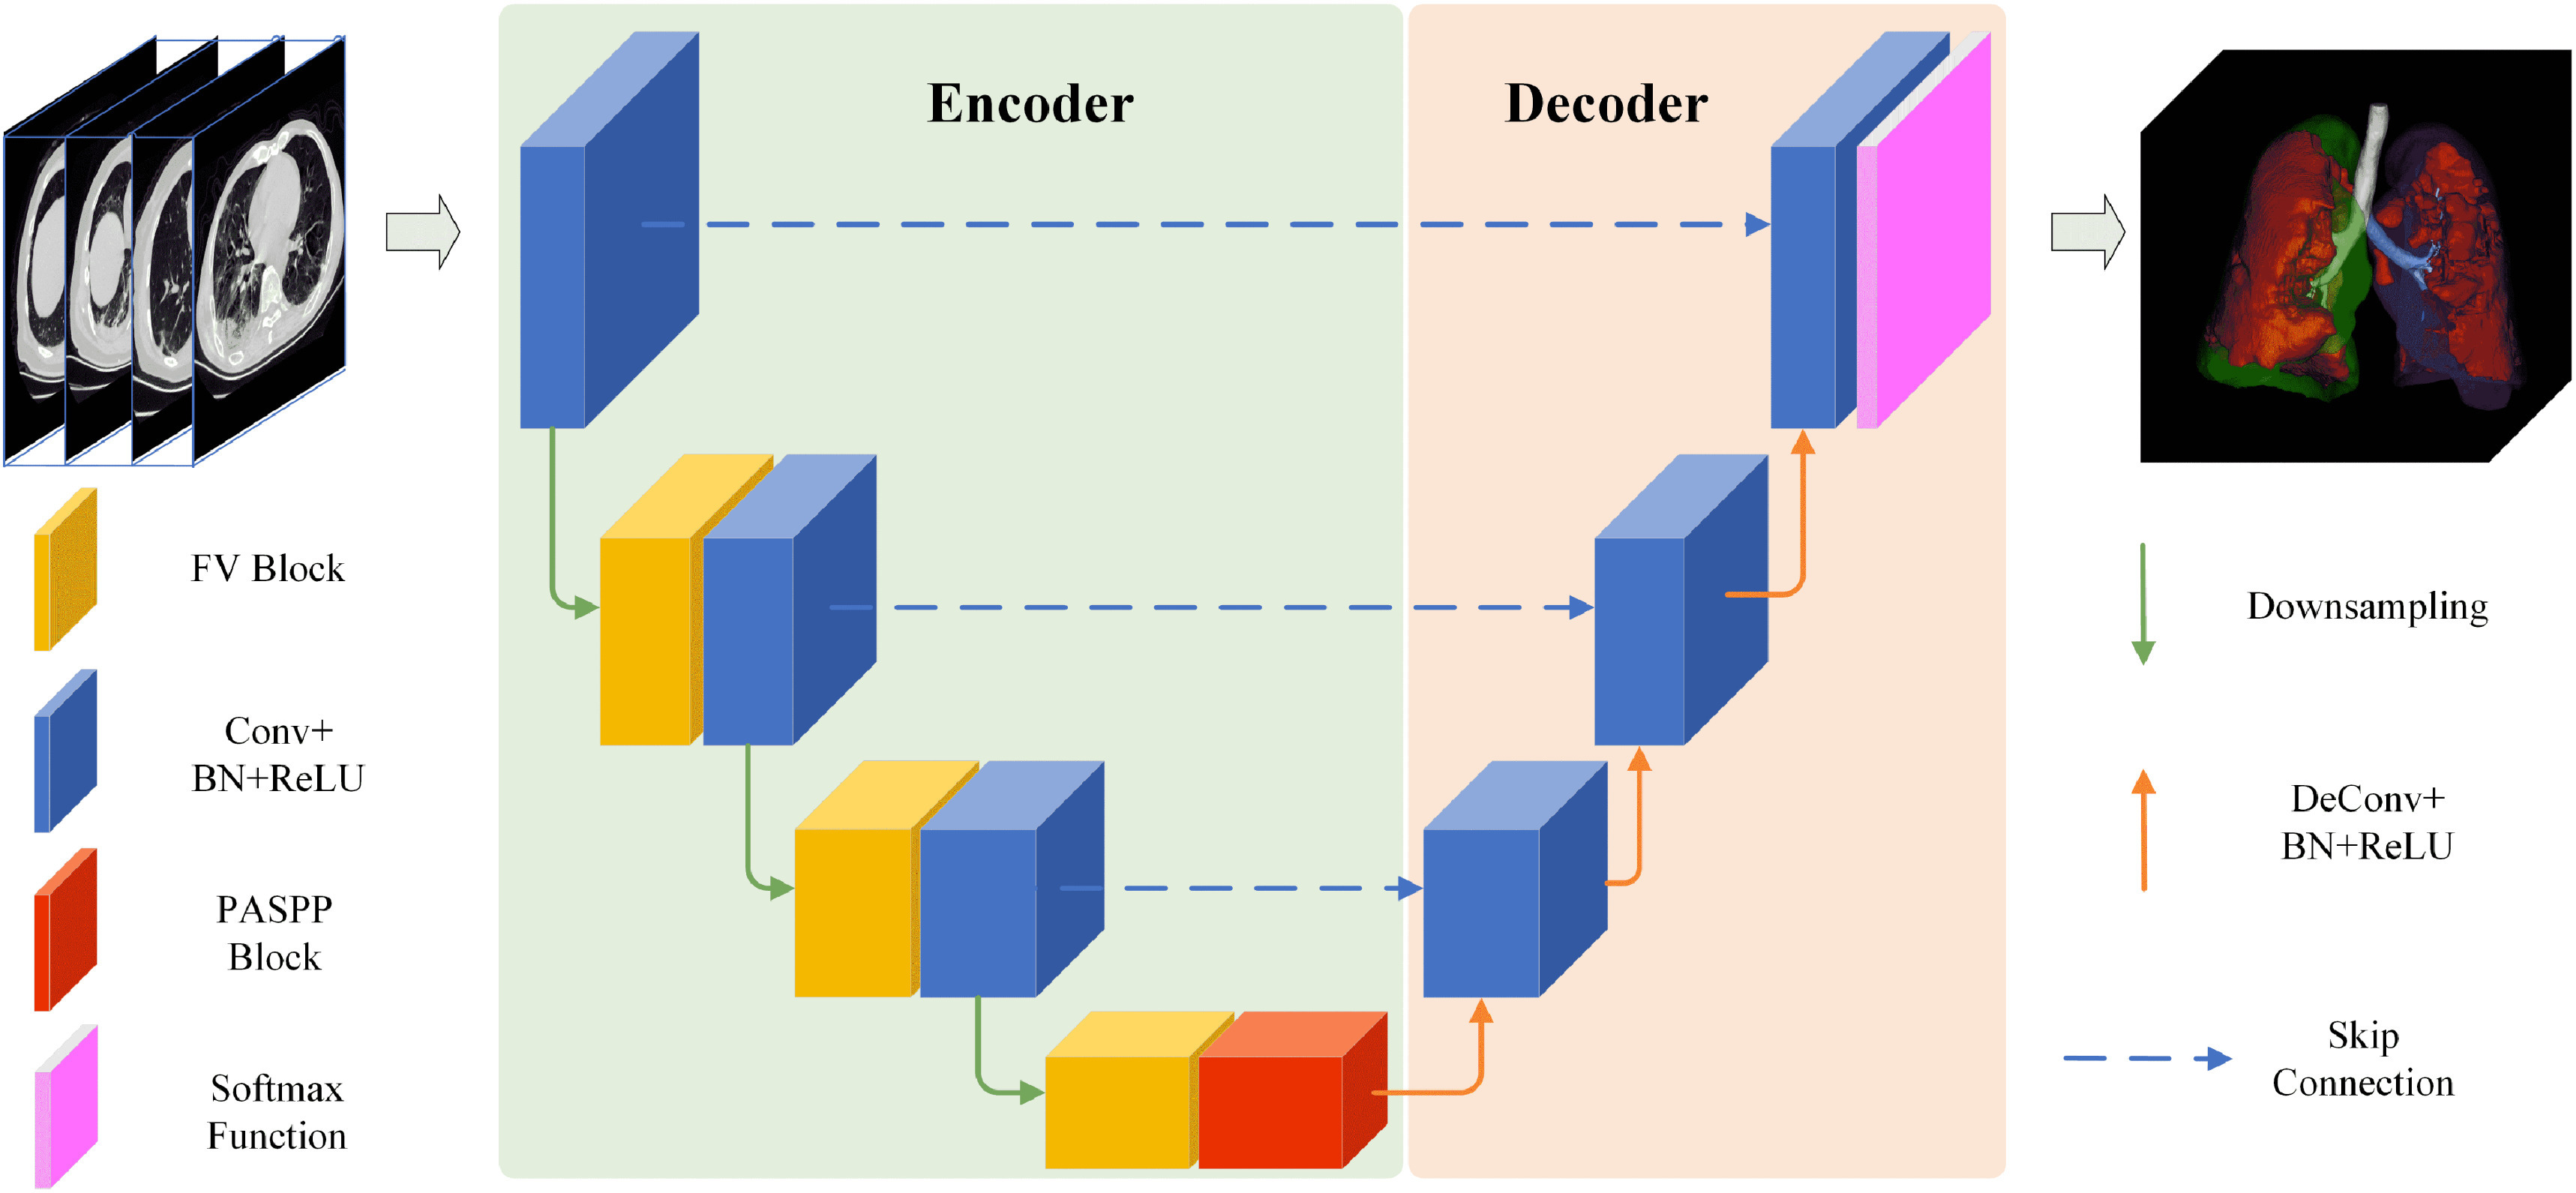
The architecture of the proposed COVID-SegNet. The network includes an encoder for feature extraction and a decoder for estimating the segmentation results. The FV block is adopted to highlight contrast and position of COVID-19, the PASSP block is built based on progressively fusing the output of different arous convolutional layers. The visualized final result is a presentation of the 3D segmentation of lung and the regions associated with COVID-19 infection.
We introduce the architectures of FV block by considering a material fact, the boundaries of COVID-19 infection regions are highlighted by adjusting the window breadth and window locations. As shown in Fig. 3, the proposed FV block includes three branches, i.e., contrast enhancement branch, position sensitive branch, and identity branch. Specifically, the contrast enhancement branch learns a global parameter via a channel attention unit to highlight useful boundary information. The position sensitive branch obtains a weight map by spatial attention unit to focus on the COVID-19 regions. Finally, the FV block preserves more useful information by fusing these refined features.
Fig. 3.

FV block consists of a contrast enhancement branch, position-sensitive branch, and identity branch. The features from these branches are concatenated to decrease the number of the channel via a  convolutional layer. The output features are obtained after residual learning with input.
The PASPP block takes the featured extracted with FV block as input and acquires semantic information with different receptive fields showing in Fig. 4. Although ASPP has been proposed to capture global information for semantic segmentation, we claim that aggregating information progressively is a more reasonable approach to get effective features. The PASPP block adopts atrous convolutions with different dilation rates to obtain features with various scales. The final output is generated straightforwardly to assemble residual branches in parallel.
Fig. 4.

The structure of the PASPP block. We assemble two residual branches in parallel and sum up the outputs from two  convolutional layers, then the outputs of two branches are progressively blended. Note that, compared to input features, the number of the channel decreases to quarter after each
  convolutional layer.
3.2. Feature Variation
As mentioned before, the boundaries of COVID-19 infection regions are highlighted by adjusting the window breadth and window locations. In Fig. 3, the designed FV block, which includes contrast enhancement branch, position sensitive branch and identity branch, tries to enhance the contrast of features and highlight the useful regions. Let  denotes the input feature, the features after
  represent
  . The output feature
  is given as

|
where  denotes the
  convolutional layer,
  is the concatenation operation,
  represents the contrast enhancement branch,
  is the position sensitive branch. The form of residual learning in Eq. (1) implies that the information from the early blocks can quickly flow to the later blocks, and the gradient can be quickly back-propagated to the early blocks from the later blocks [28]. The details of each sub-module are as follows.
3.2.1. Contrast Enhancement Branch
To enhance the contrast of features, the contrast enhancement branch  in Eq. (1) attempts to learn a global parameter
  for input feature
  (See Fig. 3). The corresponding function is given as

|
where  denotes the fully convolutional layer,
  represents global average pooling. The values of
  is in the range [0,1]. We obtain a channel weight map
  via expansion, thus the number of
  is consistent with
  . Finally, the output of contrast enhancement branch
  can be formulated as below:

|
where  denotes the element-wise multiplication. Note that, instead of calculating a sequence of weight for feature
  , we generate one weight for all the features of
  . This process is exactly corresponding to adjust the window breadth and window locations. Thus we deem it has the ability to generate enhanced features.
3.2.2. Position Sensitive Branch
The goal of the position-sensitive branch is to discard harmful information and highlight the helpful features used to segmentation COVID-19 infection. This branch  in Eq. (1) is a small network. The architecture of the position-sensitive branch is displayed in Fig. 3. The attention map
  is calculated using input feature
  after two convolutional layers. Each layer adopts
  convolution. The two convolutional layers are followed by a ReLU function and a sigmoid function, respectively. In the end, the output of this branch
  is obtained by element-wise multiplication between
  and the attention map

|
The values in  are still in the range
  . The attention map has the same size as the input feature.
3.3. Progressive Atrous Spatial Pyramid Pooling
In this subsection, we start with a preliminary knowledge of atrous spatial pyramid pooling, then introduce the proposed PASPP block.
3.3.1. Atrous Spatial Pyramid Pooling
Global information captured by a large receptive field is essential for medical semantic segmentation. To increase the receptive field size and decrease the number of convolutional layers, arous convolution was first proposed in [29] to obtain enough global information while keeping the size of the feature map unchanged. In one dimensional case, let  represents output and
  denotes input, atrous convolution can be formulated as follows:
|
where  denotes the filter size,
  represents the dilation rate, and
  is the
  th parameter of filter. A larger dilation rate will capture a larger receptive field. To produce different receptive fields, atrous spatial pyramid pooling takes atrous convolutions with different dilation rates to generate various scales. These features are concatenated together. Thus the outputs are indeed a sampling of the input with different scales information.
3.3.2. The PASPP Block
In the COVID-19 segmentation task, the infection regions often have very different sizes (See Fig. 1). To alleviate this dilemma, the features must be able to include different receptive fields. For this goal, we employ ASPP in our network and progressively fuse the features with different receptive fields. The structure of PASPP is illustrated in Fig. 4. Given the input feature of PASPP  , we obtain four features
  by four
  convolutional layers in parallel. Note that, compared to input features, the number of the channel decreases to quarter after each
  convolutional layer (See the second column in Fig. 4). Then each branch feeds the feature into different atrous convolutional layer, respectively. The corresponding function is given as

|
where  denotes the
  atrous convolutional layer with dilation rate
  ,
,  represents the output feature of the
  th branch after
  . Sum the inputs of two adjacent atrous convolution branches, and add the sum to the output of each residual branch as the input of the subsequent layer. It is formulated as below:

|
where  denotes the output features of
  th branch. To get effective features,
  will be progressively aggregated based on adjacent features in parallel
|
The  tends to fuse the information with small receptive field,
  prones to capture features with larger receptive field. The channel's number of
  and
and  is half of the input feature. All the information are assembled by

|
where  denotes the output features of PASPP block.
4. Experiments
4.1. Dataset
The dataset used in this study consists of 165,667 annotated chest CT images, with 861 patients confirmed COVID-19. A total of 731 patient's CT images are randomly extracted with age for training. The remaining CT images of 130 patients are used as the testing set.
4.2. Evaluation Metrics
The screening performance of the proposed method is conducted by the Dice similarity coefficient, sensitivity, and precision. The Dice similarity coefficient (Dice) represents a similarity metric between the ground truth, and the prediction score maps [33]. It is calculated as follows:

|
where  is the segmented infection region,
  denotes the corresponding reference region,
  represents the number of pixels common to both images. Sensitivity denotes the number of correctly identified positives with respect to the number of positives. Precision is the fraction of positive instances among the retrieved instances.
4.3. Implementation Details
The Parameters of the Network. For the proposed framework, the encoding layers are residual blocks, FV blocks, PASSP blocks, and downsampling, while the decoding layers are residual blocks and deconvolution layers kernels with a stride of 1/2. The last layer is a softmax activation function to produce the segmentation results. All layers use  kernels, if not specified otherwise. Each convolutional layer is followed by batch normalization and ReLU. The channel numbers are doubled each layer from 64 to 512 during encoding and halved from 512 to 64 during decoding. We set the combination of dice loss
  and cross-entropy loss
  as the loss function using the ground-truth label map. The final loss function is
  .
.
Training Details. We implement our COVID-SegNet using Pytorch. For network training, we train all models from scratch with random initial parameters. The entire models are conducted on a server with six Nvidia TITAN RTX GPUs with 24 GB memory. We randomly crop the  patches as the training samples. For optimization, we use Adam optimizer by setting
  ,
,  ,
,  and batch size is 2. In experiments, the initial learning rate is
  , and the learning rate decay of
  . The proposed network will perform both lung and COVID-19 segmentation tasks.
4.4. Comparison With the State-of-the-Art Methods
We compare our COVID-SegNet against the previous state-of-the-art methods on two datasets (the collected domestic test set and Germany data). Specifically, we evaluate the proposed method with FCN [30], UNet [31], VNet [33] and UNet++ [32]. Note that all methods employ 3D convolution in the framework. The same training dataset and setting are used for all methods.
4.4.1. Qualitative Results on the Domestic Datasets
We compare our method with several state-of-the-art methods on the test set (Figs. 5, 6 and 7), which contains some challenging samples with different contrast and pathogenic conditions.
Fig. 5.

Visual comparisons on the testing data for COVID-19 segmentation. (a)-(e) show the results of the state-of-the-art methods and the proposed method, respectively. (f) is the 3D surface rendering of COVD-19 infections (severe) segmented by our method. The red arrows indicate the flows of different methods. Ground truth is shown with the red line. Other methods are displayed in different colors.
Fig. 6.

Typical infection segmentation results of CT scans of COVID-19 patient (severe). The contrast of this case is too low to segment COVID-19 infection. The proposed method can still handle this difficulty sample. The red arrows indicate the flows of different methods. Ground truth is shown with the red line. Other methods are displayed in different colors.
Fig. 7.

Comparisons on the chest CT example of non-severe infection COVID-19 on the test set. The infection regions are not easy to peel from the chest wall. The red arrows indicate the flows of different methods. Ground truth is shown with the red line. Other methods are displayed in different colors.
 COVID-19 segmentation task:
Figs. 5a, 5b, 5c, 5d, and 5e illustrate the results of different methods, red line denotes the COVID-19 segmentation result of ground truth. Since the contrast (COVID-19 and lung) of this case is not enough, these methods cannot obtain approving results. The FCN method cannot obtain the whole edge of COVID-19. The results of UNet++ and VNet are often scattered and overlook the overall structures of COVID-19. The proposed method and UNet achieve better results; however, UNet products flaw in the center of the lung (white points in (b)). Since the proposed method employs FV blocks which adaptively enhance the global contrast of features, the proposed method can avoid the scattered artifacts. In addition, the PASPP blocks further improve the performance of our method. Fig. 5f represents the 3D surface rendering of COVID-19 infection regions segmented by our method.
COVID-19 segmentation task:
Figs. 5a, 5b, 5c, 5d, and 5e illustrate the results of different methods, red line denotes the COVID-19 segmentation result of ground truth. Since the contrast (COVID-19 and lung) of this case is not enough, these methods cannot obtain approving results. The FCN method cannot obtain the whole edge of COVID-19. The results of UNet++ and VNet are often scattered and overlook the overall structures of COVID-19. The proposed method and UNet achieve better results; however, UNet products flaw in the center of the lung (white points in (b)). Since the proposed method employs FV blocks which adaptively enhance the global contrast of features, the proposed method can avoid the scattered artifacts. In addition, the PASPP blocks further improve the performance of our method. Fig. 5f represents the 3D surface rendering of COVID-19 infection regions segmented by our method.
Figs. 6a, 6b, 6c, 6d, and 6e display the example of low contrast CT images, COVID-19 infection regions are similar with chest wall. Most of the methods can obtain massive structures of COVID-19. However, the proposed method generates a more reasonable edge for infection regions due to the contributions of FV blocks. Fig. 7 shows a different case captured from a non-severe patient, but the COVID-19 infection regions still hard to distinguish from the chest wall. Thus, the methods of FCN, UNet++, VNet generate dissatisfying results. The proposed method combined global and local information effectively obtains well-pleasing segmentation results for COVID-19 infection.
 Lung segmentation task: For the lung segmentation task, we test the performance of the proposed network on the test set. As shown in Fig. 8, (a)-(b) display the results of different methods, (f) is the 3D surface rendering of our method. From Fig. 8, we can easily observe that all results can close to the precision like manually annotated. UNet++ method often miss the boundary of the lung. VNet method cannot generate a smooth margin for the lung segmentation.
Fig. 8.

Visual comparisons on the testing data for lung segmentation. (a)-(e) show the results of the state-of-the-art methods and the proposed method, respectively. (f) is the 3D surface rendering of lung segmented by our method.
4.4.2. Qualitative Results on the Germany Data
To verify the generalization ability of all methods, we use ten cases of data captured from Brainlab Co. Ltd. in Germany to test the segmentation of COVID-19 infection and the lung.
 COVID-19 segmentation task:
Fig. 9 shows the comparisons on the chest CT images on the Germany data. The intensity of COVID-19 infection regions is very similar to that of the lung, which is a very challenging example. As displayed in Fig. 9, all state-of-the-art methods (i.e. FCN, UNet, UNet++, VNet) generate perishing and over-segmentation. Different from others, the proposed methods can obtain perfect results, which like a manual annotation (See Fig. 9e). The 3D surface rendering of the proposed method is shown in Fig. 9f, from which we can see that the small COVID-19 infection regions also can be segmented.
COVID-19 segmentation task:
Fig. 9 shows the comparisons on the chest CT images on the Germany data. The intensity of COVID-19 infection regions is very similar to that of the lung, which is a very challenging example. As displayed in Fig. 9, all state-of-the-art methods (i.e. FCN, UNet, UNet++, VNet) generate perishing and over-segmentation. Different from others, the proposed methods can obtain perfect results, which like a manual annotation (See Fig. 9e). The 3D surface rendering of the proposed method is shown in Fig. 9f, from which we can see that the small COVID-19 infection regions also can be segmented.
Fig. 9.

Comparisons on the chest CT example of non-severe infection COVID-19 on the Germany data. The red arrows indicate the flows of different methods. Ground truth is shown with the red line, and the results of other methods are displayed with different colors.
 Lung segmentation task: The segmentation results of all methods on the Germany data are shown in Fig. 10. Most of all methods can generate a distinct outline of the lung. However, our method has a stronger segmentation ability from the regions marked with the red arrow than other state-of-the-art methods. These perfect results demonstrate the effectiveness of the FV and PASPP blocks.
Fig. 10.

The lung segmentation results of different methods on the Germany data. The red arrows indicate the flows of different methods. Ground truth is shown with the red line, other methods are displayed with different colors.
4.4.3. Quantitative Results
To avoid the bias due to the data splitting way and random issues, we repeat to train and test model for 5 times. Based on the ground truths manually contoured by the radiology experts, we conduct the evaluations and comparisons to evaluate the accuracy of segmentation quantitatively. The results are reported in Table 1, which includes lung segmentation and COVID-19 infection segmentation.
TABLE 1. Quantitative Comparison Between Our Method and Others on the Proposed Test Dataset.
| Tasks | Metrics | FCN | UNet | VNet | UNet++ | Ours |
|---|---|---|---|---|---|---|
| COVID-19 | Dice | 0.659 | 0.688 | 0.625 | 0.681 | 0.726 |
| Sensitive | 0.719 | 0.736 | 0.744 | 0.735 | 0.751 | |
| Precision | 0.597 | 0.662 | 0.603 | 0.719 | 0.726 | |
| Lung | Dice | 0.865 | 0.987 | 0.983 | 0.986 | 0.987 |
| Sensitive | 0.986 | 0.987 | 0.974 | 0.988 | 0.986 | |
| Precision | 0.983 | 0.984 | 0.989 | 0.985 | 0.990 | |
| Resources | Time(s) | 8.63 | 9.27 | 9.40 | 10.26 | 9.33 |
| Parameters(M) | 18.7 | 22.9 | 24.5 | 33.8 | 27.3 |
All values are the average across all test data.
For the segmentation of COVID-19, as shown in Table 1, the results of the proposed method achieves best in all the metrics. Thanks to the FV and PASPP block, the COVID-SegNet can effectively segment COVID-19 infection regions and significantly improve the segmentation performance over the UNet by 3.8 percent in terms of Dice. All these metrics demonstrate the effectiveness of our model.
For the lung segmentation task, the average Dice similarity coefficient is 0.987. The average sensitivity and precision are 0.986 and 0.990, respectively. Although the existing methods have achieved enough promotion and the performance is hard to improve, the proposed COVID-SegNet still surpasses state-of-the-art methods on the term of precision. We consider these results are attributed to the contributions of the proposed FV and PASPP blocks.
4.5. Ablation Studies
As shown in Table 2, the baseline model is a UNet structure with 4 layers in the encoder. We conduct the contrast enhancement branch (CEB), position-sensitive branch (PSB), and FV block, respectively. In addition, we also replace CEB with the original channel attention block (CAB, removed the global parameter in CEB) to verify the function of global contrast enhancement. For verifying the PASPP block, we use ASPP and ResASPP, which removes the concatenation in PASPP to prove the advantage of possessively fusing features.
TABLE 2. Performance of the Network With Different Blocks.
| Blocks | COVID-19 Lesion | Lung Segmentation | ||||||||||||
|---|---|---|---|---|---|---|---|---|---|---|---|---|---|---|
| UNet4 | CAB | CEB | PSB | FV | ASPP | ResASPP | ESP | PASPP | Dice | Sensitive | Precision | Dice | Sensitive | Precision |
| ✓ | 0.658 | 0.670 | 0.651 | 0.959 | 0.956 | 0.951 | ||||||||
| ✓ | ✓ | 0.675 | 0.683 | 0.665 | 0.960 | 0.954 | 0.956 | |||||||
| ✓ | ✓ | 0.682 | 0.692 | 0.674 | 0.966 | 0.961 | 0.970 | |||||||
| ✓ | ✓ | 0.684 | 0.695 | 0.677 | 0.962 | 0.963 | 0.969 | |||||||
| ✓ | ✓ | 0.708 | 0.729 | 0.704 | 0.975 | 0.970 | 0.981 | |||||||
| ✓ | ✓ | 0.660 | 0.677 | 0.663 | 0.959 | 0.960 | 0.962 | |||||||
| ✓ | ✓ | 0.663 | 0.684 | 0.672 | 0.968 | 0.965 | 0.971 | |||||||
| ✓ | ✓ | 0.679 | 0.701 | 0.681 | 0.977 | 0.973 | 0.975 | |||||||
| ✓ | ✓ | 0.711 | 0.732 | 0.707 | 0.980 | 0.982 | 0.983 | |||||||
| ✓ | ✓ | ✓ | 0.726 | 0.751 | 0.726 | 0.987 | 0.986 | 0.990 | ||||||
4.5.1. Study on the FV Block
The quality of the FV block, which is the combination of the contrast, global and position information, is critical for enhancing the ability of accurate COVID-19 segmentation. In this section, we first evaluate the performance of the contrast enhancement branch (CEB) from both lung and COVID-19 segmentation. Then, we study the function of the position sensitive branch (PSB). All the comparisons are both performed on two tasks (lung and COVID-19 segmentation). All the results in Table 2 demonstrate the effectiveness of the FV blocks.
Context information is of great significance for segmenting the confusing boundary and position of COVID-19 infection regions. To verify the performance of CEB, we employ the original channel attention block (CAB) to replace the CEB and PSB in the FV block. From Table 2, we can see that the ASPP improves the segmentation performance over the UNet4. The reason is that the features have redundant information. However, the performance is further improved when we replace the CAB with CEB. Since the CAB merely learns the weights for each channel, the CEB uses global information to guide feature enhancement, which proves the ability of the CEB.
For PSB, it is actually a spatial attention module which has proved the effectiveness in many tasks. This branch focuses on the positions of features that are helpful to detect and segment COVID-19 infection regions. As we expected, the network with PSB generates satisfying numerical results. Combining these two branches in parallel, we obtain the FV block, which consists of global (ECB) and local (PSB) information to improve the segmentation task.
4.5.2. Study on the PASPP Block
PASPP consists of multiple atrous convolutional layers with different dilation rates and progressive concatenations. In this part, we conduct experiments to study how different settings of PASPP influence the performance quantitatively. We compare the PASPP block with Efficient Spatial Pyramid (ESP) [34], original ASPP and modified ResASPP (removed progressive concatenations). The results are reported in Table 2, from which we obtain several conclusions. First, progressively fusing strategy is very effective for COVID-19 segmentation. We deem the reason is different scale features should not be fused at once for the sophisticated COVID-19 segmentation. With the progressively fusing, the adjacent information can better supplement the missing details. Second, compared with ESP, ASPP, and ResASPP, since the ResASPP includes residual learning, it obtains reasonably high performances. This implies that the information from the early blocks can quickly flow to the output of atrous convolutional layers, and the gradient can be quickly back-propagated to the early blocks from the atrous convolutional layers. Third, the ASPP significantly improves the segmentation performance over the UNet4.
In general, to extract compacted features and obtain semantic information from COVID-19 CT images, we insert FV blocks into the encoder and employ PASPP for enlarging the receptive fields. As reported in Table 2, the proposed network not only achieves the best performance on lung segmentation but also on COVID-19 segmentation.
5. Conclusion
In this paper, we designed and evaluated a three-dimensional deep learning model, called COVID-SegNet, for segmenting lung and COVID-19 from chest CT images. Inspired by contrast enhancement methods and ASPP, the proposed network includes feature variation and progressive ASPP blocks, which are beneficial to highlight the boundary and position of COVID-19 infections. These results demonstrate that the convolutional network-based deep learning technology has the ability to segment COVID-19 from CT images. We were able to collect a large number of CT images from 5 hospitals, which included 861 patients with confirmed COVID-19. More importantly, we manually annotated these data by senior annotators. These contributions prove the prospect of improving diagnosis and treatment for COVID-19. In the future, we will extend the number of CT images from patients through multi-center collaborations.
Acknowledgments
This work was partially supported by Application for Independent Research Project of Tsinghua University (Project Against SARI), Zhejiang University special scientific research fund for COVID-19 prevention and control, ARC under Grant DP160100703. Qingsen Yan and Bo Wang are contributed equally to this work.
Biographies

Qingsen Yan received the PhD degree in computer science and technology from Northwestern Polytechnical University, Xi'an, China, in 2019. Currently, he is a research staff with the School of Computer Science, University of Adelaide, Australia. His research interests include image processing, deep learning, and computer vision.

Bo Wang received the bachelor's degree from the Information Security Department, Xidian University, Xi'an, China, in 2017. Currently, he is working toward the PhD degree in the Department of Precision Instrument, Tsinghua University, Beijing, China. His research interests include computer vision and deep learning.

Dong Gong received the PhD degree in computer science and technology from Northwestern Polytechnical University, Xi'an, China, in 2019. He is a research staff with the School of Computer Science, University of Adelaide, Australia. His research interests include image processing, machine learning, and video analysis.

Chuan Luo received the PhD degree in computer science and technology from Tsinghua University, Beijing, China, in 2010. He is a research staff with the State Key Laboratory of Precision Measurement Technology and Instruments, Tsinghua University.

Wei Zhao received the bachelor's and MS degrees from Xidian University, Xi'an, China, in 2014 and 2017. He is working with Beijing Jingzhen Medical Technology Ltd.

Jianhu Shen received the bachelor's degree from Xidian University, Xi'an, China, in 2014. He is working with Beijing Jingzhen Medical Technology Ltd.

Jingyang Ai currently is working with Beijing Jingzhen Medical Technology Ltd.

Qinfeng Shi received the bachelor's and master's degrees in computer science and technology from the Northwestern Polytechnical University (NPU), Xi'an, China, in 2003 and 2006, respectively, and the PhD degree in computer science from the Australian National University (ANU), Canberra, Australia in machine learning, in 2011. He is a senior lecturer with the School of Computer Science, University of Adelaide. His interests include machine learning, computer vision, and compressive sensing, particularly structured learning and probabilistic graphical models. He was an ARC Discovery Early Career Researcher Award (DECRA) Fellow between 2012-2014.

Yanning Zhang received the BS degree from the Dalian University of Technology, Dalian, China, in 1988, the MS degree from the School of Electronic Engineering, Northwestern Polytechnical University, Xi'an, China, in 1993, and the PhD degree from the School of Marine Engineering, Northwestern Polytechnical University, Xi'an, China, in 1996. She is currently a professor with the School of Computer Science, Northwestern Polytechnical University. She is also a Cheung Kong professor of Ministry of Education, China. She has authored more than 200 papers. Her current research interests include remote sensing image analysis, computer vision, and pattern recognition and etc. She is the associate editor of the IEEE Transactions on Geoscience and Remote Sensing.
Shuo Jin received the PhD degree from Tsinghua University, Beijing, China. He is a doctor with Beijing Tsinghua Changgung Hospital, School of Clinical Medicine, Tsinghua University.

Liang Zhang received the PhD degree in instrument science and technology from Zhejiang University, Hangzhou, China, in 2009. In 2009, he joined the School of Software, Xidian University, where he is currently an associate professor and the director of the Embedded Technology and Vision Processing Research Center. He has authored more than 40 academic papers in peer-reviewed international journals and conferences. His research interests lie in the areas of multicore embedded systems, computer vision, deep learning, simultaneous localization and mapping, human robot interaction, and image processing.

Zheng You received the BS, MS, and PhD degrees from the Department of Mechanical Engineering, Huazhong University of Science and Technology, Wuhan, China, in 1985, 1987, and 1990, respectively. In 1990.11-1992.11, he worked as a post-doctorate research fellow with the Department of Precision Instrument and Mechanology, Tsinghua University. In 1992.12-1994.11, he became an associate professor with Tsinghua University. Since December of 1994, he is a full professor with Tsinghua University. In 1998.10-2000.3, he was a visiting professor with the University of Surrey, U.K. He was awarded as Chinese PhD degree holder who has made outstanding Achievements by Commission of Education in 1992, awarded as distinguished professor of Cheung Kong Scholars Program by Ministry of Education in 1999, and awarded as China Excellent post-doctorate by Ministry of Human Resource and Social Security in 2005. He is elected as academician of Chinese Academy of Engineering in 2013.
Funding Statement
This work was partially supported by Application for Independent Research Project of Tsinghua University (Project Against SARI), Zhejiang University special scientific research fund for COVID-19 prevention and control, ARC under Grant DP160100703.
Contributor Information
Qingsen Yan, Email: qingsenyan@gmail.com.
Bo Wang, Email: wang-b17@mails.tsinghua.edu.cn.
Dong Gong, Email: edgong01@gmail.com.
Chuan Luo, Email: chuanluo@jingzhentech.com.
Wei Zhao, Email: weizhao@jingzhentech.com.
Jianhu Shen, Email: jianhushen@jingzhentech.com.
Jingyang Ai, Email: jingyang@jingzehm.com.
Qinfeng Shi, Email: shiqinfeng@gmail.com.
Yanning Zhang, Email: ynzhang@nwpu.edu.cn.
Shuo Jin, Email: shuojin@jingzhentech.com.
Liang Zhang, Email: liangzhang@jingzhentech.com.
Zheng You, Email: yz-dpi@mail.tsinghua.edu.cn.
References
- [1].W. H. O., “Coronavirus disease (COVID-19) pandemic,” 2020. [Online]. Available: https://www.who.int/emergencies/diseases/novel-coronavirus-2019
- [2].WHO, “Coronavirus disease 2019 (COVID-19): Situation report – 43,” 2020. Accessed: Apr. 2, 2020. [Online]. Available: https://www.who.int/docs/default-source/coronaviruse/situation-reports/20200303-sitrep-43-covid-19.pdf?sfvrsn=2c21c09c_2
- [3].Bai H. X., et al. , “Performance of radiologists in differentiating COVID-19 from non-COVID-19 viral pneumonia at chest CT,” Radiology, vol. 296, no. 2, pp. 46–54, 2020. [DOI] [PMC free article] [PubMed] [Google Scholar]
- [4].Ai T., et al. , “Correlation of chest CT and RT-PCR testing for coronavirus disease 2019 (COVID-19) in China: A report of 1014 cases,” Radiology, vol. 296, no. 2, pp. 32–40, 2020. [DOI] [PMC free article] [PubMed] [Google Scholar]
- [5].Fang Y., et al. , “Sensitivity of chest CT for COVID-19: Comparison to RT-PCR,” Radiology, 2020. [Online]. Available: https://doi.org/10.1148/radiol.2020200432 [DOI] [PMC free article] [PubMed]
- [6].Wang D., et al. , “Clinical characteristics of 138 hospitalized patients with 2019 Novel Coronavirus? Infected pneumonia in Wuhan, China,” JAMA, vol. 323, no. 11, pp. 1061–1069, Mar. 2020. [DOI] [PMC free article] [PubMed] [Google Scholar]
- [7].Yan Q., et al. , “An attention-guided deep neural network with multi-scale feature fusion for liver vessel segmentation,” IEEE J. Biomed. Health Inform., to be published, doi: 10.1109/JBHI.2020.3042069. [DOI] [PubMed] [Google Scholar]
- [8].Wang B., et al. , “AI-assisted CT imaging analysis for COVID-19 screening: Building and deploying a medical AI system,” Appl. Soft Comput., vol. 98, 2020, Art. no. 106897. [DOI] [PMC free article] [PubMed] [Google Scholar]
- [9].Yan Q., Gong D., and Zhang Y., “Two-stream convolutional networks for blind image quality assessment,” IEEE Trans. Image Process., vol. 28, no. 5, pp. 2200–2211, May 2019. [DOI] [PubMed] [Google Scholar]
- [10].Gong D., et al. , “From motion blur to motion flow: A deep learning solution for removing heterogeneous motion blur,” in Proc. IEEE Conf. Comput. Vis. Pattern Recognit., 2017, pp. 3806–3815. [Google Scholar]
- [11].Yan Q., et al. , “Deep HDR imaging via a non-local network,” IEEE Trans. Image Process., vol. 5, no. 29, pp. 4308–4322, 2020. [DOI] [PubMed] [Google Scholar]
- [12].He T., et al. , “Knowledge adaptation for efficient semantic segmentation,” in Proc. IEEE/CVF Conf. Comput. Vis. Pattern Recognit., 2019, pp. 578–587.
- [13].Yan Q., et al. , “Towards accurate HDR imaging with learning generator constraints,” Neurocomputing, vol. 428, pp. 79–91, 2021. [Google Scholar]
- [14].Snaauw G., et al. , “End-to-end diagnosis and segmentation learning from cardiac magnetic resonance imaging,” in Proc. IEEE 16th Int. Symp. Biomed. Imag., 2019, pp. 802–805. [Google Scholar]
- [15].Yan Q., et al. , “Multi-scale dense networks for deep high dynamic range imaging,” in Proc. IEEE Winter Conf. Appl. Comput. Vis., 2019, pp. 41–50. [Google Scholar]
- [16].Gong D., et al. , “Memorizing normality to detect anomaly: Memory-augmented deep autoencoder for unsupervised anomaly detection,” in Proc. IEEE/CVF Int. Conf. Comput. Vis., 2019, pp. 1705–1714.
- [17].Yan Q., et al. , “Attention-guided network for ghost-free high dynamic range imaging,” in Proc. IEEE/CVF Conf. Comput. Vis. Pattern Recognit., 2019, pp. 1751–1760.
- [18].Yan Q., et al. , “Ghost removal via channel attention in exposure fusion,” Comput. Vis. Image Understanding, vol. 201, 2020, Art. no. 103079. [Google Scholar]
- [19].Wang L., et al. , “COVID-net: A tailored deep convolutional neural network design for detection of COVID-19 cases from chest x-ray images,” Sci. Rep., vol. 10, no. 1, pp. 1–12, 2020. [DOI] [PMC free article] [PubMed] [Google Scholar]
- [20].Wang S., et al. , “A deep learning algorithm using CT images to screen for Corona Virus disease (COVID-19),” MedRxiv, 2020. [DOI] [PMC free article] [PubMed]
- [21].Joaquin A. S., “Using deep learning to detect pneumonia caused by NCOV-19 from X-Ray images,” 2020. Accessed: Apr. 2, 2020. [Online]. Available: https://towardsdatascience.com/using-deep-learning-to-detect-ncov-19-from-x-ray-images-1a89701d1acd
- [22].Chowdhury M. E. H., et al. , “Can AI help in screening viral and COVID-19 pneumonia?,” 2020, arXiv: 2003.13145.
- [23].Gozes O., et al. , “Rapid AI development cycle for the coronavirus (COVID-19) pandemic: Initial results for automated detection & patient monitoring using deep learning ct image analysis,” 2020, arXiv: 2003.05037.
- [24].Tang Z., et al. , “Severity assessment of coronavirus disease 2019 (COVID-19) using quantitative features from chest CT images,” 2020, arXiv: 2003.11988.
- [25].Shi F., et al. , “Large-scale screening of COVID-19 from community acquired pneumonia using infection size-aware classification,” 2020, arXiv: 2003.09860. [DOI] [PubMed]
- [26].Shan F., et al. , “Lung infection quantification of COVID-19 in CT images with deep learning,” 2020, arXiv: 2003.04655.
- [27].Hu J., Shen L., and Sun G., “Squeeze-and-excitation networks,” in Proc. IEEE Conf. Comput. Vis. Pattern Recognit., 2018, pp. 7132–7141. [Google Scholar]
- [28].Zhao L., Wang J., Li X., Tu Z., and Zeng W., “Deep convolutional neural networks with merge-and-run mappings,” 2016, arXiv:1611.07718.
- [29].Chen L.-C., Papandreou G., Kokkinos I., Murphy K., and Yuille A. L., “DeepLab: Semantic image segmentation with deep convolutional nets, atrous convolution, and fully connected CRFs,” 2016, arXiv:1606.00915. [DOI] [PubMed]
- [30].Yang B. and Zhang W., “FD-FCN: 3D fully dense and fully convolutional network for semantic segmentation of brain anatomy,” 2019, arXiv: 1907.09194.
- [31].Çiçek Ö., Abdulkadir A., Lienkamp S. S., Brox T., and Ronneberger O., “3D U-Net: Learning dense volumetric segmentation from sparse annotation,” in Proc. Int. Conf. Med. Image Comput. Comput.-Assisted Intervention, 2016, pp. 424–432. [Google Scholar]
- [32].Zhou Z., Siddiquee M. M. R., Tajbakhsh N., and Liang J., “Deep convolutional neural networks with merge-and-run mappings,” 2018, arXiv: 1807.10165.
- [33].Milletari F., Navab N., and Ahmadi S.-A., “V-Net: Fully convolutional neural networks for volumetric medical image segmentation,” in Proc. 4th Int. Conf. 3D Vis., 2016, pp. 565–571. [Google Scholar]
- [34].Mehta S., Rastegari M., Caspi A., Shapiro L., and Hajishirzi H., “ESPNet: Efficient spatial pyramid of dilated convolutions for semantic segmentation,” in Proc. Eur. Conf. Comput. Vis., 2018, pp. 552–568. [Google Scholar]