

Abstract
An outbreak of COVID-19 that began in late 2019 was caused by a novel coronavirus(SARS-CoV-2). It has become a global pandemic. As of June 9, 2020, it has infected nearly 7 million people and killed more than 400,000, but there is no specific drug. Therefore, there is an urgent need to find or develop more drugs to suppress the virus. Here, we propose a new nonlinear end-to-end model called LUNAR. It uses graph convolutional neural networks to automatically learn the neighborhood information of complex heterogeneous relational networks and combines the attention mechanism to reflect the importance of the sum of different types of neighborhood information to obtain the representation characteristics of each node. Finally, through the topology reconstruction process, the feature representations of drugs and targets are forcibly extracted to match the observed network as much as possible. Through this reconstruction process, we obtain the strength of the relationship between different nodes and predict drug candidates that may affect the treatment of COVID-19 based on the known targets of COVID-19. These selected candidate drugs can be used as a reference for experimental scientists and accelerate the speed of drug development. LUNAR can well integrate various topological structure information in heterogeneous networks, and skillfully combine attention mechanisms to reflect the importance of neighborhood information of different types of nodes, improving the interpretability of the model. The area under the curve(AUC) of the model is 0.949 and the accurate recall curve (AUPR) is 0.866 using 10-fold cross-validation. These two performance indexes show that the model has superior predictive performance. Besides, some of the drugs screened out by our model have appeared in some clinical studies to further illustrate the effectiveness of the model.
Keywords: COVID-19, SARS-CoV-2, Drug repurposing, Graph convolutional network
1. Introduction
In December 2019, coronavirus disease 2019 (COVID-19) was caused by an unknown pathogen that emerged in Wuhan, a city of 11 million people in China [1]. Novel coronavirus outbreaks and SARS outbreaks share many characteristics: both occur in winter, are associated with live poultry markets, and are caused by an unknown coronavirus [2]. Signs of infection are nonspecific, including respiratory symptoms, fever, cough, dyspnea, and viral pneumonia [3]. Among those with no immunity at all, the average number of infected people who transmitted the virus to others was about 3.77 [4]. The number of confirmed cases has increased dramatically since January 17, and COVID-19 has been designated by the world health organization as a public health emergency of international concern. On 9 June 2020, more than 7 million cases of COVID-19 and over 400 000 deaths have now been reported to WHO. Although the situation in Europe is improving, globally it is worsening [5]. This shows that the virus is so dangerous around the world that there is an urgent need for drugs to treat or inhibit it.
Because the pharmacokinetic properties and toxicity of the drugs used have been studied in-depth, drug repositioning can not only save a lot of drug design and screening costs in the early stages of drug development but also greatly reduce the risks in the later stages of drug development. The correlation of drug targets can be studied using computer prediction to narrow the search space for candidate experimental drugs, which can provide a reference for drug discovery and repositioning and reduce the corresponding time and cost [6]. Therefore, using computational methods to perform virtual screening to find out some potential drugs that are effective against COVID-19 can guide experimental scientists and verify molecules that can fight the virus in a shorter time [7].
In recent years, many efforts have focused on using machine-learning methods to predict drug-target correlation. Therefore, many machine learning models have emerged [8], [9], [10] to improve prediction performance. Most of these efforts are based on the association principle, which treats the prediction task as a binary classification question, that is, to predict whether the drug-target correlation exists. However, in some machine learning methods, it may not be enough to get the complex hidden features behind heterogeneous data by restricting the model to a simple form, such as bilinear or log-bilinear functions, and so on [11]. With the rise and development of deep learning, researchers can construct a deeper learning model with better performance, so that it can better extract useful and complex information from large-scale correlation network data and improve the accuracy of drug-target correlation prediction [12]. So researchers are gradually transitioning from researching machine learning methods to researching deep learning methods for drug discovery [13] and proposed many useful deep learning models [14], [15], [16], [17]. Recently, more and more researchers are focusing on deep learning methods on graphic data. To process complex graph data, many researchers draw on the idea of deep learning in the image to design the architecture of neural networks. In the past few years, the concepts, operations, and models of graph neural networks have been constantly evolving and developing [18]. This has greatly promoted the development of drug-target correlation prediction. Graph convolutional neural network shows strong performance in extracting graphics embedding [19], [20], which motivates us to combine it with drug target prediction and extract useful information from the complex network to better predict drug targets.
Heterogeneous data sources can provide more information and different perspectives for the prediction of drug-target correlation. Therefore, the use of heterogeneous data sources, such as drug-disease correlation network data and drug-side effect correlation network data, can improve the accuracy of drug-target interaction prediction to a certain extent [21]. For example, DTINet [21], DeoDTI [11], and other methods, however, there are still some problems to be solved in these methods. For example, DTINet [21] may not produce an optimal solution by separating feature learning from the prediction task at hand. When aggregating different types of interaction relations, DeoDTI [11] simply added and did not consider that different types of interaction relations may have different influences on nodes.
In this paper, we propose a new model called LUNAR (Drug Screening for Novel Coronavirus Based on Representation Learning Graph Convolutional Network). Our model is innovative to combine the graph convolutional neural network based on the spatial domain with the attention mechanism. When representing node-level embedding in a heterogeneous network, our model can reflect the impact of different types of interactions on node embedding and get better and more interpretable embedding. The flow of our model is as follows: we first formed a heterogeneous network of 12 different types of relationship networks, including drug-drug interaction, drug-structure similarity, drug-disease association, drug-side effect association, drug-protein interaction, disease-drug association, and side-effect-drug association. Then, the graph convolutional neural network is used to automatically learning the neighborhood information of the complex heterogeneous relationship network and integrate the attention mechanism to reflect the importance of the sum of different types of neighborhood information to obtain the representation characteristics of each node. After that, LUNAR applied the method of network topology reconstruction to extract the feature representation in the relational heterogeneous network. In this way, we can get the repositioning network whose edge weight indicates the strength of the relationship. Finally, based on the relocation network and COVID-19-related targets, we screened out drugs that may be useful for the treatment of COVID-19.
Considering that the heterogeneous network in the data set is too sparse, the number of negative samples is much larger than that of positive samples, and there are many false counterexamples, we use the area under the accurate recall curve (AUPR) as the evaluation index of the model, which can better reflect the performance of the model when the data are unbalanced. Our model performs well in comparison with other advanced drug repositioning methods based on heterogeneous relational networks. Moreover, our model not only uses a powerful graphical representation method, a graph convolutional neural network but also introduces an attention mechanism, which can better reflect the degree of influence of different relationship types on nodes and more closely fit the actual situation. In addition, some drug candidates screened by our model have appeared in some clinical studies, which further shows that LUNAR has excellent predictive ability and can accelerate drug development.
In summary, the contributions of our work are as follows:(1) a new model is proposed, which can obtain more interpretable node embeddings when characterizing heterogeneous networks. (2) this model is end-to-end, and it can not only screen out drugs for the new coronavirus but also apply to other viruses. It has good applicability and scalability and can be used as a good aid for drug development. (3) some of the candidate drugs screened out by our model have appeared in some clinical studies.
2. Methods
2.1. Problem Formulation
Our model constructs a heterogeneous relationship network among drugs, targets, side effects and diseases, and predicts drug-target according to a drug's interaction with drugs, targets, side effects and diseases. The heterogeneous network is constructed as follows: the general representation of the graph is G = (V,E), where V is the set of nodes in the graph and E is the set of edges in the graph. In this study, the drug, target and other objects are represented as nodes, and the interactions or associations among nodes are represented as edges. So the object type set O {drugs, targets, diseases, side effects}, a total of 4 kinds. And the relationship type set R {drug-drug interaction, drug-structural similarity, drug-disease association, drug-side effect association, disease-drug association, side effect-drug association, drug-protein interaction, protein-drug interaction, protein-protein interaction, protein-sequence similarity, protein-disease association, disease-protein association}, a total of 12 kinds. Besides, all edge types are undirected and the edge values are non-negative. Moreover, the same two nodes can have multiple different types of edge connections, for example, the edge type between two proteins (targets) can be target-target interaction and target-sequence similarity.
Given a heterogeneous network, LUNAR maps the network topology information and unique information of the node itself to its corresponding feature space and retains its original topology information as much as possible, that is, learning the node-level embedding of heterogeneous networks. Most existing techniques for learning structured data embedding mainly use their contextual information to describe. For example, in natural language processing, words are embedded in semantic relationships that contain the corresponding words around them. In graphic embedding technology, Random walk [22], [23] uses a similar principle to retain the original topological information to learn the embedded representation of network data. Graph convolutional neural networks have strong performance in extracting graph embeddings [19], [20], which inspired us to use it to predict drug-target interaction, integrate key information from complex heterogeneous networks, and better predict drug-target relationships. However, our LUNAR model not only applies a powerful graph convolutional neural network to learn graph node-level embedding but also integrates the attention mechanism [24], so that node embedding can better express the degree of influence of different relationship types on nodes, making the embedded nodes more interpretable. Fig. 1 is the architecture of our LUNAR model. It consists of three main parts: relational graph convolutional neural network (Section 2.2), attention mechanism (Section 2.3), and network topology reconstruction (Section 2.4).
Fig. 1.
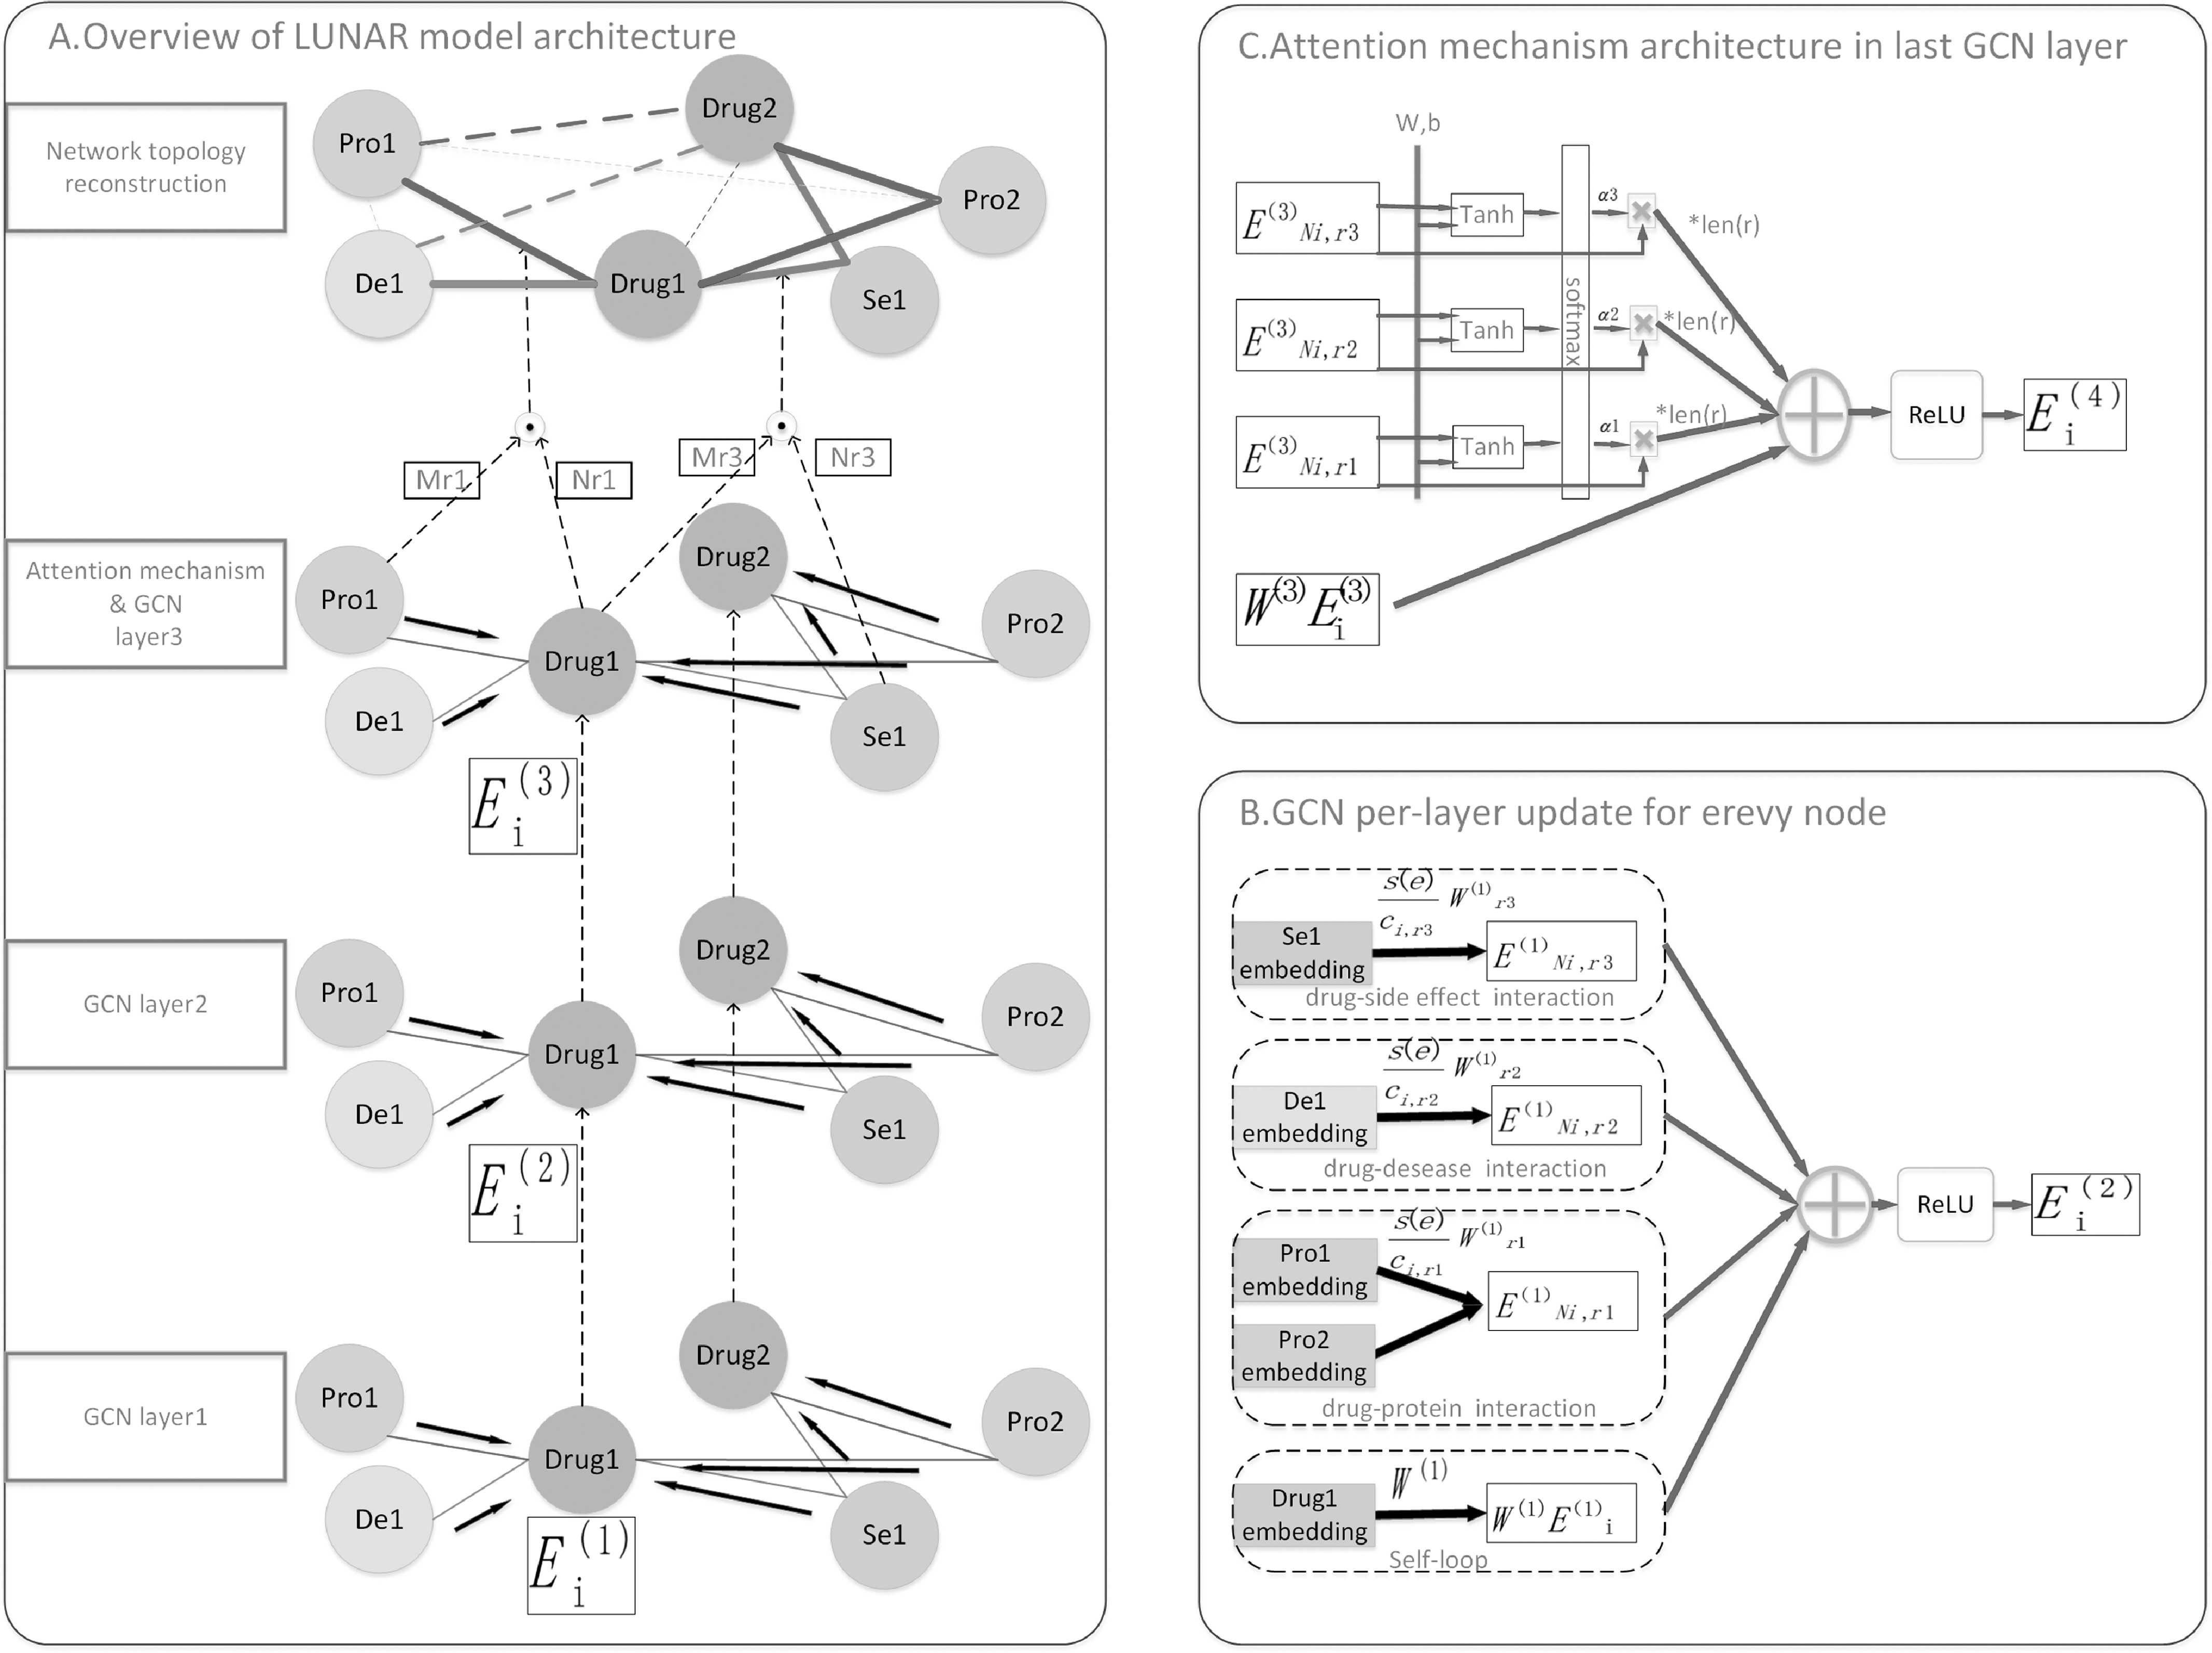
The model for LUNAR. A. The first three layers take the representation learning of drug embedding as an example and use graph convolutional neural network to aggregate the information of itself and other nodes in the neighborhood. Different edge types are represented with different colors. The learned embedding serves as the embedded representation of the next level of nodes. In the third layer to get the final representation of the node, the model uses a combination of graph convolutional neural network and attention mechanism. When the neighborhood information of different edge types is aggregated, the attention mechanism is added. The domain information of different edge types is Node embedding has different degrees of influence, making the representation of node embedding more interpretable. After getting the embedding of all the nodes, the method of network topology reconstruction is used to get the repositioning network. In the repositioning network, the solid line is the existing connection in the original network, and the dashed line is the new connection. The thickness of the line represents the magnitude of the relationship strength. B. This is a schematic diagram of a graph convolutional neural network. First, the same edge type information is aggregated to obtain the sum of neighborhood information of different edge types. Finally, it is added to the map embedded in the node itself. C. This is a schematic diagram of the combination of graph convolutional neural network and attention mechanism. The attention mechanism is used for the sum of the domain information of different edge types to obtain different attention coefficients, and the product of the attention coefficient and the sum of the original domain information is aggregated as the new domain information of a certain edge type.
2.2. Relational Graph Convolutional Neural Network
Given a heterogeneous network, the embedding of the graph convolutional neural network in the layer l of one node i and its neighbor embedding  , then the layer l+1 embedding of node i can be expressed as:

|
where  represents the neighbor set of node i under relation r,
  represents the sum of boundary values between node i and its neighbors with edge type r, s(e) represents the boundary values between node i and node j, and W represents the weight in the neural network.
Intuitively, for the graph convolutional neural network of heterogeneous networks, we introduce relation-specific transformation, that is, depending on the type and direction of the edges. For each edge type r, we first use a nonlinear transformation to process the neighbor embedding of node i, and then average it by normalizing the edge weights, so that we can obtain the neighborhood information aggregation of node i about each edge type r. After summing the neighborhood information of all edge types of node i, we can get the sum of neighborhood information of node i. Finally, the sum of this neighborhood information and the node's own embedded transformed feature vector are combined, so that the embedded representation of the node i in the next layer contains both the neighborhood information of the node and the special information of the node itself. Besides, the multi-layer graph convolutional neural network is stacked to make the neural network deeper and better learn the node-level embedding of heterogeneous networks.
2.3. Attention Mechanism
Here, the attention mechanism of our model is combined with the last layer of the graph convolutional neural network. After the last layer graph convolutional neural network obtains the sum of the neighborhood information of different relationship types r, we use the attention mechanism to assign the neighborhood information of different relationship types to different importance levels and guide the final node embedding. The formula of attention mechanism is as follows:

|

|

|
where  is the sum of neighborhood information of node i with relation type r, then it is processed by the softmax function to obtain the attention coefficient
  about node i and relationship type r. Finally, multiply it by the original embedding
  to get the sum of domain information
  of different relationship types after adding an attention mechanism.
Also, the sum of this processed domain information is multiplied by the number of different relationship types, plus the map of the node embedded in the previous layer, and processed by the activation function to obtain the final node embedding.
2.4. Network Topology Reconstruction
Given the node embeddings processed by the multi-layer graph convolutional neural network and the attention mechanism, all the boundary values and the network topology reconstruction formula can be defined as:

|
where  ,
,  is the projection matrix of a particular edge type r. If the edge type r is symmetric, such as drug-drug correlation, protein-protein correlation, then
  =
= . The inner product of the two projected vectors can be carried out after the edge is projected to represent
  and
and by
by  and
and  respectively. Let this inner product result reconstruct the original edge value s(e) as much as possible. All of the weights and projection matrices that are used in all of these definitions are initialized with a gaussian.
2.5. LUNAR Model Training
LUNAR divides the data set into 10 homogenous and mutually exclusive subsets, each of which is obtained through random stratified sampling. Then treat each of the nine mutually exclusive subsets as a training set and the rest as a test set every time, so the data set could be divided into 10 folds. Also, because there are many ways to divide into 10 subsets, to reduce the difference, LUNAR repeats the 10-fold cross-validation 10 times, averaging the final evaluation results. The advantage of using the 10-fold cross-validation method is that it can reduce the negative impact of data partitioning and reduce the degree of overfitting to a certain extent. In LUNAR, 5 percent is randomly selected from the training set as the verification set. Besides, compared with the training set and the test set, the verification set is relatively small. If the gradient descent of the loss function is not effective in the verification set, the test set can not be used in this iteration, thus reducing unnecessary calculations.
To optimize the model, we use the Adam optimizer, which will simultaneously consider the moment estimation of the first-order gradient and the second-order moment estimation, and calculate the updated step size. It can be seen from the above operation of node embedding that the mathematical operations to construct the loss function are differentiable, which meets the application requirements of the Adam optimizer. Also, the Adam optimizer is robust in the selection of super parameters and can control the learning rate. Moreover, the update step size is not affected by the gradient size, so the system can better deal with the sparse gradient. Therefore, the system USES the Adam optimizer to find the global minimum value of loss function.
Besides, the parameters of the model are determined using grid search (for example, setting the number of hidden layer nodes of the neural network to vary from 256, 512 to 1024). Specifically, LUNAR uses a 3-layer neural structure with a node embedding dimension of 1024, graph convolutional neural network and attention layer with 1024 hidden units, network topology reconstruction layer with 512 hidden units, and a learning rate of 0.001.
3. Rusults
3.1. The Data Set
We use the data set of a previous paper [11], which contains six separate interacting or related networks: drug-protein interactions network and drug-drug interaction network, protein-protein interaction network, drug-disease association, and protein-associated network and drug side-effects associated network. Among them, the drug-target interaction network and the drug-drug interaction network are extracted from the DRGUBANK database (version 3.0) [25]. The protein-protein interaction network was obtained from the HPRD database (Release 9) [26]. The drug-disease association and protein-disease association networks are downloaded from the Comparative Toxicogenomics Database [27]. The drug-side effect association network was obtained from the SIDER database (version 2) [28]. In the process, we exclude those isolated nodes, that is, we only consider those nodes that have at least one edge in the network. For different networks, we take the intersection of these nodes of the same type. Besides, the data set also contains two additional networks to reflect the information of chemical structure similarity of the drug and protein-sequence similarity: the drug-chemical structure similarity network (measured by the dice similarities of the Morgan fingerprints with radius 2, which were computed by RDKit [11]) and the protein-sequence similarity network(which was obtained based on the pair-wise Smith-Waterman scores [11]). Among the eight relational networks, the drug structure similarity network and the protein sequence similarity network have non-negative real-value edge weights, while the other networks have binary edge weights of 0 and 1, which respectively represent the unknown interaction or association and the known interaction or association network. We combined these eight networks to construct a heterogeneous network containing a total of 708 drugs, 1512 targets, 5,603 diseases, and 4,192 side effects, which includes 12,015 nodes and 1,895,445 edges in total. Details can be obtained from Table 1.
TABLE 1. Statistics of the Dataset Used in this Study.
| Drugs 708 | Targets 1512 | Diseases 5603 | Side effect 4192 |
|---|---|---|---|
| Drug-Drug 10036 | Drug-Target 1923 | Drug-Disease 199214 | Drug-Side effect 80164 |
| Target-Target 7363 | Target-Disease 1596745 |
3.2. LUNAR has Excellent Predictive Performance
We regard drug-target prediction and drug discovery as the task of link prediction. Nodes connected by edges indicate that this is a known interaction or association, while nodes that are not connected by edges indicate an undiscovered action relationship or no relationship. This can be thought of as a binary classification problem, where the known are positive examples and the unknown are negative examples. Our model is to find potential undiscovered action relationships based on existing relationships in complex heterogeneous networks. When conducting the comparison experiment, we first consider that all unknown pairs are regarded as negative examples, and use ten-fold cross-validation to divide the training set and the test set and take 5 percent of the samples of the training set as the verification set. Finally, the AUPR values of the ten test sets are averaged. We compare the performance with other advanced drug repositioning methods based on heterogeneous network NetLapRLS [29], DTINet [21] and DeoDTI [11]. We observe from Fig. 2 that LUNAR is superior to the other methods, with a 1.8 percent performance improvement over the second-best method on AUPR. In addition, considering that the drug-target interaction network in the data set is too sparse, the number of negative samples is much larger than the number of positive samples. So another option for evaluating LUNAR's performance is to randomly sample all the negative samples from the drug-target interaction network, taking ten times the number of positive samples as a counterexample in the data set. This mimics the actual situation of sparse markers of drug-target interaction [11]. After that, the data set of the training model will be composed of the counter-examples and all positive examples sampled from the drug-target interaction network as well as all positive and negative examples from other interaction networks. At last, the model was trained and tested by 10 folds cross-validation, and the performance index of the model was obtained. We observed that the AUPR of our model increased by 27.3 percent to a high index value of 86.6 percent (Fig. 2). To sum up, the LUNAR high-performance index value proves LUNAR's strong ability of drug target prediction and drug discovery.
Fig. 2.

In the left subgraph where all unknown pairs are treated as negative examples, we observed that LUNAR was superior to the other methods, with a 1.8 percent performance improvement over the second-best method on AUPR. The right sub-graph is a random sampling of all negative samples of the drug-target interaction network. The number of positive examples is ten times the number of negative examples in the data set. We observe that our model has a 27.3 percent increase in AUPR compared to the left sub-graph, reaching a high index value of 86.6 percent, which is 8 percent higher than DTINet and is not much different from the DeoDti model.
Next, we do a more in-depth analysis. Compared with our model LUNAR, DTINet [21] separates feature learning from the prediction task at hand, and this method may not produce an optimal solution, which highlights the advantages of the end-to-end model. When LUNAR considers all unknown pairs as negative examples, that is, when heterogeneous networks are too sparse, the AUPR value is superior to DeoDTI [11]. It may be that the construction of graph convolutional neural networks is characterized by the application of relational induction bias to structured data modeling. In a broader sense, a graph convolutional network applies to any data structure that can be represented as a graph. In addition, when DeoDTI [11] aggregates different types of interaction relations, it simply sums them up, without considering that different types of interaction relations may have different effects on nodes. LUNAR uses an attention mechanism, which can better reflect the impact of different relationship types of information on nodes, as shown in Fig. 3. It is more in line with the actual situation and better in terms of explainability. Overall, LUNAR is a powerful model for drug target prediction and drug discovery.
Fig. 3.

This is the attention coefficient representing the sum of neighborhood information of different edge types when learning the embedding of a drug. The embedded dimension is 1024 dimensions, and each dimension has an attention factor. The darker the color, the greater the influence. Looking from left to right, we observe that the overall attention coefficient of each dimension of the same edge type is not very different. From top to bottom, we observe that the attention coefficients of different edge types have obvious color differences and a sense of hierarchy. This shows that the influence of the sum of the domain information of different edge types on the embedding representation of the node is different overall. For this drug node, the sum of the domain information of the interaction between the drug and the drug has the greatest influence on its embedding.
We also made a set of comparative experiments, that is, to remove the attention mechanism in LUNAR, and observe the changes in the performance indicators AUC and AUPR of the model under the condition of NO. negative: NO. positive = 10:1. As shown in Fig. 4, we found that LUNAR with the attention mechanism has better performance than the LUNAR model without the attention mechanism. Specifically, LUNAR with the attention mechanism increased by 0.8 percent in AUC and 1.8 percent in AUPR. This shows that adding an attention mechanism can not only improve the interpretability of the model, but also allow the model to better extract the topology information of the nodes and can improve the performance of the model.
Fig. 4.

Remove the attention mechanism in LUNAR and observe the changes in the performance indicators AUC and AUPR of the model under the condition of NO. negative: NO. positive = 10:1 using 10-fold cross-validation.
Finally, we do a comparative experiment to explore the impact of training data size on prediction accuracy. LUNAR uses 10 cross-validation methods to divide the training set and the data set, that is, the data set is divided into 10 homogeneous and mutually exclusive subsets, and each subset is obtained through random stratified sampling. Then nine mutually exclusive subsets are used as the training set, and the remaining subset is used as the test set. We change the size of the training set by changing the number of cross-validation. Specifically, we use 10-fold cross-validation methods, 5-fold cross-validation methods, 3-fold cross-validation methods, and 2-fold cross-validation methods to construct the training set and test set, and use these training sets to train models to compare prediction accuracy. It can be seen from Fig. 5 that as the size of the training set decreases, the prediction performance decreases. It is worth noting that the use of the 2-fold cross-validation method has the greatest performance degradation on the AUPR index.
Fig. 5.

Comparison of model prediction performance of different sizes of training data.
3.3. Screening Candidate Drugs Based on Targets Related to COVID-19
Next, we train LUNAR under the condition of NO. Negative: NO. Positive = 10:1, and get the repositioning network with different relationship strengths of the edge weight. Based on the model, we specified the following strategies: first, we list those targets that are closely related to COVID-19 in the Comparative Toxicogenomics Database [30]. Among them, the targets that appear in our heterogeneous network data set are tumor necrosis factor(TNF), interleukin 6(IL6), interleukin 1 beta(IL1B), interleukin 2(IL2), CXC motif chemokine ligand 10(CXCL10), Bruton tyrosine kinase(BTK) and angiotensin-converting enzyme 2(ACE2). Based on the trained relocation network and these targets in the data set, we can screen candidate drugs that may affect COVID-19. Through this method, we can quickly and more specifically find candidate drugs for subsequent wet experiments.
The detailed information is as follows: In the relocation network, we respectively list the top10 drug candidates with the interaction confidence of these 7 targets. At the same time, the confidence of these top10 drug candidates must be greater than 0.5. After such treatment, we found that only the candidate drugs selected by the three targets of Tumor necrosis factor (P01375), Interleukin-1 beta (P01584), and ACE2 (Q9BYF1) meet the above requirements. Next, we will verify the drugs we have screened from some clinical studies. It can be seen from Table 2 that some of the drugs we have screened have appeared in some clinical studies.
TABLE 2. Candidate Drugs Predicted by the Model Based on the Targets.
| Target (Uniprot IDs) | Candidate drugs (DrugBank IDs) | Clinical study's NCT Number |
|---|---|---|
| Interleukin-1 beta (P01584) | Minocycline (DB01017) | |
| Arsenic trioxide (DB01169) | ||
| Thalidomide (DB01041) | NCT04273529 | |
| Tetracycline (DB00759) | ||
| Indomethacin (DB00328) | NCT04344457 | |
| ACE2 (Q9BYF1) | Quinapril (DB00881) | |
| Fosinopril (DB00492) | ||
| Cilazapril (DB01340) | ||
| Benazepril (DB00542) | ||
| Perindopril (DB00790) | ||
| Moexipril (DB00691) | ||
| Trandolapril (DB00519) | ||
| Atorvastatin (DB01076) | NCT04380402 | |
| Tumor necrosis factor (P01375) | Thalidomide (DB01041) | NCT04273529 |
| Chloroquine (DB00608) | ||
| Arsenic trioxide (DB01169) | ||
| Bortezomib (DB00188) | ||
| Zonisamide (DB00909) | ||
| Miconazole (DB01110) | ||
| Indomethacin (DB00328) | NCT04344457 | |
| Gemcitabine (DB00441) | ||
| Acetazolamide (DB00819) | ||
| Minocycline (DB01017) |
4. Conclusion
In summary, we propose a new model called LUNAR to screen drugs that may have a therapeutic effect on COVID-19. This is a new end-to-end model that does not require manual feature engineering. It integrates complex heterogeneous networks through convolutional neural networks and attention mechanisms, which can not only discover drugs for SARS-CoV-2, but also be applied to other viruses, and can be a good aid in drug development. The construction of a graph convolutional neural network is characterized by applying relational induction bias to a structured data model. In a broader sense, it applies to any data structure that can be represented as a graph and is therefore important in a variety of real-world applications. And, the attention mechanism enables node embedding to better express the influence of different relationship types on nodes, which makes the extracted node embedding more explanatory. The high-performance index of the LUNAR model shows the strong prediction ability of the model. Besides, some drugs predicted by LUNAR have appeared in clinical studies to further prove the effectiveness of the model. Therefore, we believe that LUNAR can screen out drugs that may have an effect on COVID-19 and accelerate drug development.
Acknowledgments
This work was supported in part by the National Key R&D Program of China under Grants 2017YFB0202602, 2018YFC0910405, 2017YFC1311003, 2016YFC1302500, 2016YFB0200400, and 2017YFB0202104, in part by NSFC under Grants U19A2067, 61772543, U1435222, 61625202, 61272056, 61832019, and 61503244, in part by Key Research Area, the Ministry of Science and Technology of China under Grant 2016YFA0501703, in part by the Science and Technology Commission of Shanghai Municipality under Grant 19430750600, in part by the Natural Science Foundation of Henan Province under Grant 162300410060, in part by SJTU JiRLMDS Joint Research Fund and Joint Research Funds for Medical and Engineering and Scientific Research at Shanghai Jiao Tong University under Grant YG2017ZD14, and in part by Peng Cheng Lab, State Key Laboratory of Chemo/Biosensing and Chemometrics, the Fundamental Research Funds for the Central Universities, and Guangdong Provincial Department of Science and Technology under Grant 2016B090918122.
Biographies

DeShan Zhou is currently working toward the master's degree with Hunan University, Changsha, China. His research interests include bioinformatics, big data, and artificial intelligence.

Shaoliang Peng is currently the executive director, a professor of the National Supercomputing Center in Changsha, Hunan University, Changsha, China, and an adjunct professor with BGI, Peng Cheng Lab, National University of Defense Technology Changsha, China. He was a visiting scholar with the CS Department, City University of Hong Kong from 2007 to 2008 and BGI Hong Kong from 2013 to 2014. He has authored or coauthored dozens of academic papers in several internationally influential journals, including Science, Nature Communications, Cell The American Journal of Human Genetics, Nucleic Acids Research, Genome Research, Bioinformatics, ACM / IEEE Transactions, Bioinformatics and Biomedicine. His research interests include high-performance computing, bioinformatics, big data, precision medicine, health informatics, and computer-aided drug design. He was an editor of several international journals, including executive editors of the International Journal of Biological Sciences and an associate editor for Interdisciplinary Sciences: Computational Life Sciences International Journal. He was the chairman and sponsor of the Hunan Provincial Bioinformatics Society, the deputy director of biological information professional group in CCF, the Program chairman of the 17th APBC Asia Pacific Regional Bioinformatics Conference Committee 2019, and invited speaker of the BIBM 2016 Conference.

Dong-Qing Wei is currently a tenured professor of bioinformatics with Department of Bioinformatics and Biostatistics, College of Life Science, Shanghai Jiaotong University, China, and an editor-in-chief of Interdisciplinary Sciences- Computational Life Sciences. More than the past three decades, he has made many grand breaking contributions to the development of molecular simulation techniques and their interdisciplinary applications to systems of ever-increasing complexity. He is best known for contributions to the development of molecular simulation and AI tools with applications to a wide range of chemical, physical and biological systems, from electrolytes, to polar liquids, to ferroelectric liquid crystals, to combined Quantum Mechanical or Molecular Mechanical (QM/MM) systems, to membrane proteins and protein-ligand complexes applied to computer-aided drug design. His most important contributions in sciences are exemplified by the discovery of ferroelectric nematic liquids crystals, the first complete ab initio MD simulation of explosion (nitromethane), and antiaging and antiAD drug candidate WGX-50. He has authored or coauthored more than 350 journal papers, nine monographs with 8000 SCI citations, and an H factor of 53. He was invited to give invited and plenary talks at more than 100 conferences, he also organized ten international conferences, including Theory and Computational Chemistry(ACC2008), AI and Precision Medicine in 2017 to 2018, and International Conference on Computational and System Biology in 2009 to 2015, among others.

Wu Zhong is currently the director, a researcher, and a doctoral tutor of the National Engineering Research Center for the Emergency Drug, Beijing Institute of Pharmacology and Toxicology, Beijing, China. He has been engaged in the innovation of emergency prevention and control of new drugs and the research on the industrialization of generic drugs for nearly 30 years. He was the recipient of the one first prize for national scientific and technological progress and one second prize for national technological invention.
Yutao Dou is currently working toward the Master of philosophy degree with the University of Sydney, Sydney, NSW, Australia. His research interests mainly include distributed computing, bioinformatics, and artificial intelligence.

Xiaolan Xie is currently a professor and doctoral supervisor with the School of Information Science and Engineering, Guilin University of Technology. She is currently the dean. Her research interests include cloud computing and big data.
Funding Statement
This work was supported in part by the National Key R&D Program of China under Grants 2017YFB0202602, 2018YFC0910405, 2017YFC1311003, 2016YFC1302500, 2016YFB0200400, and 2017YFB0202104, in part by NSFC under Grants U19A2067, 61772543, U1435222, 61625202, 61272056, 61832019, and 61503244, in part by Key Research Area, the Ministry of Science and Technology of China under Grant 2016YFA0501703, in part by the Science and Technology Commission of Shanghai Municipality under Grant 19430750600, in part by the Natural Science Foundation of Henan Province under Grant 162300410060, in part by SJTU JiRLMDS Joint Research Fund and Joint Research Funds for Medical and Engineering and Scientific Research at Shanghai Jiao Tong University under Grant YG2017ZD14, and in part by Peng Cheng Lab, State Key Laboratory of Chemo/Biosensing and Chemometrics, the Fundamental Research Funds for the Central Universities, and Guangdong Provincial Department of Science and Technology under Grant 2016B090918122.
Contributor Information
Deshan Zhou, Email: deshan_zhou@hnu.edu.cn.
Shaoliang Peng, Email: slpeng@hnu.edu.cn.
Dong-Qing Wei, Email: dqwei@sjtu.edu.cn.
Wu Zhong, Email: zhongwu@bmi.ac.cn.
Yutao Dou, Email: ydou5134@uni.sydney.edu.au.
Xiaolan Xie, Email: xie_xiao_lan@foxmail.com.
References
- [1].Zhu N., et al. , “A novel coronavirus from patients with pneumonia in China, 2019,” New Engl. J. Med., vol. 382, no. 8, pp. 727–733, 2020. [DOI] [PMC free article] [PubMed] [Google Scholar]
- [2].Xu X., et al. , “Evolution of the novel coronavirus from the ongoing Wuhan outbreak and modeling of ts spike protein for risk of human transmission,” Sci. China Life Sci., vol. 63, no. 3, pp. 457–460, 2020. [DOI] [PMC free article] [PubMed] [Google Scholar]
- [3].Huang C., et al. , “Clinical features of patients infected with 2019 novel coronavirus in Wuhan, China,” Lancet, vol. 395, no. 10223, pp. 497–506, 2020. [DOI] [PMC free article] [PubMed] [Google Scholar]
- [4].Yang Y., et al. , “Epidemiological and clinical features of the 2019 novel coronavirus outbreak in China,” MedRxiv, 2020. [DOI] [PubMed]
- [5].WHO. “Coronavirus disease (COVID-2019) situation reports,” Accessed: Jun. 9, 2020. [Online]. Available: https://www.who.int/emergencies/diseases/novel-coronavirus-2019/situation-reports/
- [6].Langley G. R., et al. , “Towards a 21st-century roadmap for biomedical research and drug discovery: Consensus report and recommendations,” Drug Discov. Today, vol. 22, no. 2, pp. 327–339, 2017. [DOI] [PubMed] [Google Scholar]
- [7].Zhang H., et al. , “Deep learning based drug screening for novel coronavirus 2019-nCov,” Interdiscipl. Sci. Comput. Life Sci., vol. 12, no. 3, pp. 368–376, Sep, 2020. [DOI] [PMC free article] [PubMed] [Google Scholar]
- [8].Bleakley K., and Yamanishi Y., “Supervised prediction of drug–target interactions using bipartite local models,” Bioinformatics , vol. 25, no. 18, pp. 2397–2403, 2009. [DOI] [PMC free article] [PubMed] [Google Scholar]
- [9].Yamanishi Y., Araki M., Gutteridge A., Honda W., and Kanehisa M., “Prediction of drug–target interaction networks from the integration of chemical and genomic spaces,” Bioinformatics , vol. 24, no. 13, pp. i232–i240, 2008. [DOI] [PMC free article] [PubMed] [Google Scholar]
- [10].Ezzat A., Wu M., Li X. -L., and Kwoh C. -K., “Drug-target interaction prediction using ensemble learning and dimensionality reduction,” Methods , vol. 129, pp. 81–88, 2017. [DOI] [PubMed] [Google Scholar]
- [11].Wan F., Hong L., Xiao A., Jiang T., and Zeng J., “NeoDTI: Neural integration of neighbor information from a heterogeneous network for discovering new drug–target interactions,” Bioinformatics , vol. 35, no. 1, pp. 104–111, 2019. [DOI] [PubMed] [Google Scholar]
- [12].Min S., Lee B., and Yoon S., “Deep learning in bioinformatics,” Brief. Bioinf., vol. 18, no. 5, pp. 851–869, 2017. [DOI] [PubMed] [Google Scholar]
- [13].Zhang L., Tan J., Han D., and Zhu H., “From machine learning to deep learning: progress in machine intelligence for rational drug discovery,” Drug Discov. Today , vol. 22, no. 11, pp. 1680–1685, Nov, 2017. [DOI] [PubMed] [Google Scholar]
- [14].You J., McLeod R. D., and Hu P., “Predicting drug-target interaction network using deep learning model,” Comput. Biol. Chem., vol. 80, pp. 90–101, 2019. [DOI] [PubMed] [Google Scholar]
- [15].Wen M., et al. , “Deep-learning-based drug–target interaction prediction,” J. Proteome Res., vol. 16, no. 4, pp. 1401–1409, 2017. [DOI] [PubMed] [Google Scholar]
- [16].Wang Y., and Zeng J., “Predicting drug-target interactions using restricted Boltzmann machines,” Bioinformatics , vol. 29, no. 13, pp. i126–i134, 2013. [DOI] [PMC free article] [PubMed] [Google Scholar]
- [17].Altae-Tran H., Ramsundar B., Pappu A.S., and Pande V., “Low data drug discovery with one-shot learning,” ACS Central Sci., vol. 3, no. 4, pp. 283–293, 2017. [DOI] [PMC free article] [PubMed] [Google Scholar]
- [18].Wu Z., Pan S., Chen F., Long G., Zhang C., and Philip S. Y., “A comprehensive survey on graph neural networks,” IEEE Trans. Neural Netw. Learn. Syst., vol. 32, no. 1, pp. 4–24, Jan. 2020. [DOI] [PubMed] [Google Scholar]
- [19].Schlichtkrull M., Kipf T. N., Bloem P., Van Den Berg R., Titov I., and Welling M., “Modeling relational data with graph convolutional networks.” in Proc. Eur. Semantic Web Conf., 2018, pp. 593–607. [Google Scholar]
- [20].Zitnik M., Agrawal M., and Leskovec J., “Modeling polypharmacy side effects with graph convolutional networks,” Bioinformatics , vol. 34, no. 13, pp. i457–i466, 2018. [DOI] [PMC free article] [PubMed] [Google Scholar]
- [21].Luo Y., et al. , “A network integration approach for drug-target interaction prediction and computational drug repositioning from heterogeneous information,” Nature Commun., vol. 8, no. 1, pp. 1–13, 2017. [DOI] [PMC free article] [PubMed] [Google Scholar]
- [22].Perozzi B., Al-Rfou R., and Skiena S., “Deepwalk: Online learning of social representations.” in Proc. 20th ACM SIGKDD Int. Conf. Knowl. Discov. Data Mining, 2014, pp. 701–710. [Google Scholar]
- [23].Luo H., et al. , “Computational drug repositioning with random walk on a heterogeneous network,” IEEE-ACM Trans. Comput. Biol. Bioinf., vol. 16, no. 6, pp. 1890–1900, Nov.\Dec. 2019. [DOI] [PubMed] [Google Scholar]
- [24].Yan Z., Lecuyer E., and Blanchette M., “Prediction of mRNA subcellular localization using deep recurrent neural networks,” Bioinformatics , vol. 35, no. 14, pp. I333–I342, Jul. 2019. [DOI] [PMC free article] [PubMed] [Google Scholar]
- [25].Knox C., et al. , “DrugBank 3.0: A comprehensive resource for ‘omics’ research on drugs,” Nucleic Acids Res., vol. 39, no. suppl_1, pp. D1035–D1041, 2010. [DOI] [PMC free article] [PubMed] [Google Scholar]
- [26].Prasad T. K, et al. , “Human protein reference database—2009 update,” Nucleic Acids Res., vol. 37, no. suppl_1, pp. D767–D772, 2009. [DOI] [PMC free article] [PubMed] [Google Scholar]
- [27].Davis A. P., et al. , “The comparative toxicogenomics database: update 2013,” Nucleic Acids Res., vol. 41, no. D1, pp. D1104–D1114, 2013. [DOI] [PMC free article] [PubMed] [Google Scholar]
- [28].Kuhn M., Campillos M., Letunic I., Jensen L. J., and Bork P., “A side effect resource to capture phenotypic effects of drugs,” Mol. Syst. Biol., vol. 6, no. 1, 2010, Art. no. 343. [DOI] [PMC free article] [PubMed] [Google Scholar]
- [29].Xia Z., Wu L., Zhou X., and Wong S.T.C., “Semi-supervised drug-protein interaction prediction from heterogeneous biological spaces,” BMC Syst. Biol., vol. 4, no. 2, pp. 1–16, 2010. [DOI] [PMC free article] [PubMed] [Google Scholar]
- [30].Davis A. P., Grondin C. J., Johnson R. J., Sciaky D., Wiegers J., Wiegers T. C., and Mattingly C. J., “The comparative toxicogenomics database: Update 2021,” Nucleic Acids Res., vol. 49, no. D1, pp. D1138–D1143, 2020. [DOI] [PMC free article] [PubMed] [Google Scholar]