

Abstract
High-throughput single-cell RNA-seq data have provided unprecedented opportunities for deciphering the regulatory interactions among genes. However, such interactions are complex and often nonlinear or nonmonotonic, which makes their inference using linear models challenging. We present SIGNET, a deep learning-based framework for capturing complex regulatory relationships between genes under the assumption that the expression levels of transcription factors participating in gene regulation are strong predictors of the expression of their target genes. Evaluations based on a variety of real and simulated scRNA-seq datasets showed that SIGNET is more sensitive to ChIP-seq validated regulatory interactions in different types of cells, particularly rare cells. Therefore, this process is more effective for various downstream analyses, such as cell clustering and gene regulatory network inference. We demonstrated that SIGNET is a useful tool for identifying important regulatory modules driving various biological processes.
Keywords: deep learning, gene regulatory networks inference, cell clustering
Introduction
The regulation of gene expression is crucial to the function of cellular systems [1]. Most biological processes, such as the determination of cell fate [2, 3] and the development and progression of a disease [4–7], are governed by complex gene regulatory networks (GRNs). Single-cell transcriptome profiling yields independent measurements of thousands of cells and thus gives us unprecedented opportunities to accurately infer GRNs and hence identify critical gene regulatory modules among different cell types, which can help us understand the mechanisms underlying various biological processes [8, 9]. Furthermore, these high-throughput data provide a more detailed characterization of samples, which makes it possible to obtain high-resolution transcriptional states and to dissect transitions among different cell states.
The main difficulty in identifying regulatory interactions among genes using single-cell transcriptomics lies in the following three aspects: (a) genes display complex regulatory relationships, such as direct versus indirect and linear versus nonlinear regulations; (b) it is challenging to identify the transcriptional states of rare but crucial cell types, such as progenitor cells in tissue repair, cancer stem cells in cancer progression, and regulatory T cells in the tumor microenvironment; and (c) regulatory relationship predictions using canonical mathematical models have a relatively high rate of false positives and are difficult to verify experimentally.
Several computational methods have been widely used to infer GRNs using single-cell RNA sequencing (scRNA-seq) data. Such methods can be summarized into six main categories of models: linear regression [10–12], differential equations [13, 14], information measures [15], Bayesian networks [16], Boolean networks [17] and causal inference [18].
The combination of regulatory sequence analysis with scRNA-seq data analysis can improve the identification and characterization of cell states. SCENIC [9] combines a random forest model used to predict transcription factor (TF)-gene pairs with regulatory sequence analysis to simultaneously cluster cells and infer regulatory networks. The published studies have demonstrated promising results, but these methods cannot easily capture the transcriptional regulatory modes of rare cells because these cells are more likely to be treated as abnormal background noise compared with other cell types with large populations.
Deep learning has been widely used in scRNA-seq data analysis, including dropout imputations [19] and cell clustering [20], but has rarely been applied to infer transcriptional regulatory networks. We propose the MLP framework SIGNET for the identification of regulatory interactions between TFs and their target genes. In this framework, a gene can be a target of a TF if the expression of the TF is a strong predictor of the expression of the target. SIGNET consists of three independent and intrinsically connected components (Figure 1A): recognition of TF-target gene pairs, identification of regulatory interactions through direct binding and characterization of TF activity via AUCell scoring, which is also used in SCENIC. For the recognition of TF-target gene pairs, we constructed a regression model using MLP and predicted a series of potential downstream target genes for each TF using a case-deletion method (see sections Materials and methods and Results for a detailed description). In the next step, motif enrichment analysis was applied to identify putative direct-binding regulatory modules, hereafter referred to as regulons. In the last step, SIGNET scores the activity of regulons in each cell using the AUCell algorithm for cell clustering.
Figure 1.

Overview of SIGNET for single-cell RNA-seq GRN construction. (A) High-level architecture of SIGNET. The expression profile of each cell is converted to a binary matrix through the Hodges-Lehmann estimator and then fed into the multiple-layer perceptron model. Potential regulatory interactions between TFs and target genes are selected by the generalized extreme Studentized Deviate test. RcisTarget then identifies regulons for which the TF binding motif is significantly enriched across the promoters of target genes and creates regulons containing only direct target genes with the TF motif in their promoters. Next, AUCell scores the activity of each regulon in each cell. (B, C) Schematic view of the downstream analysis and visualization of the results. The transcriptional regulatory network can be constructed using selected regulons.
To evaluate the performance of SIGNET, the algorithm was applied to three scRNA-seq datasets, and SIGNET yielded more accurate and compact cell clustering than other widely used software programs. We also cross-validated our computational results with publicly available ChIP-seq datasets and showed that SIGNET exhibits increased sensitivity in identifying cell type-specific regulons than SCENIC. Besides. regulons in immune cells identified by SIGNET using TCGA data are significantly associated with the survival of patients. Moreover, our results demonstrated that SIGNET is capable of recognizing characteristic regulons in rare cells and thus improves the opportunity to identify essential rare cell types in a cell population, which is one of the main goals of using single-cell technologies.
Materials and methods
SIGNET workflow
The SIGNET method mainly consists of three different parts (Figure 1A): (i) Multiple fully connected MLP aiming to extract information about the relationship between TFs and non-TFs or downstream targets, each MLP model corresponds to the prediction of a selected feature gene; (ii) the RcisTarget package for identifying whether the TFs can truly combine with the motif of the target genes or the so-called regulons based on motif enrichment scores and (iii) AUCell for evaluating the relative activity of the regulons in each sample of the scRNA-seq data and for drawing conclusions based on the AUC score matrix.
First, we trained a fully connected multiple-layer perceptron (MLP) [21] using the expression of all of the TFs to predict the expression of one gene at a time. We assumed that the expression of every gene in a cell can be modeled as a function of the expression levels of the TFs and if a TF exerts a strong regulatory effect on a gene, its removal from the input features would have an obvious impact on the accuracy of predicting the expression level of this gene. Then, we tested the existence of a significant regulatory effect between a TF and a gene using a case-deletion method; during this step, the expression value of each TF was set to 0 one at a time, and the new binary matrix is used as the input to predict the expression of the gene of interest using the pretrained model.
After traversing the entire transcription factor list using the above method, we obtained an accuracy curve for predicting a single target feature gene. By repeating the above process for all feature genes, multiple MLPs along with the accuracy curves as many as the number of feature genes were generated. Next, we introduced the generalized extreme Studentized deviate test (gESD test) [22] for outliers screening (α = 0.05) to identify TFs that have a strong influence on the prediction of gene expression. By traversing the feature gene list, SIGNET generates a series of candidate regulatory modules that consist of a TF and its potential downstream target genes.
Secondly, we applied RcisTarget [23] to verify and filter out the TF-target gene regulons. Using the motif dataset, motif annotation and gene set as the inputs, RcisTarget calculates the enrichment score of a TF motif in the promoter regions of the target gene set and thus evaluates the regulatory potential of a TF on the target genes. Only modules with a rather high enrichment score were retained for further analysis and we called these modules regulons.
Finally, AUCell [24]was used to quantify the activity of regulons in each cell sample. It uses gene sets of interest as input and converts the expression matrix of genes in the cells to the AUC matrix of the regulatory activities of each TF in each cell. The AUC matrix was used to classify the cells and perform further analyses (Figure 1B). Furthermore, the regulon list is a useful resource for the reconstruction and exploration of GRNs (Figure 1C).
Data preprocessing
Prior to MLP training, the raw scRNA-seq data need to be preprocessed, i.e., through gene filtering and binarization. First, to focus on the difference among cell populations, we only used highly variable feature genes for inferring GRNs using the mean expression and divergence of genes to filter 5000–7000 genes. We filtered those genes with significantly differential expression for information extraction using the Scanpy [25] or Seurat packages with a common protocol to focus on the most important information and to reduce the influence of random noise. In general, we filtered 5000–7000 feature genes for the subsequent training. Second, we used the Hodges-Lehmann estimator (HLE) for binarization. Assuming K cells and L filtered genes, which consist of M TF genes and N NTF genes, i.e.,  , the count matrix can be written as follows:
 |
 |
(1) |
The Hodges-Lehmann estimator for the median of the known data is calculated as follows:
 |
(2) |
For any column  of the count matrix C, the threshold is set to the HLE, i.e.,
 |
(3) |
We can then turn the count matrix C into the binary matrix B by setting all elements of the column with values larger and lower than the threshold to 1 and 0, respectively:
 |
(4) |
Prediction of the relationship between genes
After obtaining the binary matrix, this matrix can be used for MLP training and feature extraction. We used the binarized expression of all TF genes as the input to predict the expression of NTFs one at a time using the MLP model. For all experiments, the three-layered fully connected MLP with the ReLU activation function [26] was used. Assume the number of nodes in each layer is  and we have the following formula:
 |
(5) |
where NF is the number of filtered differentially expressed transcription factors. The number of nodes in the first layer equals to NF. The amount of nodes in the second layer is set as the smallest power of 2, which is not less than 0.4 times of  And the third layer uses a quarter node of
  . Since the predicted result can be either 0 or 1, we selected the cross-entropy function as the loss function for measuring the accuracy of model training. In addition, L1 regularization was also used for sparse parameter estimation. Thus, the loss function has the following shape:
 |
(6) |
where  is the true label,
  is the predicted label, λ is the weight of L1 regularization,
  is the weight of each link between nodes and T is the size of training samples.
For the actual training process, the stochastic optimization algorithm with momentum [27] was chosen for optimal solution searching with a learning rate of 0.01. However, during the training process, we found that the columns of the binary matrix may possess an unbalanced distribution of positive and negative cases, namely, 1 and 0, which could lead to rather poor model performance. To correct the bias and not harm the structure of the primary data, we used bootstrapping to generate new columns with a ratio not less than 1:5 for the positive and negative cases. We separated the dataset into training and testing sets based on a ratio of 7:3 for overfitting control.
When predicting the expression of TF genes, we changed the expression value of a specific gene to 0 and used the expression value of all other TF genes as input, and the other processes remained unchanged.
Screening of potential coexpression gene pairs
Once we obtained the prediction model between all genes and one specific target gene, we questioned which TFs in the gene pool have a strong influence on the target gene. Thus, we introduced the case-deletion method, which conveys the primary data to the case-deleted data, i.e., the expression of a TF was set to 0 one at a time, and such data were used as the input to predict the expression state of the specific target gene. Mathematically, we can assume that  is a prediction function from all gene spaces to the nth targeted gene space; in this equation,
  . In addition,
  , and the mth case-deleted matrix can be calculated as follows:
 |
(7) |
Subsequently, fn(Bm) is the prediction of the nth target gene after erasing the effect of the mth TF gene. We then define the accuracy of the prediction by running over the whole dataset as follows:
 |
(8) |
where  is the
  column of matrix B, i.e., the true label of the
  target gene and ||⋅||0 calculates the number of non-zero entries of the vector. In addition, the accuracy matrix is
  . We argue that for a specific target gene, if the predicted accuracy exhibits an obvious oscillation once we set a TF to 0, then it would be highly likely that this TF has some strong influence on the target gene. To screen for such TFs with statistical significance, we refer to the outlier analysis and use the generalized extreme Studentized deviate test (gESD test). Given the upper bound r, gESD performs r separate Grubbs tests and can detect no more than r outliers. The following hypothesis test can be considered:
 |
 |
For the  calculation, the R statistic is calculated as follows:
 |
(9) |
where  and s are the mean and standard deviation of the sample with deletion of the
  outliers. We then have the r test statistics
  . Corresponding to the r test statistics, the critical values are calculated as
 |
(10) |
where tp(v) is the 100p percentage point of the t distribution with v degrees of freedom and  . The number of outliers is the largest i such that
  . In practice, r could change from 30 to 80, which implies how many feature transcription factors could regulate the target gene, and α is usually set to 0.05 for identifying the potential related TF-NTF copairs, which are ready for RcisTarget trans-screening and ultimately AUCell scoring.
Cluster validation
There are mainly two categories of clustering validation, i.e., internal clustering validation and external clustering validation. The main difference between the two categories is that the external indexes use the true label for comparison and the internal indexes focus on the dataset itself. Among the hundreds of clustering validation methods, we selected some widely used indexes that consider both internal and external validation for reference. For internal clustering validation, compactness and separateness are two essential qualities of clustering goodness, and we prefer to obtain clustering results with less compactness within clusters and larger separateness between different clusters. Thus, we used the root-mean-square standard deviation (RMSSTD) to measure compactness and the modified Hubert Γ statistic to measure separateness [28]. In external clustering validation, to match the ground truth, three categories of indexes, namely, pair-counting, information theoretic and set-matching measures, are often used. In practice, we used the adjusted rand index (ARI), normalized mutual information (NMI), F score, normalized Van Dongen (NVD) and pair sets index (PSI) [29].
Survival analysis of clinical data
We used the GEPIA2 (http://gepia2.cancer-pku.cn/#survival) online analysis tool for the survival analysis. By uploading the gene list regulated by the regulon or the single regulon gene, Kaplan–Meier curves were plotted, and the log-rank test was used to compare the survival curves of the high and low regulon expression groups. Moreover, we used CD163, which is considered an important macrophage marker, as the denominator for the normalization of all the other genes to remove the influence of the number of macrophages.
Results
Accurate single cell classification using SIGNET
To evaluate the performance of SIGNET on a clustering analysis, we collected three scRNA-seq datasets from GEO (https://www.ncbi.nlm.nih.gov/geo/), including data from the cerebral cortex of mouse (GSE60361, 3005 single cells from 33 males and 34 females [30]), human skin cutaneous melanoma (SKCM, GSE115978, 7186 single cells from 31 melanoma tumors [31]) and head and neck squamous cell carcinoma (HNSCC, GSE103322, 5902 single cells from 18 patients with oral cavity tumors [32]). In addition to SCENIC, we utilized the widely used Seurat package [33] for cell clustering comparison.
We used the AUC matrix (SCENIC or SIGNET) and the first n PCA components of the data matrix (Seurat) as the input for UMAP dimension reduction and 2D visualization. The best n PCA components used in Seurat were selected based on the Elbow plot (Figure S1). Because neither SCENIC nor SIGNET provided a method for cell clustering, hierarchical clustering with average linkage was used, and the integrated pipeline was used for Seurat (see section Materials and methods). For Seurat, we extracted various numbers of highly variable genes for downstream clustering, including 2000, 5000, 7000 and 9000, hereafter referred to as Seurat 2 k, 5 k, 7 k and 9 k (Figure 2A, C, E and Figure S1).
Figure 2.

SIGNET yields more accurate and compact cell classification results with three scRNA-seq datasets. (A) UMAP plots of the mouse brain scRNA-seq data obtained with SIGNET, SCENIC, and Seurat 2 k. (B) Five external clustering validations (F score, CSI, PSI, ARI and NMI) were used to indicate the performance and robustness of the three methods with the mouse brain dataset. (C, E) UMAP plots of the results obtained with SIGNET, SCENIC, and Seurat 2 k using the SKCM and HNSCC scRNA-seq data. (D, F) Two internal clustering validations (RMSSTD and MHG) were used to measure the performance of the methods with respect to tumor cell classification in SKCM and HNSCC datasets. RMSSTD estimates the compactness of the classification results, whereas MHG estimates the separateness of the classification results. Smaller values of these two indexes indicate better information contraction and less heterogeneity within the classification results. Note: ‘?’ & ‘-Fibroblast’ are labels appeared in the data files provided by the original studies.
For the brain dataset, the UMAP results obtained with SCENIC and SIGNET were more compact than those obtained with Seurat 5 k and Seurat 7 k. Although Seurat 2 k shares similar compactness with the former two methods, pyramidal CA1 cells were spread out in many different clusters, similar to the results obtained with SCENIC (Figure 2A). To measure the performance of the clustering results, we used five different metrics, namely, the F score, CSI, PSI, ARI and NMI (see section Materials and methods for a detailed description of the metrics). All five metrics consistently demonstrated that SIGNET achieved the best performance in cell clustering (Figure 2B).
For cancer types that are less characterized or have strong heterogeneity, an important task in dissecting scRNA-seq data of such tumor tissues is the identification of tumor cells in the cell population. Therefore, we want to obtain a more compact classification of tumor cells such that the heterogeneous tumor cell populations can be grouped closer to each other and can be easily identified. Thus, for the SKCM and HNSCC datasets, we separated the tumor cells from other cells and compared the classification results for tumor cells (Figure S2). We assessed the results using two internal clustering validation indexes, such as RMSSTD and MHG, which are two indexes representing the compactness and separateness of the classification. Lower compactness and separateness indexes indicate better information contraction and less heterogeneity within the same cell types. These two indexes indeed showed that SIGNET exhibited better performance than the other methods with both the SKCM and HNSCC datasets (Figure 2D and F).
SIGNET identifies cell-specific transcription factors and constructs a regulatory network with functional significance
The main goal of SIGNET is to identify cell type-specific regulons with high sensitivity and specificity, which improves downstream analyses for discovering new biological mechanisms. We used the head and neck squamous cell carcinoma (HNSCC) dataset to illustrate the performance of SIGNET in recognizing crucial cell-specific regulons and in cell clustering (Figures 2A, C, E and3A).
Figure 3.
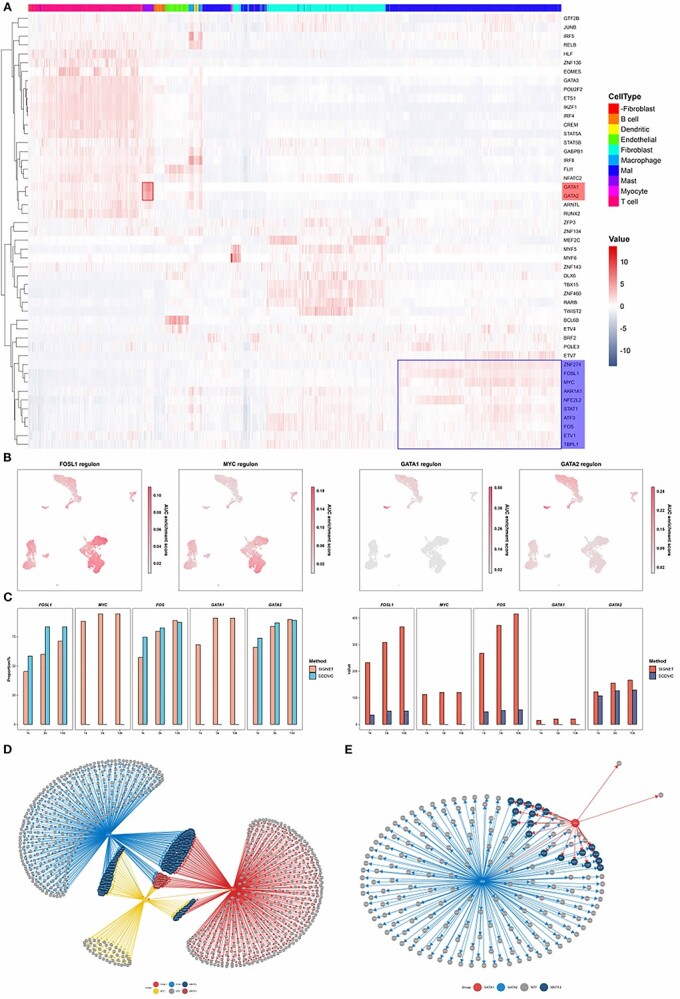
SIGNET shows higher sensitivity in identifying functionally relevant regulons. (A) Heatmaps of the results obtained with the head and neck squamous cell carcinoma (HNSC) dataset and of the activities of each regulon in each cell generated by SIGNET. The red color represents active regulons with high AUC scores. The red box highlights that GATA1 and GATA2 are more active in mast cells than other types of cells, whereas the blue box indicates the important regulators in tumor cells, including FOSL1, MYC and FOS. (B) In each of the UMAP plots, the cells are colored according to the regulon activity measured by the AUCell score of the indicated TF. (C) Cross-validation with publicly available ChIP-seq datasets. The right panel shows the absolute number of predicted target genes that can be validated using ChIP-seq data. The left panel shows the proportion of the predicted target genes that were validated using ChIP-seq data. (D, E) Transcription regulatory network constructed using the regulons predicted by SIGNET.
SIGNET revealed that two regulons, GATA1 and GATA2, have high AUCell scores exclusively in mast cells, consistent with previous findings that GATA1 and GATA2 are important regulators in mast cells (Figure 3A). The TFs GATA1 and GATA2 are fundamental regulators of hematopoiesis. GATA1 represses the expression of GATA2, and switching the GATA factors from GATA2 to GATA1 is a core mechanism underlying cell fate transitions [34]. Our results revealed that the regulatory networks of the GATA1 and GATA2 regulons exhibited a high degree of overlap (Figure 3E) and that GATA2 was regulated by GATA1, which indicates that both GATA1 and GATA2 participate in similar biological processes, consistent with the reported functions of the two TFs [35]. Furthermore, three known oncogenes, AP-1 (FOS and FOSL1) and c-MYC [36, 37], were found to be significantly more active in tumor cells than in other cells (Figures 3A andS3).
To validate the predicted regulons, we cross-verified our computational results with publicly available ChIP-seq datasets [38]. For each regulon, we calculated the number of overlaps between the target genes of the TF predicted with SIGNET or SCENIC and the target genes identified using ChIP-seq data (Figure 3C). The results showed that SIGNET exhibits increased sensitivity in identifying ChIP-seq-verified target genes of a TF compared with SCENIC. In addition to the significantly higher sensitivity of SIGNET, its specificity (a proportion of the predicted target genes that were verified by ChIP-seq data) was slightly lower or comparable to that of SCENIC (Figure 3C). We found that the proportion of some TFs was low, which may be due to the fact that the ChIP-seq data of these TFs was markedly lower or that the binding site of TFs regulating gene expression was not within 10-kb upstream or downstream of the transcription start site (TSS) of the gene.
Our method also includes utilities to construct and visualize transcription regulatory networks. By constructing a network using predicted genes regulated by FOSL1, FOS and c-MYC (Figure 3D), we found three regulatory patterns: genes regulated by one, two and three regulons. Many of the 24 genes regulated by three regulators reportedly play important roles in multiple tumor-related biological processes. For example, claudin-4 (CLDN4) is expressed at a high level in tumor cells of several cancer types and is also a potential treatment target in HNSCC [39]. ARL14, IER3, LAMB3, OVOL1, PRDX1 and PTHLH also have higher expression levels in tumor cells and reportedly participate in tumor invasion, epithelial-mesenchymal transition, and tumor proliferation and metastasis [40–53].
SIGNET reveals that regulon activities in macrophages are associated with patient survival
Based on a single-cell RNA-seq dataset from human skin cutaneous melanoma (SKCM), many of the regulons specifically activated in macrophages reportedly have important functions in macrophages (Figure 4A). For example, IRF4 is known to control the M2 polarization of macrophages and thus contributes to the IL-4-dependent induction of a set of M2-specific marker genes [54]. Tumor-associated macrophages (TAMs) infiltrate tumor tissues and are major regulators of the tumor immune microenvironment [55]. We speculate that these active regulons in macrophages may have a significant impact on the tumor microenvironment and may thus affect the survival of cancer patients.
Figure 4.

SIGNET identifies macrophage-specific regulons associated with patient survival. (A) Heatmap obtained with the human skin cutaneous melanoma (SKCM) dataset. The mean activity of each regulon for each cell type was generated from the SIGNET AUC distribution and plotted as a heat map, and red blocks represent cells that are ‘active’. (B) Survival analysis based on the transcription factors and their target genes in each regulon using the SKCM cohort in TCGA. (C) Cross-validation with publicly available ChIP-seq data (ref). The top bar graph shows the absolute predicted gene number calculated by SIGNET/SCENIC, and the bottom bar graph shows the ratio of the number of genes predicted by SIGNET/SCENIC methods and recorded in public ChIP-seq to the number of predicted genes. (D) Transcription regulatory network constructed based on the results predicted by SIGNET using regulons with high activity in macrophages.
To test this hypothesis, we split the clinical samples in the TCGA melanoma cohort according to the expression levels of genes in a regulon and performed a survival analysis of the two groups of patients with distinct regulon activity [56] (see section Materials and methods). We used the expression level of CD163, a well-known marker for macrophages [57, 58], as an internal control for the variations in the proportions of macrophages in different samples. The survival analyses showed that the expression levels of both the TF and its target genes were significantly associated with patient survival (Figure 4B). Meanwhile, we also used several macrophage markers provided in other article [59] as an internal control for the macrophage, the result is consistent with the above (Figure S5). Cross-validation of the regulons identified by SCENIC and SIGNET using publicly available ChIP-seq data was performed as in Part III (Figure 4C). SIGNET showed higher sensitivity for identifying the target genes of TFs in each regulon than SCENIC, which indicates that SIGNET can capture more regulatory information from the same dataset than SCENIC.
Moreover, the transcription regulatory network constructed using the identified regulons exhibited several interesting features. MYB and GOLGA7B are both regulated by the largest number of TFs (three regulators shown in Figure 4D), and both of these genes exerted a significant prognostic effect in the SKCM cohort from TCGA (Figures 4d andS4). MYB is expressed in immature hematopoietic cells at key stages during hematopoiesis and plays a dual role by simultaneously stimulating the proliferation and differentiation of monocytes [60]. Furthermore, SIGNET identified 31 genes regulated by two TFs (shown in Figure 4D). Among these genes, colony-stimulating factor 1 receptor (CSF1R) is known as an M2 macrophage marker and controls the proliferation, differentiation and survival of macrophages [61]. cAMP-responsive element modulator (CREM) is expressed at higher levels in M2 macrophages than in M1 macrophages [62]. Mitochondrial glycerol 3-phosphate dehydrogenase (GPD2) regulates glucose oxidation to drive inflammatory responses in macrophages [63], and tumor necrosis factor receptor-associated factor 1 (TRAF1) is involved in the regulation of macrophage polarization, as demonstrated by a TMT-labeled quantitative proteomics analysis [64]. In conclusion, our method shows increased sensitivity in identifying regulons that are functionally important based on single-cell RNA-seq data, and genes that appear in multiple regulons can be prioritized for subsequent mechanistic study.
SIGNET is sensitive to clusters with small cell counts
The study of rare cells is crucial for improving the understanding of various biological processes as well as for the advancement of medical diagnostics and therapeutics [65], for example, circulating tumor cells in early tumor detection [66, 67], circulating endothelial cells and their precursors in immune disease diagnosis [68] and invariant natural killer T cells recognizing self and foreign lipids [69, 70]. Therefore, we sought to examine whether our method can identify rare cell clusters and capture the characteristic regulons of such cells. We showed that SIGNET accurately clustered 19 myocytes among the 5902 cells in the HNSCC dataset as a separate group and identified three active regulons in myocytes, namely, MYF6, MYF5 and MYOG (Figure S3). MYF5 and MYF6 belong to the MYOD family of myogenic TFs [71], which are essential in myogenic lineage determination and muscle differentiation [72, 73]. MYOG is another crucial myogenic regulatory factor that regulates the level and duration of skeletal muscle development [74, 75]. In contrast, SCENIC clustered myocytes and fibroblasts together as one group and identified one regulon in this group (MYF5, Figure 5B).
Figure 5.

SIGNET identifies characteristic regulons for rare cell types. (A) SIGNET UMAP plot obtained with the HNSC dataset. The cells are colored according to the regulon activity of MYOG and MYF6. (B) In both the SIGNET and SCENIC UMAP plots obtained with the HNSC dataset, myocytes are marked in black, and the other cells are shown in gray. (C) In the SIGNET and SCENIC UMAP plots obtained using the mouse brain dataset with only 20 microglia, the cells are colored according to their true labels. (D) In each SIGNET UMAP plot obtained using the mouse brain dataset with only 20 microglia, the cells are colored according to the regulon activity of Irf1, Irf5, Irf8, and Maff, which are well-known transcription factors in macrophages. (E) The left panel shows the SCENIC UMAP plot of the mouse brain dataset. The highly variable genes used by SIGNET served as the input features, and the cells are colored according to their true labels. The right panel shows the number of regulons identified by the indicated methods and inputs. (F) The left panel shows a SCENIC UMAP plot obtained with the mouse brain dataset after the number of microglia was downsampled to 20. The highly variable genes used by SIGNET served as the input features for SCENIC, and the cells are colored according to their true labels. The right panel shows the number of regulons identified using the indicated methods and inputs. (G) Five external clustering validations (F score, CSI, PSI, ARI and NMI) were used to indicate the performance and robustness of the SIGNET and SCENIC with the mouse brain data and downsampled data. The ‘full’ means using all genes as input while ‘var’ means only using variable feature genes as input. When only using variable feature genes as input, the performances of SCENIC under two different parameters (‘top5perTarget’ or ‘top10perTarget’) are relatively close, so we show both the result, while we only show the better one result from SCENIC using all gene as input here.
To further verify the robustness of our method in identifying regulons in rare cells, we downsampled the number of microglial cells to 20 in mouse brain single-cell data without changing the other cells. Although the downsampling of the input deteriorated the performances of both SIGNET and SCENIC, the cell clustering results obtained with our method were relatively superior to those obtained with SCENIC (Figure 5C). SIGNET also captured several microglia-specific TF regulons, such as Irf1, Irf5, Irf8 and Maff (Figures 5D andS6). Irf1, Irf5 and Irf8 are central transcriptional regulators of type I interferon production and are important for both innate and adaptive immune responses [76]. These TFs are also reportedly involved in the development, maturation and polarization of macrophages [77]. We note that different parameter choices are available in SCENIC. Here, we chose the parameters with the best performance, and the results obtained using suboptimal parameters are included in the supplementary figure (Figure S6).
To focus on the differentially activated TFs, SIGNET used highly variable feature genes and TFs to infer GRNs, whereas SCENIC used all genes as input. The total number of regulons identified by SIGNET was lower than that identified by SCENIC due to the decreased number of TFs being tested; however, as shown in the previous sections, SIGNET detected more ChIP-seq validated TF-target gene pairs for each regulon (Figures 3C and4C). Moreover, when using the highly variable feature genes utilized in SIGNET as input for SCENIC, the total numbers of regulons detected by SCENIC in all cell types included in the mouse brain data decreased from 286 to 39 (Figure 5E). Additionally, the use of only the feature genes as input significantly deteriorated the classification results obtained with SCENIC (Figure 5E). Furthermore, the number of regulons identified by SCENIC using all the genes and downsampled data decreased to 43 from 286 regulons detected with the original data without downsampling, and the number of microglial cells decreased to 20. In addition, 37 regulons were detected using downsampled cells and highly variable genes as the input (Figure 5F). The number of regulons predicted by SIGNET slightly decreased from 85 with the original data to 83 with the downsampled data (Figure 5E). The deterioration of the performance of SCENIC may have been obtained because the few microglial cells in the downsampled cluster that were regarded as noise affected the computation of the entire dataset. These results demonstrate that our method is more robust to background noise because the gene regulatory information captured from downsampled data was roughly equivalent to that obtained with the original data, and better classification was also obtained.
The resampling process during the first step in our method (Figure 1A) makes the number of negative cases less than five times that of positive cases, which ensures not only that our method is not only more sensitive to these cell clusters with small numbers and thus that our method can capture the characteristics of clusters with small numbers but also that these small data clusters will not have a greater impact on the data computation of other clusters.
Discussion
Inspired by the great success achieved with deep learning in cell clustering and dropout imputation of scRNA-seq data, we applied deep learning to the inference of GRNs using scRNA-seq. Single-cell RNA-seq-based Gene Regulatory Network Prediction using a Multiple-Layer Perceptron Bagging (SIGNET) converts the expression matrix of single-cell RNA-seq data to a binary matrix of gene activity and feeds it to the MLP, and the trained MLP identifies the regulatory effect of a TF on its target gene by deleting the TF from the input features when predicting the expression of a gene. If removal of a TF leads to an obvious fluctuation in the prediction accuracy of the expression of a gene, the gene is identified as a regulatory target of the TF. A TF with all its identified target genes was called a regulon. The identified regulons were subsequently filtered by motif enrichment analysis. We assessed the performance of SIGNET in the clustering of cells using three publicly available scRNA-seq datasets and verified the biological significance of the regulon identification results through survival analysis of TCGA datasets and cross-validations with ChIP-seq data. We provide compelling evidence showing that SIGNET exhibits increased sensitivity in identifying functional regulons and in clustering rare cell types. In addition, SIGNET also provides utilities for the construction and visualization of GRNs to facilitate downstream analysis.
We mainly attribute the information extracting ability and high sensitivity of SIGNET to three aspects: the use of the MLP model, application of the bootstrap process before model training and the pruning step using RcisTarget.
First, the MLP can capture complex regulatory relationships and is therefore capable of detecting more TF-target interactions. For each regulon, SIGNET identified more ChIP-seq-validated target genes, which suggests that our method exhibits increased sensitivity in identifying regulatory interactions between a TF and its target genes than SCENIC.
Second, the bootstrap step adjusts the ratio between positive and negative cases, that is, adjusts the ratio of samples with expression values of 1 to those with values of 0, prior to training the MLP model to ensure that our method is sensitive to the sparse and underrepresented cell populations in scRNA-seq data. A large number of primary samples contain far more negative cases than positive cases, which can introduce severe biases on model prediction, particularly if the predicted gene is expressed in a low number of cells. Thus, by giving the positive samples a larger weight, we reduced the sampling bias and captured the characteristic regulons of rare cells.
Finally, by adjusting the threshold of motif enrichment score, we can further filter the background noise in the potential regulons. For small dataset, we tend to increase the threshold to ensure that the predicted relationships between transcription factors and downstream genes are reliable. However, for large or heterogeneous dataset, the threshold should be reduced, since transcription factors usually are cell-specific and regulate by various motifs in different cell populations.
To test the performance of SIGNET on large dataset, we ran SIGNET on single cell data of 20 organs and tissues from mice (GSE109774, 53 760 cells from four male and three female mice [78]) and we obtained 84 regulons. Though there are more than 80 cell types in this dataset, the UMAP result based on the AUC matrix of the selected regulons still shows clear clusters (Figure S7A). Considering this dataset contains cells from multiple mice and is quite heterogeneous, this result demonstrates that the ability of SIGNET to extract regulatory information from noisy background and the algorithm is robust.
Higher sensitivity almost always leads to reduced specificity. Setting appropriate parameters for filtering the regulons can make the downstream analyses more accurate. There is still room for improving SIGNET. Using time series data, several methods, such as RNA velocity [79], can predict the expression of a target gene at the next moment based on the expression of a TF at the previous moment. In addition, other methods integrate scRNA-seq data with ChIP-seq or ATAC-seq data for GRN inference recently. DeepSEM [80] combines deep learning with SEM algorithm and construct the GRN using both scRNA-seq and ChIP-seq data. LISA [81] mainly focus on using ChIP-seq data to filter important regulons for various cell populations. MAESTRO [82] processes RNA-seq and ATAC-seq data and shows promising performance. Future work to integrate multi-omics information to our model would improve the performance of the model and provide further insights into biological processes of interest.
Key Points
SIGNET is among the first methods to infer gene regulatory networks from single-cell transcriptomic data using a deep learning-based framework.
SIGNET achieved more compact and accurate cell classification than widely used methods, such as SCENIC and Seurat.
SIGNET is sensitive to important regulatory modules during various biological processes, especially in rare cells, where new biology is more likely to be discovered with single-cell data.
Supplementary Material
Acknowledgements
We thank the useful comments on statistics very much from Zaiying Zhou, Lecturer of Center for Statistical Science, Tsinghua University. This work was supported by Alibaba Group through Alibaba Innovative Research (AIR) Program.
Qinhuan Luo is a MD candidate student at the School of Medicine, Tsinghua University, Beijing, China. He has a particular interest in bioinformatics and developmental biology.
Yongzhen Yu is a MD candidate student at the School of Medicine, Tsinghua University, Beijing, China. He has a particular interest in neurobiology and bioinformatics.
Xun Lan is an assistant professor at the School of Medicine,and the Tsinghua-Peking Center for Life science, MOE Key Laboratory of Bioinformatics, Tsinghua University, Beijing, China. His expertise is in bioinformatics and tumor immunology.
Contributor Information
Qinhuan Luo, School of Medicine, Tsinghua University, Beijing, China.
Yongzhen Yu, School of Medicine, Tsinghua University, Beijing, China.
Xun Lan, School of Medicine,and the Tsinghua-Peking Center for Life science, MOE Key Laboratory of Bioinformatics, Tsinghua University, Beijing, China.
Data availability
The scRNA-seq datasets used in the current study can be found in NCBI’s Gene Expression Omnibus and are accessible through the following GEO accession number: GSE60361, GSE115978, GSE103322 and GSE109774. The full TF list used in the model training can be found on the GitHub of pySCENIC (https://github.com/aertslab/pySCENIC/tree/master/resources). The ChIP-seq datasets can be accessible through link http://chip-atlas.org/. The online survival analysis toolbox of tumor cells can be found on http://gepia2.cancer-pku.cn/#index.
Code availability
Source codes implemented can be found at https://github.com/Lan-lab/SIGNET.
Funding
This work was partially supported by the grants (No. 81972680 to X. L.) from the National Natural Science Foundation of China, a start-up fund from Tsinghua University-Peking University Joined Center for Life Sciencea start-up fund from Tsinghua University-Peking University and Alibaba innovation research programme. This work was supported by Alibaba Group through Alibaba Innovative Research (AIR)Program.
References
- 1. Cavalieri D, De Filippo C. Bioinformatic methods for integrating whole-genome expression results into cellular networks. Drug Discov Today 2005;10:727–34. [DOI] [PubMed] [Google Scholar]
- 2. Fazi F, Nervi C. MicroRNA: basic mechanisms and transcriptional regulatory networks for cell fate determination. Cardiovasc Res 2008;79:553–61. [DOI] [PubMed] [Google Scholar]
- 3. Wapinski OL, Vierbuchen T, Qu K, et al. Hierarchical mechanisms for direct reprogramming of fibroblasts to neurons. Cell 2013;155:621–35. [DOI] [PMC free article] [PubMed] [Google Scholar]
- 4. Raposo AASF, Vasconcelos FF, Drechsel D, et al. Ascl1 Coordinately regulates gene expression and the chromatin landscape during neurogenesis. Cell Rep 2015;10:1544–56. [DOI] [PMC free article] [PubMed] [Google Scholar]
- 5. Margolin AA, Nemenman I, Basso K, et al. ARACNE: an algorithm for the reconstruction of gene regulatory networks in a mammalian cellular context. BMC Bioinformatics 2006;7:S7. [DOI] [PMC free article] [PubMed] [Google Scholar]
- 6. Langfelder P, Horvath S. WGCNA: an R package for weighted correlation network analysis. BMC Bioinformatics 2008;9:559. [DOI] [PMC free article] [PubMed] [Google Scholar]
- 7. Gitter A and Bar-Joseph Z. The SDREM Method for Reconstructing Signaling and Regulatory Response Networks: Applications for Studying Disease Progression. In: Castrillo J., Oliver S. (eds) Systems Biology of Alzheimer’s Disease. Methods in Molecular Biology, vol 1303. New York, NY: Humana Press. 10.1007/978-1-4939-2627-5_30. [DOI] [PubMed] [Google Scholar]
- 8. Yang B, Xu Y, Maxwell A, et al. MICRAT: a novel algorithm for inferring gene regulatory networks using time series gene expression data. BMC Syst Biol 2018;12:115. [DOI] [PMC free article] [PubMed] [Google Scholar]
- 9. Aibar S, González-Blas CB, Moerman T, et al. SCENIC: single-cell regulatory network inference and clustering. Nat Methods 2017;14:1083–6. [DOI] [PMC free article] [PubMed] [Google Scholar]
- 10. Huynh-Thu VA, Irrthum A, Wehenkel L, et al. Inferring regulatory networks from expression data using tree-based methods. PLoS One 2010;5:e12776. [DOI] [PMC free article] [PubMed] [Google Scholar]
- 11. Papili Gao N, Ud-Dean SMM, Gandrillon O, et al. SINCERITIES: inferring gene regulatory networks from time-stamped single cell transcriptional expression profiles. Bioinforma Oxf Engl 2018;34:258–66. [DOI] [PMC free article] [PubMed] [Google Scholar]
- 12. Wei J, Hu X, Zou X, et al. Reverse-engineering of gene networks for regulating early blood development from single-cell measurements. BMC Med Genomics 2017;10:72. [DOI] [PMC free article] [PubMed] [Google Scholar]
- 13. Matsumoto H, Kiryu H, Furusawa C, et al. SCODE: an efficient regulatory network inference algorithm from single-cell RNA-Seq during differentiation. Bioinforma Oxf Engl 2017;33:2314–21. [DOI] [PMC free article] [PubMed] [Google Scholar]
- 14. Ocone A, Haghverdi L, Mueller NS, et al. Reconstructing gene regulatory dynamics from high-dimensional single-cell snapshot data. Bioinformatics 2015;31:i89–96. [DOI] [PMC free article] [PubMed] [Google Scholar]
- 15. Chan TE, Stumpf MPH, Babtie AC. Gene regulatory network inference from single-cell data using multivariate information measures. Cell Syst 2017;5:251–267.e3. [DOI] [PMC free article] [PubMed] [Google Scholar]
- 16. Sanchez-Castillo M, Blanco D, Tienda-Luna IM, et al. A Bayesian framework for the inference of gene regulatory networks from time and pseudo-time series data. Bioinforma Oxf Engl 2018;34:964–70. [DOI] [PubMed] [Google Scholar]
- 17. Hamey FK, Nestorowa S, Kinston SJ, et al. Reconstructing blood stem cell regulatory network models from single-cell molecular profiles. Proc Natl Acad Sci U S A 2017;114:5822–9. [DOI] [PMC free article] [PubMed] [Google Scholar]
- 18. Qiu X, Rahimzamani A, Wang L, et al. Inferring causal gene regulatory networks from coupled single-cell expression dynamics using scribe. Cell Syst 2020;10:265–274.e11. [DOI] [PMC free article] [PubMed] [Google Scholar]
- 19. Xu Y, Zhang Z, You L, et al. scIGANs: single-cell RNA-seq imputation using generative adversarial networks. Nucleic Acids Res 2020;48:e85–5. [DOI] [PMC free article] [PubMed] [Google Scholar]
- 20. Liu Q, Chen S, Jiang R, et al. Simultaneous deep generative modelling and clustering of single-cell genomic data. Nat Mach Intell 2021;3:536–44. [DOI] [PMC free article] [PubMed] [Google Scholar]
- 21. Orbach J. Principles of Neurodynamics. Perceptrons and the theory of brain mechanisms. Arch Gen Psychiatry 1962;7:218–9. [Google Scholar]
- 22. Rosner B. Percentage points for a generalized ESD many-outlier procedure. Dent Tech 1983;25:165–72. [Google Scholar]
- 23. Aibar Sara, Hulselmans Gert, Aerts Stein. RcisTarget: RcisTarget Identify Transcription Factor Binding Motifs Enriched on a List of Genes or Genomic Regions. Leuven, Belgium: Laboratory of Computational Biology. VIB-KU Leuven Center for Brain & Disease Research. Bioconductor Version: Release (3.13), 2021. doi: 10.18129/B9.bioc.RcisTarget. [DOI] [Google Scholar]
- 24. Aibar Sara, Aerts Stein. AUCell: AUCell: Analysis of ‘Gene Set’ Activity in Single-Cell RNA-Seq Data (e.g. Identify Cells With Specific Gene Signatures). Leuven: Laboratory of Computational Biology. VIB-KU Leuven Center for Brain & Disease Research. Bioconductor version: Release (3.13), 2021). doi: 10.18129/B9.bioc.AUCell. [DOI] [Google Scholar]
- 25. Wolf FA, Angerer P, Theis FJ. SCANPY: large-scale single-cell gene expression data analysis. Genome Biol 2018;19:15. [DOI] [PMC free article] [PubMed] [Google Scholar]
- 26. Fukushima K. Visual feature extraction by a multilayered network of Analog threshold elements. IEEE Trans Syst Sci Cybern 1969;5:322–33. [Google Scholar]
- 27. Qian N. On the momentum term in gradient descent learning algorithms. Neural Netw 1999;12:145–51. [DOI] [PubMed] [Google Scholar]
- 28. Liu, Y., Li, Z., Xiong, H., et al. Understanding of Internal Clustering Validation Measures. In: 2010 IEEE International Conference on Data Mining. Sydney, NSW, Australia: IEEE, 911–6 (2010). doi: 10.1109/ICDM.2010.35. [DOI]
- 29. Rezaei M, Fränti P. Set matching measures for external cluster validity. IEEE Trans Knowl Data Eng 2016;28:2173–86. [Google Scholar]
- 30. Zeisel A, Muñoz-Manchado AB, Codeluppi S, et al. Cell types in the mouse cortex and hippocampus revealed by single-cell RNA-seq. Science 2015;347:1138–42. [DOI] [PubMed] [Google Scholar]
- 31. Jerby-Arnon L, Shah P, Cuoco MS, et al. A cancer cell program promotes T cell exclusion and resistance to checkpoint blockade. Cell 2018;175:984–997.e24. [DOI] [PMC free article] [PubMed] [Google Scholar]
- 32. Puram SV, Tirosh I, Parikh AS, et al. Single-cell transcriptomic analysis of primary and metastatic tumor ecosystems in head and neck cancer. Cell 2017;171:1611–1624.e24. [DOI] [PMC free article] [PubMed] [Google Scholar]
- 33. Satija R, Farrell JA, Gennert D, et al. Spatial reconstruction of single-cell gene expression data. Nat Biotechnol 2015;33:495–502. [DOI] [PMC free article] [PubMed] [Google Scholar]
- 34. Ohneda K, Ohmori S, Yamamoto M. Mouse Tryptase gene expression is Coordinately regulated by GATA1 and GATA2 in bone marrow-derived mast cells. Int J Mol Sci 2019;20:4603. [DOI] [PMC free article] [PubMed] [Google Scholar]
- 35. Fujiwara T. GATA transcription factors: basic principles and related human disorders. Tohoku J Exp Med 2017;242:83–91. [DOI] [PubMed] [Google Scholar]
- 36. Morgan JI, Curran T. Proto-oncogene transcription factors and epilepsy. Trends Pharmacol Sci 1991;12:343–9. [DOI] [PubMed] [Google Scholar]
- 37. Zhou Z-Q, Hurlin PJ. The interplay between mad and Myc in proliferation and differentiation. Trends Cell Biol 2001;11:S10–4. [DOI] [PubMed] [Google Scholar]
- 38. Oki S, Ohta T, Shioi G, et al. ChIP-atlas: a data-mining suite powered by full integration of public ChIP-seq data. EMBO Rep 2018;19:e46255. [DOI] [PMC free article] [PubMed] [Google Scholar]
- 39. Hashimi SM, Yu S, Alqurashi N, et al. Immunotoxin-mediated targeting of claudin-4 inhibits the proliferation of cancer cells. Int J Oncol 2013;42:1911–8. [DOI] [PubMed] [Google Scholar]
- 40. Guo F, Yuan D, Zhang J, et al. Silencing of ARL14 gene induces lung adenocarcinoma cells to a dormant state. Front Cell Dev Biol 2019;7:238. [DOI] [PMC free article] [PubMed] [Google Scholar]
- 41. Wang L, Shi J, Huang Y, et al. A six-gene prognostic model predicts overall survival in bladder cancer patients. Cancer Cell Int 2019;19:229. [DOI] [PMC free article] [PubMed] [Google Scholar]
- 42. Liu S, Qiu J, He G, et al. TRAIL promotes hepatocellular carcinoma apoptosis and inhibits proliferation and migration via interacting with IER3. Cancer Cell Int 2021;21:63. [DOI] [PMC free article] [PubMed] [Google Scholar]
- 43. Xiao F, Dai Y, Hu Y, et al. Expression profile analysis identifies IER3 to predict overall survival and promote lymph node metastasis in tongue cancer. Cancer Cell Int 2019;19:307. [DOI] [PMC free article] [PubMed] [Google Scholar]
- 44. Jordan KR, Sikora MJ, Slansky JE, et al. The capacity of the ovarian cancer tumor microenvironment to integrate inflammation signaling conveys a shorter disease-free interval. Clin Cancer Res Off J Am Assoc Cancer Res 2020;26:6362–73. [DOI] [PMC free article] [PubMed] [Google Scholar]
- 45. Li S, Yang J. Ovol proteins: guardians against EMT during epithelial differentiation. Dev Cell 2014;29:1–2. [DOI] [PMC free article] [PubMed] [Google Scholar]
- 46. Roca H, Hernandez J, Weidner S, et al. Transcription factors OVOL1 and OVOL2 induce the mesenchymal to epithelial transition in human cancer. PLoS One 2013;8:e76773. [DOI] [PMC free article] [PubMed] [Google Scholar]
- 47. Xu C, Yan T, Yang J. OVOL1 inhibits oral squamous cell carcinoma growth and metastasis by suppressing zinc finger E-box binding homeobox 1. Int J Clin Exp Pathol 2019;12:2801–8. [PMC free article] [PubMed] [Google Scholar]
- 48. Jiang Y, Cao W, Wu K, et al. LncRNA LINC00460 promotes EMT in head and neck squamous cell carcinoma by facilitating peroxiredoxin-1 into the nucleus. J Exp Clin Cancer Res CR 2019;38:365. [DOI] [PMC free article] [PubMed] [Google Scholar]
- 49. Sieńko J, Teliga-Czajkowska J, Przytula E, et al. Peroxiredoxin-1 as a prognostic factor in patients with ovarian cancer. Ann Agric Environ Med 2019;26:415–9. [DOI] [PubMed] [Google Scholar]
- 50. Lee E-Y, Kang J-Y, Kim K-W. Expression of cyclooxygenase-2, peroxiredoxin I, peroxiredoxin 6 and nuclear factor-κB in oral squamous cell carcinoma. Oncol Lett 2015;10:3129–36. [DOI] [PMC free article] [PubMed] [Google Scholar]
- 51. Chang W-M, Lin YF, Su CY, et al. Parathyroid hormone-like hormone is a poor prognosis marker of head and neck cancer and promotes cell growth via RUNX2 regulation. Sci Rep 2017;7:41131. [DOI] [PMC free article] [PubMed] [Google Scholar]
- 52. Lv Z, Wu X, Cao W, et al. Parathyroid hormone-related protein serves as a prognostic indicator in oral squamous cell carcinoma. J Exp Clin Cancer Res CR 2014;33:100. [DOI] [PMC free article] [PubMed] [Google Scholar]
- 53. Pitarresi JR, Norgard RJ, Chiarella AM, et al. PTHrP drives pancreatic cancer growth and metastasis and reveals a new therapeutic vulnerability. Cancer Discov 2021;11:1774–91. [DOI] [PMC free article] [PubMed] [Google Scholar]
- 54. Chistiakov DA, Myasoedova VA, Revin VV, et al. The impact of interferon-regulatory factors to macrophage differentiation and polarization into M1 and M2. Immunobiology 2018;223:101–11. [DOI] [PubMed] [Google Scholar]
- 55. Hu W, Li X, Zhang C, et al. Tumor-associated macrophages in cancers. Clin Transl Oncol 2016;18:251–8. [DOI] [PubMed] [Google Scholar]
- 56. Tang Z, Kang B, Li C, et al. GEPIA2: an enhanced web server for large-scale expression profiling and interactive analysis. Nucleic Acids Res 2019;47:W556–60. [DOI] [PMC free article] [PubMed] [Google Scholar]
- 57. Komohara Y, Niino D, Saito Y, et al. Clinical significance of CD163+ tumor-associated macrophages in patients with adult T-cell leukemia/lymphoma. Cancer Sci 2013;104:945–51. [DOI] [PMC free article] [PubMed] [Google Scholar]
- 58. Nguyen TT, Schwartz EJ, West RB, et al. Expression of CD163 (Hemoglobin scavenger receptor) in normal tissues, lymphomas, carcinomas, and sarcomas is largely restricted to the monocyte/macrophage lineage. Am J Surg Pathol 2005;29:617–24. [DOI] [PubMed] [Google Scholar]
- 59. Azizi E, Carr AJ, Plitas G, et al. Single-cell map of diverse immune phenotypes in the breast tumor microenvironment. Cell 2018;174:1293–1308.e36. [DOI] [PMC free article] [PubMed] [Google Scholar]
- 60. Friedman AD. Transcriptional regulation of granulocyte and monocyte development. Oncogene 2002;21:3377–90. [DOI] [PubMed] [Google Scholar]
- 61. Sherr CJ, Rettenmier CW, Sacca R, et al. The c-fms proto-oncogene product is related to the receptor for the mononuclear phagocyte growth factor, CSF 1. Cell 1985;41:665–76. [DOI] [PubMed] [Google Scholar]
- 62. Song G, Shi Y, Zhang M, et al. Global immune characterization of HBV/HCV-related hepatocellular carcinoma identifies macrophage and T-cell subsets associated with disease progression. Cell Discov 2020;6:90. [DOI] [PMC free article] [PubMed] [Google Scholar]
- 63. Langston PK, Nambu A, Jung J, et al. Glycerol phosphate shuttle enzyme GPD2 regulates macrophage inflammatory responses. Nat Immunol 2019;20:1186–95. [DOI] [PMC free article] [PubMed] [Google Scholar]
- 64. Dong B, Wang C, Zhang J, et al. Exosomes from human umbilical cord mesenchymal stem cells attenuate the inflammation of severe steroid-resistant asthma by reshaping macrophage polarization. Stem Cell Res Ther 2021;12:204. [DOI] [PMC free article] [PubMed] [Google Scholar]
- 65. De Biasi S, Gibellini L, Nasi M, et al. Rare cells: focus on detection and clinical relevance. In: Single Cell Analysis: Contemporary Research and Clinical Applications. Robinson J P and Cossarizza A (eds). Singapore: Springer, 2017, 39–58. 10.1007/978-981-10-4499-1_2. [DOI] [Google Scholar]
- 66. Alix-Panabières C, Pantel K. Challenges in circulating tumour cell research. Nat Rev Cancer 2014;14:623–31. [DOI] [PubMed] [Google Scholar]
- 67. Pool EH, Dunlop GR. Cancer cells in the blood stream. Am J Cancer 1934;21:99–102. [Google Scholar]
- 68. Sbarbati R, de Boer M, Marzilli M, et al. Immunologic detection of endothelial cells in human whole blood. Blood 1991;77:764–9. [PubMed] [Google Scholar]
- 69. Brennan PJ, Brigl M, Brenner MB. Invariant natural killer T cells: an innate activation scheme linked to diverse effector functions. Nat Rev Immunol 2013;13:101–17. [DOI] [PubMed] [Google Scholar]
- 70. Godfrey DI, Stankovic S, Baxter AG. Raising the NKT cell family. Nat Immunol 2010;11:197–206. [DOI] [PubMed] [Google Scholar]
- 71. Zhao X, Yu Q, Huang L, et al. Patterns of positive selection of the myogenic regulatory factor gene family in vertebrates. PLoS One 2014;9:e92873. [DOI] [PMC free article] [PubMed] [Google Scholar]
- 72. Braun T, Gautel M. Transcriptional mechanisms regulating skeletal muscle differentiation, growth and homeostasis. Nat Rev Mol Cell Biol 2011;12:349–61. [DOI] [PubMed] [Google Scholar]
- 73. Hodgson B, Mafi R, Mafi P, et al. The regulation of differentiation of mesenchymal stem-cells into skeletal muscle: a look at signalling molecules involved in Myogenesis. Curr Stem Cell Res Ther 2018;13:384–407. [DOI] [PubMed] [Google Scholar]
- 74. Hasty P, Bradley A, Morris JH, et al. Muscle deficiency and neonatal death in mice with a targeted mutation in the myogenin gene. Nature 1993;364:501–6. [DOI] [PubMed] [Google Scholar]
- 75. Nabeshima Y, Hanaoka K, Hayasaka M, et al. Myogenin gene disruption results in perinatal lethality because of severe muscle defect. Nature 1993;364:532–5. [DOI] [PubMed] [Google Scholar]
- 76. Li H, Jiang T, Li M-Q, et al. Transcriptional regulation of macrophages polarization by MicroRNAs. Front Immunol 2018;9:1175. [DOI] [PMC free article] [PubMed] [Google Scholar]
- 77. Salem S, Salem D, Gros P. Role of IRF8 in immune cells functions, protection against infections, and susceptibility to inflammatory diseases. Hum Genet 2020;139:707–21. [DOI] [PubMed] [Google Scholar]
- 78. Schaum N, et al. Single-cell transcriptomics of 20 mouse organs creates a tabula Muris. Nature 2018;562:367–72. [DOI] [PMC free article] [PubMed] [Google Scholar]
- 79. la Manno G, Soldatov R, Zeisel A, et al. RNA velocity of single cells. Nature 2018;560:494–8. [DOI] [PMC free article] [PubMed] [Google Scholar]
- 80. Shu H, Zhou J, Lian Q, et al. Modeling gene regulatory networks using neural network architectures. Nat Comput Sci 2021;1:491–501. [DOI] [PubMed] [Google Scholar]
- 81. Qin Q, Fan J, Zheng R, et al. Lisa: inferring transcriptional regulators through integrative modeling of public chromatin accessibility and ChIP-seq data. Genome Biol 2020;21:32. [DOI] [PMC free article] [PubMed] [Google Scholar]
- 82. Wang C, Sun D, Huang X, et al. Integrative analyses of single-cell transcriptome and regulome using MAESTRO. Genome Biol 2020;21:198. [DOI] [PMC free article] [PubMed] [Google Scholar]
Associated Data
This section collects any data citations, data availability statements, or supplementary materials included in this article.
Supplementary Materials
Data Availability Statement
The scRNA-seq datasets used in the current study can be found in NCBI’s Gene Expression Omnibus and are accessible through the following GEO accession number: GSE60361, GSE115978, GSE103322 and GSE109774. The full TF list used in the model training can be found on the GitHub of pySCENIC (https://github.com/aertslab/pySCENIC/tree/master/resources). The ChIP-seq datasets can be accessible through link http://chip-atlas.org/. The online survival analysis toolbox of tumor cells can be found on http://gepia2.cancer-pku.cn/#index.