Abstract
Understanding molecular mechanisms of intervertebral disc degeneration (IDD) and providing a novel target for the treatment of IDD have important implications. We sought to explore a new promising gene target for the treatment of IDD. This study integrated 19,678 genes of 38 IDD patients from two gene datasets. Differentially Expressed Genes (DEGs) of annulus fibrosus were analyzed in groups with mild disc degeneration (MDD) and severe disc degeneration (SDD). We screened the hub gene through biological information technology (bioinformatic) methods. Then, we further validated the hub gene using annulus fibrosus and nucleus pulposus tissues from 12 patients with qRT-PCR. In addition, we explored its underlying molecular mechanism with GO, KEGG and GSEA. Through multiple screening bioinformatics methods, the hub gene CD63 was identified. The qRT-PCR explored that CD63 decreased significantly in SDD group compared to that in MDD group (P < 0.001). The GO, KEGG and GSEA of CD63 explored significant enrichment of the molecular features (P < 0.001), including the cellular component (Extracellular matrix, P < 0.001), the molecular function (collagen binding, P < 0.001), the biological processes (protein targeting, collagen fibril organization and platelet degranulation, P < 0.001) and the signaling pathways. Our research explored and validated a new regulatory gene, CD63 for different degrees of IDD. A new novel form of therapeutic target for IDD may be developed.
Subject terms: Computational biology and bioinformatics, Biomarkers, Medical research
Introduction
Low back pain (LBP) is a common cause of disability and it negatively effects on the quality of life of patients globally1. However, the commonly reported and targeted factor for intervention is intervertebral disc degeneration (IDD). IDD plays a significant role in LBP and associates strongly with dysfunction and structural breakdown of intervertebral disc (IVD)2. The IDD is currently recognized among the common causes of morbidity2,3. Nonetheless, the etiology of IDD is multifactorial and their complex mechanisms are not well understood. Some studies have reported factors including apoptosis, insufficient nutritional supply and excessive mechanical load4. Currently, treatment for IDD is largely dependent on surgical intervention with disc excision and spinal fusion, for late-stage IDD as well as symptomatic relief. In the early stages for example, conservative treatments like bed rest, painkillers, or physiotherapy are usually the preferred option5. When it seriously affects the quality of people’s life, treatment for IDD is largely dependent on surgical intervention with disc excision and spinal fusion6. It is important to note that surgical treatment does not preserve the function of disc. The pathogenesis of IDD has been vastly linked to a lot of factors for instance, spine injuries, aging, spine deformities and genes7,8. A few studies have reported on numbers of genes and how they correlate with functional and structural changes within the IVD9–12. Even though such studies shed light on molecular aspect of IDD, there is still little knowledge regarding gene factors and their contribution to pathogenesis of IDD as well as therapeutic targets related to the disease. Determining the onset and different degrees of intervertebral disc degeneration of IDD based on relevant regulatory genes is an important insight for the prevention of IDD and more effective treatment options for the disease. This will enable the development of novel therapies for IDD that are more specific. Therefore, it was necessary to carry out this study. It may help us further understand the molecular mechanism of IDD and provide new promising targets for the diagnosis and treatment of IDD. So, we sought to explore a new promising gene target for the treatment of IDD.
Materials and METHODS
Data collection and preparation
We collected a total of 19,678 genes from 38 degenerative disc patients with complete clinical information from Gene Expression Omnibus (GEO) database for external analysis. Samples from two datasets GSE15227 and GSE23130 were selected. According to the Pfirrmann classification of IDD13, the gene expression profiles were obtained from 15 samples of GSE15227 with 5 mild disc degeneration (MDD) (grade I–II) and 10 severe disc degeneration (SDD) (grade III–V). Among the 23 samples data in GSE23130, gene expression profiles were obtained from 6 MDD (grade I–II) and 17 SDD (grade III-V). Both the two datasets were based on GLP1352 detection platform and come from the same microarray [U133_X3P] Affymetrix Human X3P Array.
The R package “limma” was used to transform RNA expression data from a biased distribution to an approximate normal distribution. The ComBat function of package “sva” was used to remove the batch effect of samples in datasets. The gene expression profiles data was standardized with log2 logarithm and package “limma” to eliminate the heterogeneity. A total of 19,678 genes were obtained through normalization of the two datasets.
Differential analysis of genes
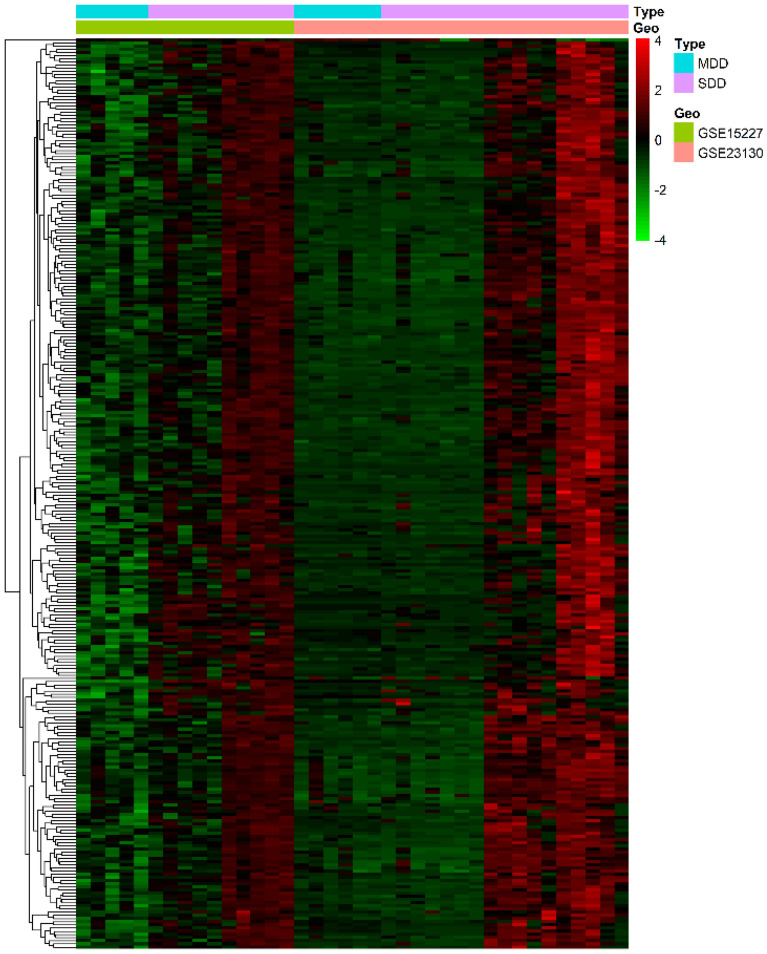
A total of 11 samples in the MDD group and 27 samples in the SDD group were analyzed. The R package “limma” was used to calculate the P-values and Fold Change (FC) of gene expression differences between the MDD group and SDD group. The P < 0.05 and |log2 FC|> 1 were selected as screening threshold for significant differential genes (DEGs). The filtered values of DEGs were extracted from data of standardized expression profiles. We also compared the similarities of the two datasets (GSE15227 vs. GSE23130) and performed a heatmap of the differential gene expression profiles of MDD group and SDD group in the two datasets.
Weighted correlation network analysis for DEGs
Weighted Correlation Network Analysis (WGCNA) of DEGs was carried out to further describe the association patterns of gene expression profiles. We calculated the Pearson correlation of DEGs with package “WGCNA”. The adjacent matrix was transformed into a topological overlap matrix. Thereafter, we calculated the dissimilarity of gene sets and gained the hierarchical clustering tree of genes with R, which were cut into different modules with a minimum number of 10 module genes. To screen out the hub module of IDD, correlations between gene modules and the grades of degenerative IVD samples were analyzed. The R package “WGCNA” was used to calculate Pearson Correlation (Cor) and P-values between DEGs and Pfirrmann classification of IDD with the screening criteria of Cor > 0.6 and P < 0.01. The key genes (Gene set A) that were closely related to IDD were identified and documented.
Construction of gene co-expression network
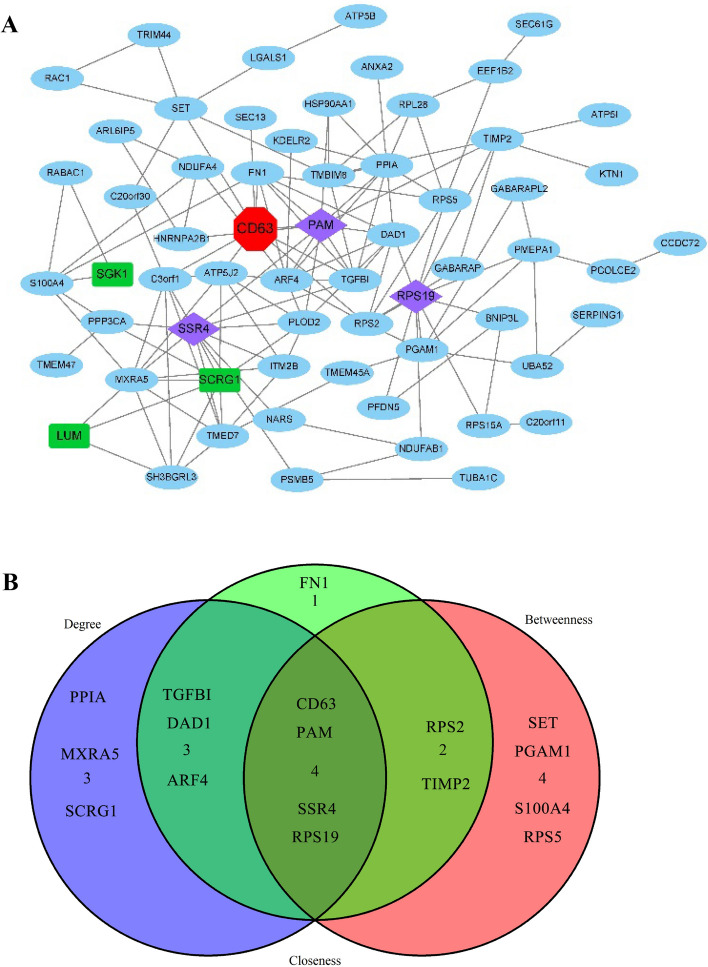
Cytoscape package “CytoNCA” were used to analyze three topological characteristics of each node in the network. This included degree of the node, number centricity and proximity to centrality. We extracted top ten common genes in each topological feature and constructed a co-expression genes (Gene set B) network with Cytoscape.
Select the target gene
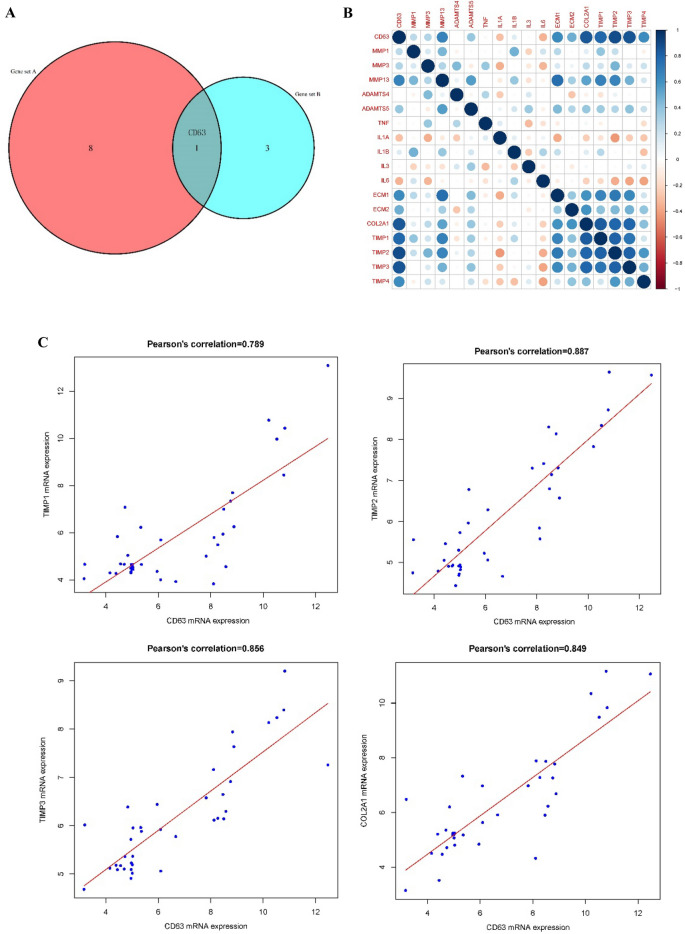
We took an intersection of the two key gene sets that screened by WGCNA (Gene set A) and Co-expression Network (Gene set B), and having the target gene CD63. To further estimate whether CD63 was closely related to IDD, we analyzed the Pearson Correlation between CD63 and IL114, ECM15, COL216, TIMP17, MMP18,19 as well as ADAMTS19,20 which were closely related to IDD significantly.
GO and KEGG analysis of gene set for hub module
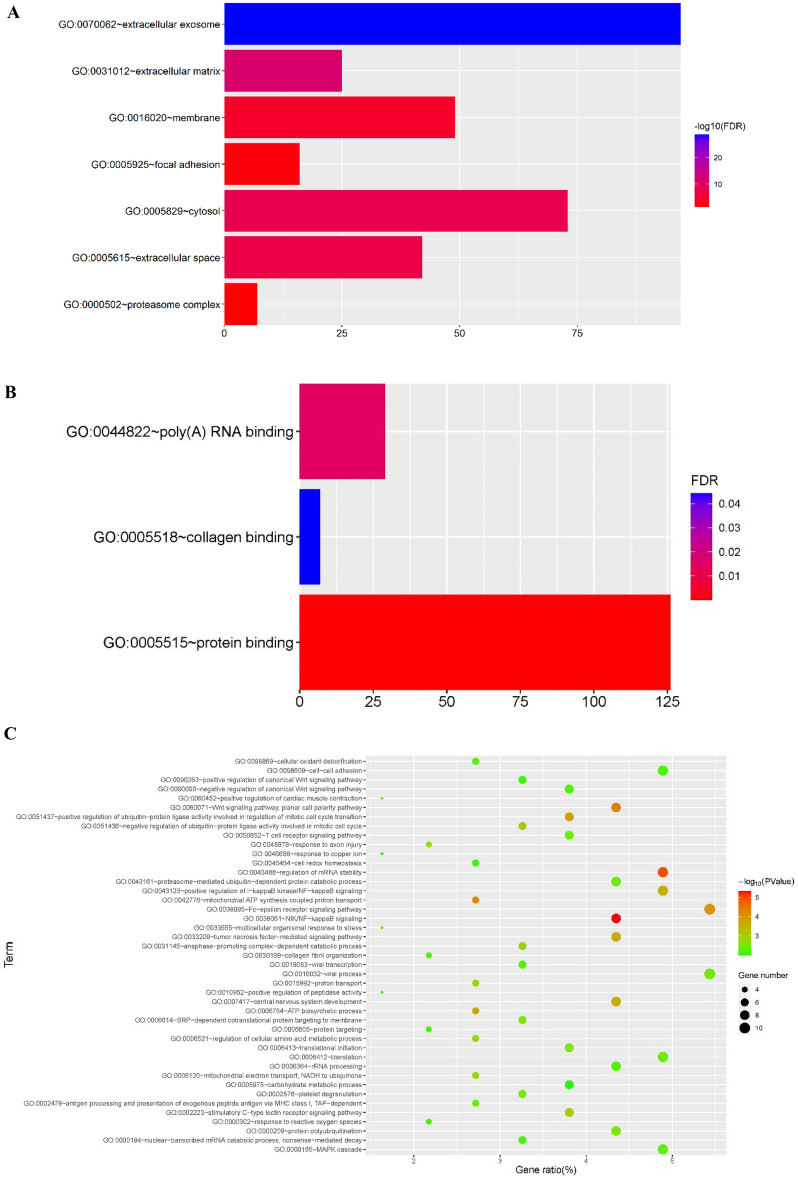
To further explore the mechanism of intervertebral disc degression, we performed Gene Ontology (GO) and Kyoto Encyclopedia of Genes and Genomes (KEGG)21–23 gene-set enrichment analysis of the hub modules in WGCNA. The GO defines gene function from three aspects: cellular component (CC), molecular function (MF) and biological process (BP). The KEGG provide enrichment analysis of gene pathway. The DAVID was used to perform GO and KEGG pathway enrichment analysis for the hub module. Then, we screened CC, BP, MF and signaling pathway with differential expression in the hub module of IDD. To fully understand the GO enrichment results associated with IDD, R was used to visualize the gene-set enrichment results.
Gene Set enrichment analysis
The GSEA were used to further identify the significantly enrichment function. The reference gene set used in this study were c5.all.v7.1.symbols.gmt and c2.cp.kegg.v7.1.symbols.gmt, with nominal P < 0.05 and FDR < 0.25 used as threshold to screen significant enrichment functions and pathways. Enrichment functions and signaling pathways of CD63 obtained in GSEA were intersected with the GO and KEGG pathways that were obtained from hub module of IDD.
Patient tissue samples
To further study and validate the role of CD63 in different degrees of IDD, annulus fibrosus (AF) and nucleus pulposus (NP) tissues from 12 patients (Table 1) were used to measure the expression of CD63 with qRT-PCR. The inclusion and exclusion criteria were as follows. Inclusion criteria: patients with mild and severe lumbar disc degeneration and treated with discectomy. Exclusion criteria: patients with intervertebral disc calcification and acute infection. The experimental protocols were approved by the Ethics Committee of Affiliated Hospital of Jining Medical University (Jining, China). Before the experiments, tissue samples of all the patients were collected with informed consent. This study performed in accordance with the declaration of Helsinki and guidelines of the Ethics Committee of Affiliated Hospital of Jining Medical University. The clinical samples were collected from patients with lumbar discectomy and were divided into MDD group (n = 6) (Supplementary Fig. 1) and SSD group (n = 6) (Supplementary Fig. 2) according to Pfirrmann classification13. In SDD of grade III-V, the boundary between annulus fibrosus and annulus fibrosus disappears, as well as the height of intervertebral space decreases, however, MDD of grade I and II only with signal intensity changes in MRI.
Table 1.
Clinical characteristics of patients.
| Item | MDD group (n = 6) | SDD group (n = 6) | P |
|---|---|---|---|
| Age (years) | 33 | 58 | |
| 55 | 38 | ||
| 39 | 50 | ||
| 40 | 38 | ||
| 41 | 31 | ||
| 35 | 44 | ||
| Age(M ± SD) | 40.50 ± 7.7395 | 43.17 ± 9.6833 | 0.6097 |
| Clinical feature | |||
| Sex (male) | 4 | 3 | > 0.999 |
| Low back pain | 5 | 4 | |
| Lower extremity radicular pain | 6 | 6 | |
Total RNA isolation and qRT-PCR
Total RNA was extracted respectively from AF and NP tissues of 12 patients with TRIzol Reagent (Invitrogen Life Technologies, Carlsbad, CA, USA). Reverse transcribed using PrimeScript RT Master Mix (Invitrogen Life Technologies, Carlsbad, CA, USA). qRT-PCR was performed using cDNA and SYBR mixture (CWBio, Beijing, China) to quantify the mRNA expression levels of CD63 and normalized it against β-actin. Relative expression levels of mRNA were computed with the method of 2−ΔΔ Ct.
Statistical analysis
The statistical analyses were calculated by GraphPad Prism 8. Significance was established at p < 0.05 and processed with GraphPad Prism 8.
Ethics declarations
We declare all the tissue samples of patients were collected with informed consent. The patients and their families were informed that data from the cases would be submitted for publication, and gave their consent. The experimental protocols were approved by the Ethics Committee of Affiliated Hospital of Jining Medical University (Jining, China). This study performed in accordance with the declaration of Helsinki and guidelines of the Ethics Committee of Affiliated Hospital of Jining Medical University.
Results
Hub module and genes
Based on the threshold of P < 0.01 and |log2 FC|> 1, 290 differential genes were screened out from the two datasets. The heatmap of the expression profiles of DEGs showed the similarity of the two datasets in SDD group and MDD group (Fig. 1). Three gene modules of MEturquoise, MEblue and MEblue were obtained from the hierarchical clustering of WGCNA (Fig. 2). Among these modules, MEturquoise had 198 genes, with the most significant difference of Cor = 0.5659 and P = 0.000213 (Table 2). In the Pearson correlation analysis between DEGs and IDD, nine key genes were screened (Cor > 0.6 and P < 0.001) (Table 3).
Figure 1.
Heatmap of differential gene expression profiles in GSE15227 and GSE23130. The heatmap showed the similarity of the two datasets in SDD group and MDD group. Red represents up-regulated genes and green represents down-regulated genes.
Figure 2.
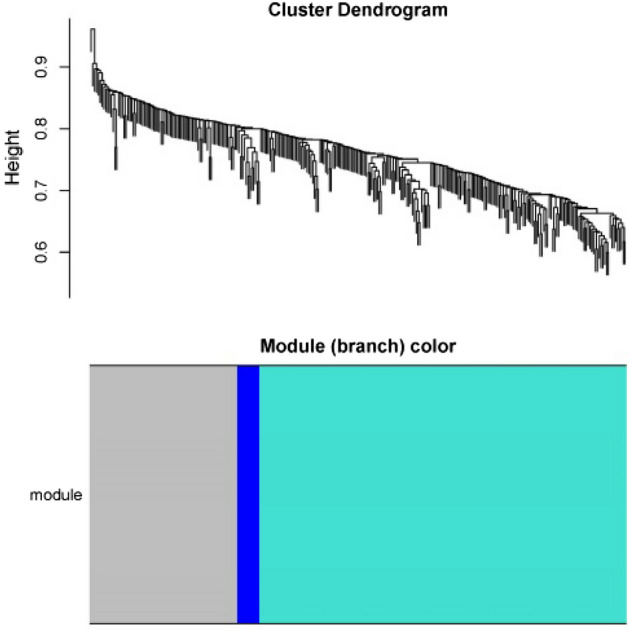
Gene modules. Three gene modules of MEturquoise, MEblue and MEblue were obtained. The MEturquoise is the hub module.
Table 2.
The Pearson Correlation and P-values between gene modules and IDD.
| Gene module | Cor | P |
|---|---|---|
| MEblue | 0.4744 | 0.002621 |
| MEturquoise | 0.5659 | 0.000213 |
| MEgrey | 0.4861 | 0.001976 |
Table 3.
The Pearson Correlation and P-values between DEGs and IDD.
| DEGs | Cor | P |
|---|---|---|
| C2CD2 | 0.6501 | < 0.001 |
| GSTP1 | 0.6343 | < 0.001 |
| SGK1 | 0.6318 | < 0.001 |
| CD63 | 0.6222 | < 0.001 |
| LUM | 0.6171 | < 0.001 |
| SCRG1 | 0.6131 | < 0.001 |
| C1S | 0.6074 | < 0.001 |
| REEP5 | 0.6034 | < 0.001 |
| CLIC1 | 0.6016 | < 0.001 |
Gene co-expression network
Through the analysis of WGCNA, a total of 81 gene nodes and 43 interaction pairs were obtained with the threshold of Cor > 0.6 as explored in the Gene Co-expression Network (Fig. 3A). It was found that the top 10 genes related to IDD in each Topological Features (Degrees, Meso-centricity, Proximity-centricity) including CD63, PAM, SSR4 and RPS19 (Fig. 3B).
Figure 3.
Gene co-expression network and topological features. (A) A total of 81 gene nodes and 43 interaction pairs obtained in the Weighted Correlation Network Analysis with the threshold of Cor > 0.6. (B) Intersection of the top 10 genes in each Topological Features (Betweenness, Closeness and Degree) related to intervertebral disc degeneration.
Selection of target genes
The genes that closely related to IDD, based on WGCNA (Gene set A) and Co-expression Network (Gene set B) screening were intersected and the hub gene CD63 obtained (Fig. 4A). Pearson Correlation Analysis between CD63 and IL1, ECM, COL2A1, TIMP, MMP and ADAMTS were performed (Fig. 4B). The results explored that CD63 was significantly related to TIMP1 (Cor = 0.789), TIMP2 (Cor = 0.887), TIMP3 (Cor = 0.856) and COL2A1 (Cor = 0.849) (Fig. 4C).
Figure 4.
Selection of target genes. (A) The genes that closely related to intervertebral disc degeneration screened in weighted correlation network analysis (Gene set A) and co-expression network (Gene set B). (B) Pearson correlation analysis between CD63 and IL1, ECM, COL2A1, TIMP, MMP and ADAMTS. (C) Significant relatedness of CD63 with TIMP1, TIMP2, TIMP3 and COL2A1.
GO, KEGG and GSEA
The analysis of GO (CC, MF and BP) enrichment for IDD was carried out. Genes in MEturquoise, the hub module associated with IDD, was significantly enriched in 7 cellular components (Fig. 5A), 3 items of molecular function (Fig. 5B) and 43 items of biological processes (Fig. 5C).
Figure 5.
The analysis of GO (Cellular Component, Molecular Function and Biological Process) enrichment for intervertebral disc degeneration. (A) Genes in the hub module associated with intervertebral disc degeneration significantly enriched in 7 cellular components, (B) 3 items of molecular function and (C) 43 items of biological processes.
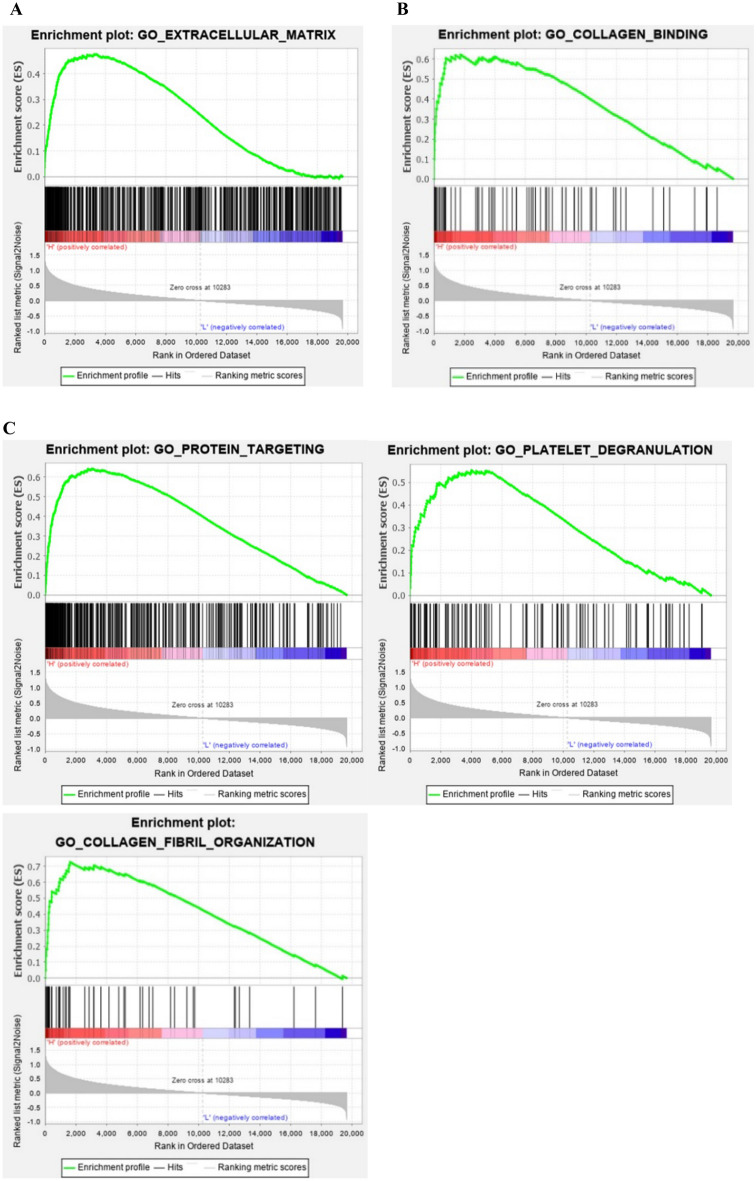
In the GSEA of CD63, 6 cellular components (|NES|> 1.8) (Table 4), 37 items of molecular function (|NES|> 1.78) (Table 5) and 42 items of biological processes (|NES|> 1.7) (Table 6) were obtained. Cellular components related to IDD that was screened from GSEA were intersected with that screened using WGCNA in hub module. The hub cellular component (Extracellular matrix) was finally obtained (Fig. 6A). The molecular functions and biological processes obtained from the GSEA of CD63 were intersected with that screened using WGCNA in the hub modules related to IDD. Finally, one hub molecular function (Collagen binding) (Fig. 6B) and three hub biological processes (Fig. 6C) were obtained.
Table 4.
The GSEA of CD63 for cellular components.
| Cellular components | P | FDR | NES |
|---|---|---|---|
| Extracellular exosome | < 0.001 | 0.0206 | 1.9779 |
| Extracellular matrix | < 0.001 | 0.0932 | 1.8534 |
| Cytosol | < 0.001 | 0.0777 | 1.8259 |
| Extracellular space | 0.0020 | 0.0641 | 1.8163 |
| Membrane | < 0.001 | 0.0528 | 1.8147 |
| Focal adhesion | 0.0020 | 0.0529 | 1.8016 |
Table 5.
The GSEA of CD63 for molecular function.
| Term | P | FDR | NES |
|---|---|---|---|
| Extracellular matrix structural constituent | < 0.001 | 0.0654 | 1.9780 |
| Translation elongation factor activity | < 0.001 | 0.0327 | 1.9761 |
| WW domain binding | < 0.001 | 0.0232 | 1.9741 |
| Fibroblast growth factor binding | < 0.001 | 0.0225 | 1.9589 |
| Growth factor binding | < 0.001 | 0.0195 | 1.9501 |
| Glycosaminoglycan binding | < 0.001 | 0.0383 | 1.8907 |
| Protease binding | < 0.001 | 0.0397 | 1.8764 |
| Disordered domain specific binding | < 0.001 | 0.0359 | 1.8720 |
| Calcium dependent phospholipid binding | 0.0021 | 0.0323 | 1.8695 |
| RNA helicase activity | < 0.001 | 0.0372 | 1.8513 |
| Beta catenin binding | < 0.001 | 0.0372 | 1.8452 |
| Translation regulator activity | < 0.001 | 0.0359 | 1.8410 |
| Cell adhesion molecule binding | < 0.001 | 0.0369 | 1.8351 |
| SMAD binding | < 0.001 | 0.0347 | 1.8341 |
| GTPase activity | < 0.001 | 0.0324 | 1.8335 |
| Extracellular matrix structural constituent conferring compression resistance | 0.0020 | 0.0306 | 1.8327 |
| Ubiquitin like protein ligase binding | < 0.001 | 0.0297 | 1.8314 |
| Kinase regulator activity | < 0.001 | 0.0293 | 1.8289 |
| Copper ion binding | < 0.001 | 0.0312 | 1.8229 |
| Translation regulator activity nucleic acid binding | < 0.001 | 0.0298 | 1.8217 |
| Calcium dependent protein binding | < 0.001 | 0.0296 | 1.8196 |
| ATPase binding | < 0.001 | 0.0283 | 1.8191 |
| GDP binding | < 0.001 | 0.0262 | 1.8181 |
| Ribosome binding | < 0.001 | 0.0274 | 1.8181 |
| Hyaluronic acid binding | 0.0021 | 0.0255 | 1.8176 |
| Cadherin binding | < 0.001 | 0.0258 | 1.8137 |
| Unfolded protein binding | < 0.001 | 0.0263 | 1.8082 |
| Monosaccharide binding | < 0.001 | 0.0258 | 1.8080 |
| mRNA binding | < 0.001 | 0.0252 | 1.8070 |
| Heparin binding | < 0.001 | 0.0244 | 1.8066 |
| Nucleobase containing compound transmembrane transporter activity | < 0.001 | 0.0252 | 1.8013 |
| mRNA 3 UTR binding | < 0.001 | 0.0248 | 1.8002 |
| Metalloendopeptidase inhibitor activity | 0.0082 | 0.0255 | 1.7952 |
| L ascorbic acid binding | < 0.001 | 0.0271 | 1.7904 |
| Heat shock protein binding | < 0.001 | 0.0274 | 1.7877 |
| Extracellular matrix structural constituent conferring tensile strength | 0.0021 | 0.0270 | 1.7864 |
| Collagen binding | 0.0019 | 0.0274 | 1.7813 |
Table 6.
The GSEA of CD63 for biological processes.
| Term | P | FDR | NES |
|---|---|---|---|
| Keratan sulfate metabolic process | < 0.001 | 0.2063 | 1.9954 |
| Cartilage development | 0.0020 | 0.2377 | 1.7909 |
| Protein targeting to membrane | 0.0021 | 0.2327 | 1.7866 |
| Pathway restricted SMAD protein phosphorylation | 0.0020 | 0.2220 | 1.7857 |
| Entrainment of circadian clock | < 0.001 | 0.2138 | 1.7840 |
| Relaxation of cardiac muscle | < 0.001 | 0.2035 | 1.7837 |
| Cellular response to gamma radiation | < 0.001 | 0.1974 | 1.7820 |
| Chondroitin sulfate biosynthetic process | < 0.001 | 0.1929 | 1.7799 |
| Proteoglycan biosynthetic process | 0.0020 | 0.1965 | 1.7742 |
| Artery development | < 0.001 | 0.1943 | 1.7705 |
| Connective tissue development | < 0.001 | 0.1991 | 1.7647 |
| Chondroitin sulfate proteoglycan biosynthetic process | 0.0020 | 0.1938 | 1.7636 |
| Negative regulation of cellular response to growth factor stimulus | < 0.001 | 0.1867 | 1.7635 |
| RNA polyadenylation | < 0.001 | 0.1813 | 1.7630 |
| Bone growth | < 0.001 | 0.1820 | 1.7599 |
| Chondrocyte differentiation | 0.0020 | 0.1785 | 1.7586 |
| Aminoglycan metabolic process | 0.0020 | 0.1850 | 1.7522 |
| Labyrinthine layer blood vessel development | 0.0021 | 0.1821 | 1.7504 |
| Protein targeting | < 0.001 | 0.1774 | 1.7501 |
| Regulation of morphogenesis of a branching structure | < 0.001 | 0.1742 | 1.7492 |
| Positive regulation of morphogenesis of an epithelium | < 0.001 | 0.1709 | 1.7487 |
| Growth plate cartilage morphogenesis | < 0.001 | 0.1794 | 1.7421 |
| Negative regulation of transmembrane receptor protein serine threonine kinase signaling pathway | < 0.001 | 0.1748 | 1.7419 |
| Sulfur compound biosynthetic process | < 0.001 | 0.1711 | 1.7413 |
| Entrainment of circadian clock by photoperiod | < 0.001 | 0.1675 | 1.7409 |
| Chondrocyte development | 0.0020 | 0.1633 | 1.7408 |
| Extracellular structure organization | < 0.001 | 0.1637 | 1.7378 |
| Ovulation | < 0.001 | 0.1618 | 1.7369 |
| Chaperone mediated protein folding | < 0.001 | 0.1667 | 1.7316 |
| Regulation of protein maturation | 0.0041 | 0.1630 | 1.7316 |
| Sulfur compound catabolic process | 0.0020 | 0.1678 | 1.7279 |
| Chondroitin sulfate proteoglycan metabolic process | 0.0020 | 0.1679 | 1.7260 |
| Cell recognition | < 0.001 | 0.1694 | 1.7231 |
| Bone development | < 0.001 | 0.1663 | 1.7229 |
| Collagen fibril organization | 0.0042 | 0.1640 | 1.7223 |
| Regulation of DNA templated transcription in response to stress | < 0.001 | 0.1609 | 1.7222 |
| Cellular aldehyde metabolic process | 0.0021 | 0.1628 | 1.7191 |
| Mesenchyme morphogenesis | < 0.001 | 0.1680 | 1.7146 |
| Platelet degranulation | 0.0020 | 0.1718 | 1.7114 |
| Cranial nerve development | < 0.001 | 0.1783 | 1.7064 |
| Aminoglycan catabolic process | 0.0063 | 0.1782 | 1.7044 |
| Regulation of receptor biosynthetic process | 0.0021 | 0.1783 | 1.7025 |
Figure 6.
GO (cellular component, molecular function and biological process) related to intervertebral disc degeneration in the hub modules intersected with gene set enrichment analysis of CD63. The hub cellular component (extracellular matrix) (A) molecular function (collagen binding) (B) as well as three biological processes (protein targeting, collagen fibril organization and Platelet degranulation) (C) were finally obtained.
Signaling pathways
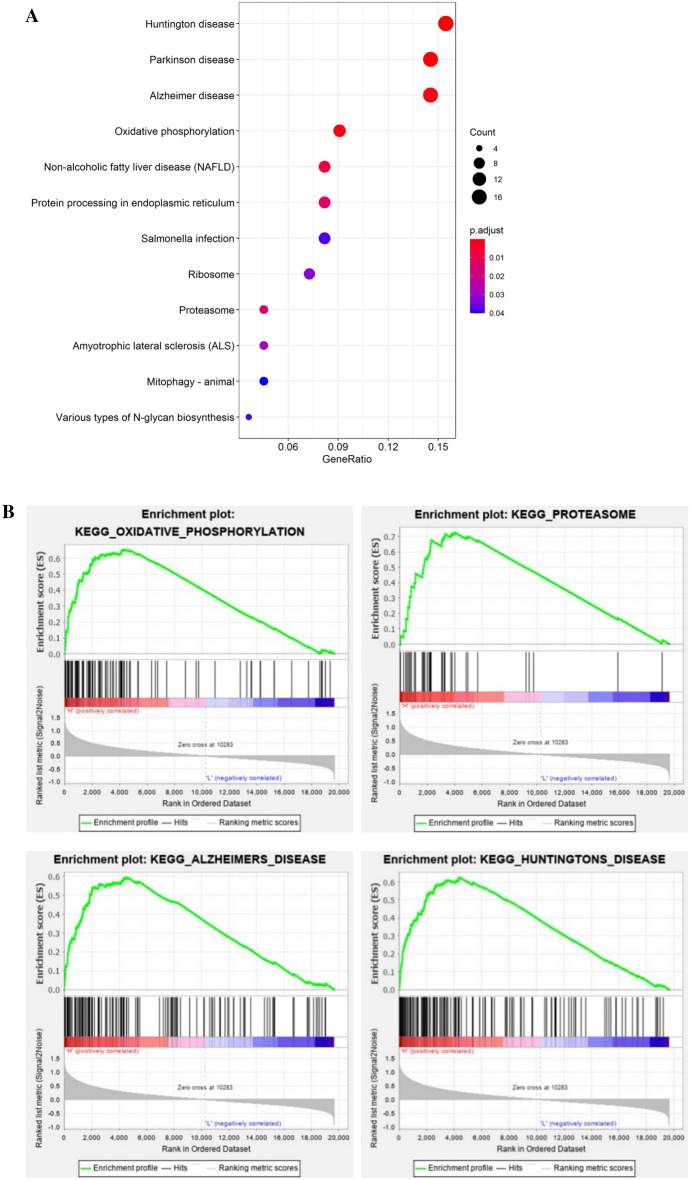
The enrichment analysis of KEGG pathways were performed for the genes in hub module (MEturquoise) that were screened using WGCNA. Results showed that the genes were significantly enriched in 12 signaling pathways (Fig. 7A). In the GSEA of CD63, 20 items of signaling pathways (Table 7) (|NES|> 1.55) were enriched. The signaling pathways obtained from GSEA of CD63 were intersected with genes screened using WGCNA in the hub module related to IDD, and 4 hub signaling pathways (Fig. 7B) were finally obtained.
Figure 7.
KEGG pathways related to intervertebral disc degeneration in the hub modules intersected with gene set enrichment analysis of CD63. (A) KEGG pathways significantly enriched in 12 signaling pathways. (B) 4 hub pathways were finally obtained when intersected KEGG pathways with gene set enrichment analysis of CD63.
Table 7.
The GSEA of CD63 for signaling pathways.
| Term | P | FDR | NES |
|---|---|---|---|
| Cardiac muscle contraction | 0.0079 | 0.0641 | 1.8305 |
| Alzheimers disease | < 0.001 | 0.0676 | 1.7623 |
| Huntingtons disease | < 0.001 | 0.0576 | 1.7500 |
| Glycolysis gluconeogenesis | 0.0039 | 0.0798 | 1.7115 |
| Oxidative phosphorylation | < 0.001 | 0.0673 | 1.7080 |
| Parkinsons disease | 0.0020 | 0.0809 | 1.6816 |
| Galactose metabolism | 0.0078 | 0.0722 | 1.6767 |
| Glycosaminoglycan biosynthesis chondroitin sulfate | 0.0020 | 0.0801 | 1.6585 |
| Selenoamino acid metabolism | 0.0040 | 0.0834 | 1.6444 |
| ECM receptor interaction | 0.0020 | 0.0849 | 1.6342 |
| Arrhythmogenic right ventricular cardiomyopathy | < 0.001 | 0.0873 | 1.6223 |
| Spliceosome | < 0.001 | 0.0912 | 1.6101 |
| Ribosome | 0.0061 | 0.1003 | 1.5917 |
| Glutathione metabolism | 0.0059 | 0.1057 | 1.5809 |
| N glycan biosynthesis | 0.0040 | 0.1006 | 1.5790 |
| Purine metabolism | 0.0060 | 0.0948 | 1.5783 |
| Focal adhesion | 0.0059 | 0.0974 | 1.5704 |
| Proteasome | < 0.001 | 0.1037 | 1.5548 |
| Gap junction | 0.0020 | 0.1033 | 1.5501 |
| Notch signaling pathway | 0.0079 | 0.0984 | 1.5501 |
Expression of CD63 in human AF and NP tissues
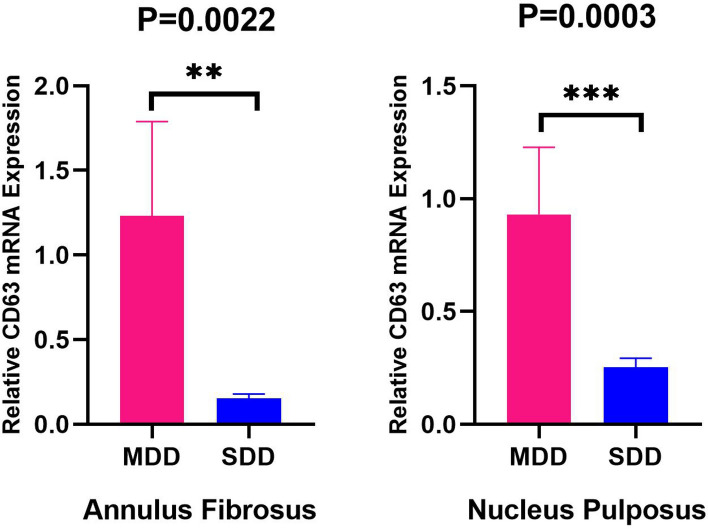
To further study and validate the role of CD63 in different degrees of IDD, we measured the expression of CD63 in AF and NP tissues from MDD patients (n = 6) and SDD patients (n = 6) with qRT-PCR. Results showed that the mRNA expression of CD63 in AF and NP tissues was markedly downregulated in SDD group compared to that in MDD group (Fig. 8) (P < 0.01).
Figure 8.
The expression of CD63 in annulus fibrosus and nucleus pulposus tissues from MDD (n = 6) and SDD (n = 6) patients with qRT-PCR. The mRNA expression of CD63 in annulus fibrosus and nucleus pulposus was markedly downregulated in SDD group compared to that in MDD group (P < 0.01).
Discussion
This study integrated 19,678 genes of 38 IDD patients from two gene datasets. We carried on multiple gene screening modes (DEGs Analysis, Pearson Correlation Analysis, WGCNA and Topological Characteristics) via biological information technology approach. Finally, the new regulatory gene for IDD, CD63, was identified.
CD63, also known as lysosome associated membrane protein 3 (LAMP3), belongs to the transmembrane 4 superfamily (TM4SF)24–26. The TM4SF members are related to each other and form a huge TM4SF network with some extra family proteins, which play vital roles in molecular metabolism27.
The gene CD63 can activate the surface antigens on platelets28. As a sensitive marker of platelet activation, detection of that index can sense the degree of platelet activation29, and then make a timely diagnosis and curative measure against the disease. Previous studies have reported the positive role of CD63 in the suppression of melanoma whereby it acted as a vital sign in patient assessment30,31. However, there is little research on the correlation between CD63 and IDD. Through multiple gene screening modes, we finally found the hub gene CD63. In the datasets, it was a significantly downregulated gene in SDD group compared to that in MDD group. Finally, the results of qRT-PCR of annulus fibrosus and nucleus pulposus tissues further validated that the expression of CD63 was markedly downregulated in SDD group. Different degrees of IDD may be closely related to the reduced expression of CD63. It may become a new promising gene for IDD and help us further enrich the therapeutic targets of IDD.
Extracellular matrix (ECM) located outside one or more cells and provided structural support. The main components of ECM are proteoglycans and collagen II that maintain the physiological function and stability of IVD. The components are reduced during the process of IDD, thus can be used as an important sign for IDD32. The ECM plays critical role in the maintenance of steady state for IVD and different degrees of IDD. CD63 was a cell surface binding partner for Tissue Inhibitor of Metalloproteinases-1 (TIMP-1) which play important role in the degradation and synthesis of matrix33.
The result of GO enrichment analysis also showed that CD63 play an important role in cell matrix. This is consistent with previous studies. It suggested that CD63 may participate in the regulation of IDD through ECM.
The screened MF of CD63 obtained using the conjoint analysis of WGCNA and GSEA were "collagen binding". Collagen, a main component of IVD, was fully demonstrated in IDD34. Collagen binding implies that a group of fibrous proteins with high tensile strength interact with collagen selectively and non-covalently. The Pearson Correlation Analysis further indicated that CD63 was significantly related with TIMP and collagen (Fig. 4). Previous studies had explored that TIMP and collagen were closely related to IDD, and both were important indicators of IDD16,17. Takawale et al35 identified a novel mechanism in vivo for TIMP1, CD63 and collagen synthesis, as well as CD63 shown to exist as a cell surface receptor for TIMP1. Their study also showed that TIMP1 mediates an association between CD63 and integrin β1, leading to de novo collagen synthesis on cardiac fibroblasts. The screened MF of CD63 (Collagen binding) explored potential molecular mechanism of CD63, TIMP1 and collagen in different degrees of IDD. Using yeast two-hybrid screening, Jung et al. identified CD63 as a cell surface binding partner for TIMP1 which played a critical role in TIMP1-mediated cell survival signaling and apoptosis inhibition33. In the future, the relationship between CD63 and TIMP1 would be reported in more diseases.
In addition, the significant enrichment of “protein targeting” and “collagen fibril organization” in BP, as well as “proteasome” and “oxidative phosphorylation” in the pathway of CD63 explored new basis and implications for the study of CD63 in IDD. Many previous studies also have reported the causes of IDD for example, decreased expression of collagen II and proteoglycan, increased expression of enzymic degradation in ECM and apoptosis in nucleus pulposus cells36–38.
Although we have tested the predictive results through clinical samples and explored their possible mechanism, the sample sizes may be still insufficient according to the difference between mild and severe disc degeneration groups studied with bioinformatic analysis. To the best of our knowledge, similar reports are rare. Therefore, in prospective studies, we intend to analyze the underlying molecular mechanisms mechanism of CD63 for IDD with multiple biological methods.
Conclusion
Our study explored and validated a new target gene CD63 for different degrees of IDD. The study and its findings are important as they form a basis upon which new therapeutic targets for IDD can be identified.
Supplementary Information
Acknowledgements
We would like to thank all the patients for providing their tissue samples. We also acknowledge assistance from proof-readers and editors.
Author contributions
C.Y.M. and S.G. designed the study; S.G. wrote the main manuscript text; S.G., S.J. and X.T.F. implemented biological information technology analyses; C.C.G. and Q.W.L. contributed biological information technology expertise and supervised analyses. Y.X.W. collected clinical materials of cases. All authors read and approved the final manuscript.
Funding
This study was supported by the Natural Science Foundation of Shandong Province, Grant ID: ZR2020KH010.
Data availability
The two available datasets in this paper are from the Gene Expression Omnibus (GEO) database (https://www.ncbi.nlm.nih.gov/geo/).
Competing interests
The authors declare no competing interests.
Footnotes
Publisher's note
Springer Nature remains neutral with regard to jurisdictional claims in published maps and institutional affiliations.
Supplementary Information
The online version contains supplementary material available at 10.1038/s41598-022-05021-4.
References
- 1.Borenstein D. Mechanical low back pain—a rheumatologist's view. Nat. Rev. Rheumatol. 2013;9:643–653. doi: 10.1038/nrrheum.2013.133. [DOI] [PubMed] [Google Scholar]
- 2.Luoma, K. et al. Low back pain in relation to lumbar disc degeneration. Spine (Phila Pa 1976)25, 487–492 (2000). [DOI] [PubMed]
- 3.Chou, D. et al. Degenerative magnetic resonance imaging changes in patients with chronic low back pain: a systematic review. Spine (Phila Pa 1976)36, S43–53 (2011). [DOI] [PubMed]
- 4.Adams MA, Dolan P. Could sudden increases in physical activity cause degeneration of intervertebral discs? Lancet. 1997;350:734–735. doi: 10.1016/S0140-6736(97)03021-3. [DOI] [PubMed] [Google Scholar]
- 5.van Tulder, M. W., Koes, B. W. & Bouter, L. M. Conservative treatment of acute and chronic nonspecific low back pain. A systematic review of randomized controlled trials of the most common interventions. Spine (Phila Pa 1976)22, 2128–2156 (1997). [DOI] [PubMed]
- 6.Chou, R. et al. Surgery for low back pain: a review of the evidence for an American Pain Society Clinical Practice Guideline. Spine (Phila Pa 1976)34, 1094–1109 (2009). [DOI] [PubMed]
- 7.Dowdell J, et al. Intervertebral disk degeneration and repair. Neurosurgery. 2017;80:S46–S54. doi: 10.1093/neuros/nyw078. [DOI] [PMC free article] [PubMed] [Google Scholar]
- 8.Fraser RD, Osti OL, Vernon-Roberts B. Intervertebral disc degeneration. Eur. Spine J. 1993;1:205–213. doi: 10.1007/BF00298361. [DOI] [PubMed] [Google Scholar]
- 9.Kepler CK, Ponnappan RK, Tannoury CA, Risbud MV, Anderson DG. The molecular basis of intervertebral disc degeneration. Spine J. 2013;13:318–330. doi: 10.1016/j.spinee.2012.12.003. [DOI] [PubMed] [Google Scholar]
- 10.Feng Y, Egan B, Wang J. Gene factors in intervertebral disc degeneration. Genes Dis. 2016;3:178–185. doi: 10.1016/j.gendis.2016.04.005. [DOI] [PMC free article] [PubMed] [Google Scholar]
- 11.Tsingas M, et al. Sox9 deletion causes severe intervertebral disc degeneration characterized by apoptosis, matrix remodeling, and compartment-specific transcriptomic changes. Matrix Biol. 2020;94:110–133. doi: 10.1016/j.matbio.2020.09.003. [DOI] [PMC free article] [PubMed] [Google Scholar]
- 12.Chen, X., Gu, M. & Zhang, X. Circular RNAs in compression-induced intervertebral disk degeneration. EBioMedicine54, 102720 (2020). [DOI] [PMC free article] [PubMed]
- 13.Pfirrmann, C. W., Metzdorf, A., Zanetti, M., Hodler, J. & Boos, N. Magnetic resonance classification of lumbar intervertebral disc degeneration. Spine (Phila Pa 1976)26, 1873–1878 (2001). [DOI] [PubMed]
- 14.Solovieva S, et al. Interleukin 1 polymorphisms and intervertebral disc degeneration. Epidemiology. 2004;15:626–633. doi: 10.1097/01.ede.0000135179.04563.35. [DOI] [PubMed] [Google Scholar]
- 15.Bedore J, Leask A, Seguin CA. Targeting the extracellular matrix: matricellular proteins regulate cell-extracellular matrix communication within distinct niches of the intervertebral disc. Matrix Biol. 2014;37:124–130. doi: 10.1016/j.matbio.2014.05.005. [DOI] [PubMed] [Google Scholar]
- 16.Ge J, et al. Melatonin protects intervertebral disc from degeneration by improving cell survival and function via activation of the ERK1/2 signaling pathway. Oxid. Med. Cell Longev. 2019;2019:5120275. doi: 10.1155/2019/5120275. [DOI] [PMC free article] [PubMed] [Google Scholar]
- 17.Liu Y, et al. Effects of AAV2-mediated co-transfection of CTGF and TIMP1 genes on degenerative lumbar intervertebral discs in rhesus monkeys in vivo. Am. J. Transl. Res. 2018;10:1085–1096. [PMC free article] [PubMed] [Google Scholar]
- 18.Choi H, et al. A novel mouse model of intervertebral disc degeneration shows altered cell fate and matrix homeostasis. Matrix Biol. 2018;70:102–122. doi: 10.1016/j.matbio.2018.03.019. [DOI] [PMC free article] [PubMed] [Google Scholar]
- 19.Vo NV, et al. Expression and regulation of metalloproteinases and their inhibitors in intervertebral disc aging and degeneration. Spine J. 2013;13:331–341. doi: 10.1016/j.spinee.2012.02.027. [DOI] [PMC free article] [PubMed] [Google Scholar]
- 20.Cong XY, et al. Electroacupuncture down-regulates expression of ADAMTS-4 of intervertebral disc in rats with lumbar intervertebral disc degeneration. Zhen Ci Yan Jiu. 2019;44:258–263. doi: 10.13702/j.1000-0607.170909. [DOI] [PubMed] [Google Scholar]
- 21.Kanehisa M, Goto S. KEGG: Kyoto encyclopedia of genes and genomes. Nucleic Acids Res. 2000;28:27–30. doi: 10.1093/nar/28.1.27. [DOI] [PMC free article] [PubMed] [Google Scholar]
- 22.Kanehisa M. Toward understanding the origin and evolution of cellular organisms. Protein Sci. 2019;28:1947–1951. doi: 10.1002/pro.3715. [DOI] [PMC free article] [PubMed] [Google Scholar]
- 23.Kanehisa M, Furumichi M, Sato Y, Ishiguro-Watanabe M, Tanabe M. KEGG: integrating viruses and cellular organisms. Nucleic Acids Res. 2021;49:D545–D551. doi: 10.1093/nar/gkaa970. [DOI] [PMC free article] [PubMed] [Google Scholar]
- 24.Claas C, Stipp CS, Hemler ME. Evaluation of prototype transmembrane 4 superfamily protein complexes and their relation to lipid rafts. J. Biol. Chem. 2001;276:7974–7984. doi: 10.1074/jbc.M008650200. [DOI] [PubMed] [Google Scholar]
- 25.Todres E, Nardi JB, Robertson HM. The tetraspanin superfamily in insects. Insect. Mol. Biol. 2000;9:581–590. doi: 10.1046/j.1365-2583.2000.00222.x. [DOI] [PubMed] [Google Scholar]
- 26.Stipp, C. S., Kolesnikova, T. V. & Hemler, M. E. Functional domains in tetraspanin proteins. Trends Biochem. Sci.28 (2003). [DOI] [PubMed]
- 27.Wright MD, Tomlinson MG. The ins and outs of the transmembrane 4 superfamily. Immunol. Today. 1994;15:588–594. doi: 10.1016/0167-5699(94)90222-4. [DOI] [PubMed] [Google Scholar]
- 28.Palabrica TM, et al. Thrombus imaging in a primate model with antibodies specific for an external membrane protein of activated platelets. Proc. Natl. Acad. Sci. USA. 1989;86:1036–1040. doi: 10.1073/pnas.86.3.1036. [DOI] [PMC free article] [PubMed] [Google Scholar]
- 29.Michelson AD, Barnard MR, Krueger LA, Frelinger AL, 3rd, Furman MI. Evaluation of platelet function by flow cytometry. Methods. 2000;21:259–270. doi: 10.1006/meth.2000.1006. [DOI] [PubMed] [Google Scholar]
- 30.Lupia A, et al. CD63 tetraspanin is a negative driver of epithelial-to-mesenchymal transition in human melanoma cells. J. Invest. Dermatol. 2014;134:2947–2956. doi: 10.1038/jid.2014.258. [DOI] [PubMed] [Google Scholar]
- 31.Jang HI, Lee H. A decrease in the expression of CD63 tetraspanin protein elevates invasive potential of human melanoma cells. Exp. Mol. Med. 2003;35:317–323. doi: 10.1038/emm.2003.43. [DOI] [PubMed] [Google Scholar]
- 32.Hayes AJ, Benjamin M, Ralphs JR. Extracellular matrix in development of the intervertebral disc. Matrix Biol. 2001;20:107–121. doi: 10.1016/S0945-053X(01)00125-1. [DOI] [PubMed] [Google Scholar]
- 33.Jung KK, Liu XW, Chirco R, Fridman R, Kim HR. Identification of CD63 as a tissue inhibitor of metalloproteinase-1 interacting cell surface protein. EMBO J. 2006;25:3934–3942. doi: 10.1038/sj.emboj.7601281. [DOI] [PMC free article] [PubMed] [Google Scholar]
- 34.Liang, T., Zhang, L. L., Xia, W., Yang, H. L. & Luo, Z. P. Individual collagen fibril thickening and stiffening of annulus fibrosus in degenerative intervertebral disc. Spine (Phila Pa 1976)42, E1104–E1111 (2017). [DOI] [PubMed]
- 35.Takawale A, et al. tissue inhibitor of matrix metalloproteinase-1 promotes myocardial fibrosis by mediating CD63-integrin beta1 interaction. Hypertension. 2017;69:1092–1103. doi: 10.1161/HYPERTENSIONAHA.117.09045. [DOI] [PubMed] [Google Scholar]
- 36.Wang J, et al. TNF-alpha and IL-1beta promote a disintegrin-like and metalloprotease with thrombospondin type I motif-5-mediated aggrecan degradation through syndecan-4 in intervertebral disc. J. Biol. Chem. 2011;286:39738–39749. doi: 10.1074/jbc.M111.264549. [DOI] [PMC free article] [PubMed] [Google Scholar]
- 37.Wang J, et al. Tumor necrosis factor alpha- and interleukin-1beta-dependent induction of CCL3 expression by annulus fibrosus cells promotes macrophage migration through CCR1. Arthritis Rheum. 2013;65:832–842. doi: 10.1002/art.37819. [DOI] [PMC free article] [PubMed] [Google Scholar]
- 38.Hiyama A, et al. Hypoxia activates the notch signaling pathway in cells of the intervertebral disc: Implications in degenerative disc disease. Arthritis Rheum. 2011;63:1355–1364. doi: 10.1002/art.30246. [DOI] [PMC free article] [PubMed] [Google Scholar]
Associated Data
This section collects any data citations, data availability statements, or supplementary materials included in this article.
Supplementary Materials
Data Availability Statement
The two available datasets in this paper are from the Gene Expression Omnibus (GEO) database (https://www.ncbi.nlm.nih.gov/geo/).


