

Abstract
Gene expression profiling can be used for predicting survival in multiple myeloma (MM) and identifying patients who will benefit from particular types of therapy. Some germline single nucleotide polymorphisms (SNPs) act as expression quantitative trait loci (eQTLs) showing strong associations with gene expression levels. We performed an association study to test whether eQTLs of genes reported to be associated with prognosis of MM patients are directly associated with measures of adverse outcome. Using the Genotype-Tissue Expression (GTEx) portal, we identified a total omultiplf 16 candidate genes with at least one eQTL SNP associated with their expression with p<10−7 either in EBV-transformed B-lymphocytes or whole blood. We genotyped the resulting 22 SNPs in 1,327 MM cases from the International Multiple Myeloma rESEarch (IMMEnSE) consortium and examined their association with overall survival (OS) and progression free survival (PFS), adjusting for age, sex, country of origin and disease stage. Three polymorphisms in two genes (TBRG4-rs1992292, TBRG4-rs2287535, ENTPD1-rs2153913) showed associations with (OS) at P<0.05, with the former two also associated with PFS. The associations of two polymorphisms in TBRG4 with OS were replicated in 1277 MM cases from the International Lymphoma Epidemiology (InterLymph) Consortium. A meta-analysis of the data from IMMEnSE and InterLymph (2579 cases) showed that TBRG4-rs1992292 is associated with OS (HR=1.14, 95%C.I. 1.04–1.26, p=0.007). In conclusion, we found biologically a plausible association between a SNP in TBRG4 and OS of MM patients.
Keywords: Multiple myeloma, overall survival, progression-free survival, genetic polymorphisms, eQTL
Introduction
Multiple myeloma (MM) is a malignancy of terminally differentiated plasma cells, which are primarily resident in the bone marrow. MM is the second most common haematological malignancy, with an annual crude incidence rate of 6.5 and 8 new cases per 100,000 inhabitants in Europe and in the United States of America, respectively1.
The advances in therapy made in the last decade have resulted in a considerable increase in patient survival. However, MM remains an incurable disease for most patients, who eventually relapse. The clinical course of MM is characterized by a high degree of heterogeneity, with long-term responders to therapy who survive long enough to eventually die of other causes, and patients who are refractory to any therapy and succumb very quickly to the disease2.
Gene expression profiling (GEP) is being widely used for tumor classification and prognosis and can effectively identify patients with very poor outcome. Numerous prognostic gene signatures have been identified in the past years; some of them were identified agnostically from direct comparison of patients with different survival while others were informed by genes relevant to the biology of MM3–11. Moreover, GEP has been able to classify patients based on their response to certain kinds of therapy, which could be valuable to personalize treatments given the vast heterogeneity of treatments and drug combinations12,13.
Over recent years single nucleotide polymorphisms (SNPs) have been found associated with MM survival, through candidate14–18 or genome wide association studies (GWAS)19,20. However, the influence of germline variants on MM outcome is still a poorly explored field and few studies have identified SNPs associated with a different response to specific therapies21.
Recent evidence derived from large projects such as the Genotype-Tissue Expression (GTEx) database have identified SNPs as expression quantitative trait loci (eQTLs), strongly associated with gene expression22. eQTLs have been successfully used as surrogates of direct measurement of gene expression to study disease etiology23,24. In most cases they are located in physical proximity to the genes whose expression they influence (“cis-eQTLs”, usually mapping to promoter or enhancer regions), while some eQTLs are located in a different chromosomal region, or even on a different chromosome from the gene whose expression is affected (“trans-eQTLs”). Interestingly, it has been shown that polymorphisms associated with complex traits in GWAS, including risk of many cancers, are enriched in eQTLs24,25. Considering that the expression of several genes is associated with MM prognosis we hypothesized that SNPs that affect expression levels of those genes might also be associated with prognosis.
We performed an association study within the International Multiple Myeloma rESEarch (IMMEnSE) consortium to examine SNPs that act as eQTLs for genes included in expression signatures that have been previously shown to influence MM survival. We hypothesize that these eQTLs could be used as markers of outcome. We attempted to replicate the top associations in the International Lymphoma Epidemiology (InterLymph) consortium and performed a meta-analysis of results from both consortia.
Materials and Methods
Study samples
International Multiple Myeloma rESEarch (IMMEnSE) consortium.
The first phase of the association study was performed in the IMMEnSE consortium, which has been described elsewhere26. Each collaborating institution retrospectively collected clinico-pathological data from medical records on age, sex, country of origin, disease stage (Durie-Salmon and/or International Staging System), and type of first-line therapy, response to first-line therapy, progression and vital status. We analyzed 1,302 MM patients with staging information for the Durie-Salmon system and 1,064 subjects with staging information for the International staging system (ISS), while 1,050 patients had data for both (table 1). MM cases were diagnosed according to the IMWG criteria from 2001 to 2015 and 640 were treated with bortezomib/immunomodulatory drugs which we defined as “recent therapies”.
Table 1.
Study populations
| IMMEnSE | InterLymph | ||
|---|---|---|---|
|
| |||
| Primary | Secondary | ||
|
| |||
| Country of origin | |||
| Italy | 124 | ||
| Poland | 793 | ||
| Spain | 103 | ||
| Portugal | 30 | ||
| Denmark | 260 | ||
| Hungary | 17 | ||
| USA | 765 | 392 | |
| Canada | 120 | ||
| Total | 1,327 | 885 | 392 |
|
| |||
| Median age (25%-75% percentiles) | 61 (54–67) | 61 (54–68) | 60 (53–67) |
|
| |||
| Gender | |||
| Males | 52% | 63% | 56% |
| Females | 48% | 37% | 44% |
|
| |||
| Disease stage Durie-Salmon a | |||
| 1 | 186 | 71 | - |
| 2 | 320 | 83 | - |
| 3 | 808 | 419 | - |
| Total | 1,316 | 574 | - |
|
| |||
| Disease stage ISS a | |||
| 1 | 323 | 178 | 156 |
| 2 | 347 | 466 | 127 |
| 3 | 393 | 241 | 109 |
| Total | 1,064 | 885 | 392 |
|
| |||
| First line therapy a,b | |||
| New | 640 | - | - |
| Old | 687 | - | - |
| Total | 1,327 | - | - |
|
| |||
| Median overall survival months | 39 (20.5–69.47) | 60 (31–93) | 55 (28–81) |
| (25%-75% percentiles) | |||
| Median progression-free survival months | 23 (11.70–43.72) | NA | NA |
| (25%-75% percentiles) | - | - | |
The sum does not add up to the total of subjects due to missing data.
New therapies are those based on proteasome inhibitors and/or immunomodulating drugs; old therapies are all others.
The IMMEnSE study protocol was approved by the Ethics Committee of the Medical Faculty of the University of Heidelberg (reference number: S-004/2020). Following the guidelines of the Declaration of Helsinki, written informed consent was obtained from each participant.
International Lymphoma Epidemiology (InterLymph) consortium.
Multiple myeloma studies from InterLymph consisted of 9 participating studies of European ancestry (EA) with genotype and phenotype information (2,434 cases and 3,446 controls), which was pooled to perform genome-wide association studies (GWAS) for risk and survival. In total, the primary InterLymph dataset had 885 cases with stage information (ISS). A secondary InterLymph survival dataset consisting of 392 patients diagnosed with MM with follow-up and disease stage available from The University of Texas/MD Anderson Cancer Center (MDACC) and University of California San Francisco in the United States was added.
Contributing studies were approved by local ethics review committees, and all participants provided written, informed consent.
Characteristics of study participants are summarized in table 1.
SNP selection
We selected a comprehensive list of genes whose expression levels were associated with poor MM prognosis in the literature 3–5,8,9,27. We also identified GEP signatures associated with differential response to therapy13. From this review, we assembled a list of 283 genes and searched for eQTLs associated with the expression levels of those genes using the browser of the genotype-tissue expression project GTEx (http://www.gtexportal.org) 24. For our study, the cis window established from the browser was 1 megabase up- and down-stream of the transcriptional start site of each gene. We performed these queries using the expression data on the tissues represented in GTEx that are closest to the cells of interest for MM, i.e. EBV-transformed B-lymphocytes (from 114 samples) and whole blood (from 338 samples). We ranked the eQTLs according to p-values of association with gene expression. Ten of these genes (RPS28, YWHAZ, CNDP2, TBRG4, HLA-DPA1, DHFR, RAB2A, SERPINB1, HLA-DRB1 IKZF1) have significant eQTLs in both tissues while six other genes (ACTR2, HELLS, ENTPD1, CCND2, CCND1, ANK3) had eQTLs in at least one of the tissues analysed. For each gene we selected at least one eQTL while considering the linkage disequilibrium (LD) among eQTLs. The final list included 22 independent SNPs from these 16 genes (table 2).
Table 2.
List of selected SNPs.
| Gene | Gene signature | SNP | Alleles Major/minor | GTEx p-valuea |
|---|---|---|---|---|
|
| ||||
| RPS28 | Kuiper 201211 | rs2972572 | A/G | 7.9×10−42 |
| DHFR | rs2560424 | C/T | 1.4×10⁻¹⁶ | |
| rs7387 | T/A | 1.4×10⁻¹⁶ | ||
| RAB2A | rs948421 | T/C | 1.2×10⁻¹⁰ | |
| HLA-DQB1 | Moreaux 2013 3 | rs1140347 | T/C | 2.3×10⁻³⁰ |
| rs1063355 | T/C | 2.1×10⁻²⁹ | ||
| HLA-DRB1 | rs66859861 | C/T | 1.7×10⁻¹⁸ | |
| rs9270917 | G/T | 4.7×10⁻²⁹ | ||
| SERPINB1 | rs62391542 | C/T | 8.6×10−08 | |
| HLA-DPA1 | rs116102562 | T/C | 9.3×10⁻¹⁶ | |
| rs1054026 | G/C | 4.2×10⁻¹⁵ | ||
| YWHAZ | Shaughnessy 20078 | rs3134353 | A/T | 4.5×10⁻¹⁸ |
| TBRG4 | rs1992292 | T/C | 3.5×10−08 | |
| rs2289375 | C/T | 3.1×10⁻¹⁰ | ||
| CNDP2 | Decaux 20084 | rs8084058 | A/G | 8.8×10−09 |
| rs4891557 | C/T | 4.4×10−09 | ||
| ACTR2 | Terragna 201613 | rs4671647 | C/T | 6.9×10⁻⁷ |
| HELLS | rs7100415 | G/C | 5.4×10⁻⁶ | |
| ENTPD1 | rs2153913 | G/C | 1.3×10⁻²¹ | |
| CCND2 | rs3217860 | A/G | 1.4×10⁻⁶ | |
| CCND1 | rs7102758 | A/G | 1.1×10⁻⁶ | |
| ANK3 | rs7072106 | C/G | 2.7×10⁻¹² | |
P-values of association between SNP genotypes and level of expression of the respective gene. The data used for the analyses described in this manuscript were obtained from: GTEx Analysis Release V7, accessed on 10/10/2017.
Genotyping and quality control
IMMEnSE.
Genomic DNA was extracted from peripheral blood using the QIAampR 96 DNA QIAcubeR HT Kit and stored at −20C till use. All the genotyping assays were carried out in 384-well format, with 10 ng of DNA from each subject using TaqMan (Thermo Fisher Scientific Inc.) or KASP (LGC Genomics) SNP genotyping assays. For quality control about 5% of the samples were interspersed in the plates as duplicated. Samples with a call rate lower than 80% (N=184) were discarded.
InterLymph GWAS (primary and secondary).
Samples were genotyped using the Affymetrix 6.0 and Illumina (610 Quad, Human660W-quad Beadchip, Omni5, OmniExpress Beadchip, Oncoarray) platforms. Each of the GWAS was subjected to rigorous standardised quality control independently prior to imputation, which was performed via the Michigan imputation server (https://imputationserver.sph.umich.edu/) based on the Haplotype Reference Consortium (HRC)29. After imputation, each site was filtered to include only imputed variants with information score>0.6 and further quality controls checks were implemented (genotype rate >95%, minor allele frequencies >0.01, and Hardy-Weinberg equilibrium (HWE) >x10−5 in controls). Finally, the data were pooled and final quality control was performed on the pooled GWAS set including checks for missingness, duplicates, sex mismatch, abnormal heterozygosity, cryptic relatedness, population outliers (principal components analyses: Eigenstrat), and genomic inflation (λ > 1.00). Additional information on the MM GWAS studies contributing in the InterLymph consortium are showed in supplementary table 1.
Statistical and bioinformatic analyses
Survival analysis in IMMEnSE was performed with Cox proportional hazards regression, calculating hazard ratios (HR) and 95% confidence intervals (CI), using overall survival (OS) and progression-free survival (PFS) as endpoints. OS was defined as the time interval between MM diagnosis and death or last follow-up. PFS was defined as the time interval between the ASCT (autologous stem cell transplantation) or high-dose treatment (for patients not eligible for ASCT) until documented progression or until the last progression-free examination. All analyses were adjusted for age at diagnosis, sex, country of origin, MM stage (calculated with the Durie-Salmon or ISS system) and type of first-line therapy, defined as treatment based on bortezomib/immunomodulatory drugs (“recent therapies”) or any other regimen (such as vincristine/adriamycin/dexamethasone or melphalan/prednisone, “chemotherapy based only therapies”). The statistical analysis was performed using per-allele and co-dominant models. We considered the threshold of statistical significance, using a Bonferroni correction, to be p<0.0023 (0.05/22 SNPs). A stratified analysis by type of first line therapy was also performed for the six polymorphisms selected from the signature of Terragna et al.13 In addition, we performed the same analysis adjusted by bone lesions for the two polymorphisms in TBRG4 since this gene is implicated in bone-related disease30.
The InterLymph survival GWAS data were analyzed using Gwasurvivr, an R package for genome-wide survival analysis31 with Cox-proportional hazard models adjusting for age, sex, site, 10 principal components from the GWAS, and ISS stage.
Results from IMMEnSE and InterLymph (primary and secondary) GWAS were meta-analysed according to a fixed effect model. The results of the single SNPs were not adjusted for type of first line therapy which was available only in IMMEnSE but not in InterLymph.
To identify the regulatory potential of selected SNPs and the regions nearby we used HaploReg (https://pubs.broadinstitute.org/mammals/haploreg/haploreg.php) 31 and RegulomeDb (http://regulome.stanford.edu) 33.
Results
For IMMEnSE, the overall genotyping call rate was 92.3%, the minimum call rate observed was 91.9% (rs2972572) and the maximum 98.2% (rs1992292). The concordance between duplicates was of 99.9%. Five of the selected SNPs (HLA-DQB1-rs141471663, HLA-DQB1-rs1130456, HLA-DRB1-rs66859861, SERPINB1-rs62392542, HLA-DPA1-rs116102562) were not in Hardy-Weinberg equilibrium (HWE). All those SNPs were located in chromosome 6 where the MHC complex is located as well. It is well known that this particular genomic region is not neutral from the point of view of natural selection and is also known to contain duplicated sequences and copy number variants (CNVs),34,35 and deviation from HWE may be expected34. Considering also that some of these SNPs (rs1140347 and rs62391542) are also not in HWE in the 1000 Genomes Project, and, on the other hand, that concordance of genotypes of duplicated samples in our study was 100% for these SNPs, we included them in further statistical analyses.
Discovery phase (IMMEnSE results).
The most significant association was seen for TBRG4-rs1992292 which showed an association with OS when adjusted for ISS disease stage system (table 3). The C/T genotype is associated with a worse OS in our set of patients (HR=1.59, 95% C.I.= 1.18–2.15, p=0.0024) in the co-dominant model of inheritance. Additionally, rs2289375, another independent SNP in the same gene, showed weaker evidence of association in the same direction of TBRG4-rs1992292 (HR=1.33, 95% C.I. =1.06–1.67, p=0.013). These 2 SNPs were also nominally associated with a worse PFS (table 4). Results were similar regardless of the staging system used for adjustment (Durie-Salmon or ISS).
Table 3.
Results of the association between OS of MM patients and eQTLs in the IMMEnSE population.
| SNP | Alleles (M/m)b |
N of patients | N of deceased patients | Allelic model | Codominant model | ||||
|---|---|---|---|---|---|---|---|---|---|
| HRhet (95% CI) | P | HRhet (95% CI) | P | HRhom (95% CI) | P | ||||
|
| |||||||||
| rs2972572 | A/G | 864 | 214 | 1.06(0.87–1.28) | 0.564 | 1.16(0.84–1.60) | 0.369 | 1.11(0.75–1.63) | 0.604 |
| rs1063355 | T/G | 836 | 206 | 1.06(0.90–1.25) | 0.454 | 1.10(0.78–1.55) | 0.563 | 1.13(0.81–1.56) | 0.477 |
| rs1140347 | G/A | 894 | 249 | 0.94(0.82–1.07) | 0.376 | 1.01(0.64–1.59) | 0.96 | 0.89(0.68–1.16) | 0.394 |
| rs66859861 | C/T | 890 | 240 | 0.98(0.84–1.15) | 0.83 | 1.20(0.84–1.73) | 0.311 | 1.00(0.73–1.39) | 0.973 |
| rs3134353 | T/A | 984 | 265 | 1.16(0.97–1.39) | 0.103 | 1.22(0.84–1.79) | 0.297 | 1.38(0.93–2.04) | 0.106 |
| rs8084058 | G/A | 970 | 262 | 0.97(0.81–1.15) | 0.755 | 0.93(0.66–1.32) | 0.695 | 0.93(0.65–1.34) | 0.705 |
| rs4891557 | C/T | 966 | 260 | 0.94(0.76–1.17) | 0.586 | 0.87(0.66–1.13) | 0.298 | 1.09(0.62–1.92) | 0.743 |
| rs1992292 | T/C | 984 | 265 | 1.23(1.05–1.45) | 0.012 | 1.59(1.18–2.15) | 0.002 | 1.52(1.08–2.16) | 0.017 |
| rs2289375 | C/T | 956 | 259 | 1.16(0.96–1.38) | 0.106 | 1.33(1.02–1.73) | 0.034 | 1.19(0.79–1.81) | 0.408 |
| rs1054026 | G/C | 984 | 263 | 0.87(0.70–1.08) | 0.223 | 0.70(0.37–1.33) | 0.275 | 0.64(0.35–1.19) | 0.163 |
| rs2560424 | C/T | 982 | 265 | 0.79(0.64–0.96) | 0.023 | 0.81(0.62–1.04) | 0.105 | 0.59(0.34–1.03) | 0.065 |
| rs116102562 | T/C | 935 | 243 | 0.97(0.65–1.44) | 0.886 | 1.06(0.33–3.41) | 0.922 | 0.99(0.37–2.66) | 0.982 |
| rs948421 | T/C | 978 | 265 | 1.17(0.97–1.39) | 0.094 | 1.31(0.90–1.90) | 0.152 | 1.42(0.96–2.10) | 0.076 |
| rs62391542 | C/T | 941 | 254 | 1.00(0.85–1.17) | 0.984 | 1.33(0.90–1.96) | 0.146 | 1.08(0.76–1.52) | 0.657 |
| rs7387 | T/A | 982 | 267 | 1.26(1.03–1.54) | 0.027 | 1.37(0.78–2.41) | 0.273 | 1.68(0.97–2.91) | 0.065 |
| rs4671647 | C/T | 1014 | 276 | 1.28(0.73–1.06) | 0.18 | 0.87(0.68–1.12) | 0.291 | 0.77(0.50–1.18) | 0.239 |
| rs7100415 | G/C | 981 | 272 | 0.99(0.84–1.18) | 0.954 | 1.00(0.77–1.31) | 0.961 | 0.98(0.68–1.40) | 0.909 |
| rs2153913 | G/C | 1022 | 277 | 0.88(0.75–1.05) | 0.146 | 0.71(0.54–0.94) | 0.017 | 0.79(0.58–1.08) | 0.149 |
| rs3217860 | A/G | 1012 | 272 | 0.87(0.71–1.06) | 0.181 | 0.82(0.63–1.05) | 0.13 | 0.90(0.53–1.52) | 0.7 |
| rs7102758 | A/G | 1018 | 277 | 0.95(0.73–1.24) | 0.718 | 0.92(0.70–1.22) | 0.589 | 1.02(0.73–1.43) | 0.891 |
| rs7072106 | C/G | 1017 | 272 | 1.05(0.88–1.27) | 0.556 | 1.09(0.85–1.40) | 0.484 | 1.07(0.67–1.0) | 0.787 |
adjusted for age, sex, country of orgin, ISS disease stage and kind of first line therapy
M = major allele; m = minor allele
Table 4.
Results of the association between PFS of MM patients and eQTLs in the IMMEnSE population.
| Gene | SNP | Alleles (M/m)b |
N of patients | N of deceased patients | Allelic model | Codominant model | ||||
|---|---|---|---|---|---|---|---|---|---|---|
| HRhet (95% CI) | P | HRhet (95% CI) | P | HRhom (95% CI) | P | |||||
|
| ||||||||||
| RPS28 | rs2972572 | A/G | 1072 | 298 | 1.03(0.88–1.20) | 0.703 | 1.11(0.85–1.48) | 0.429 | 1.06 (0.77–1.46) | 0.716 |
| HLA-DQB1 | rs1063355 | T/G | 1043 | 293 | 1.05(0.92–1.21) | 0.468 | 1.09 (0.82–1.44) | 0.559 | 1.10 (0.83–1.45) | 0.493 |
| HLA-DQB1 | rs1140347 | G/A | 1098 | 332 | 0.96(0.85–1.08) | 0.474 | 1.07 (0.74–1.54) | 0.726 | 0.92( 0.73–1.17) | 0.515 |
| HLA-DRB1 | rs66859861 | C/T | 1083 | 323 | 0.95(0.83–1.08) | 0.430 | 0.95 (0.70–1.29) | 0.757 | 0.90(0.68–1.18) | 0.44 |
| YWHAZ | rs3134353 | T/A | 1201 | 355 | 1.05(0.90–1.22) | 0.512 | 1.08 (0.80–1.47) | 0.602 | 1.12(0.81–1.54) | 0.491 |
| CNDP2 | rs8084058 | G/A | 1179 | 345 | 0.99(0.85–1.16) | 0.946 | 0.95(0.70–1.27) | 0.718 | 0.97(0.71–1.33) | 0.87 |
| CNDP3 | rs4891557 | C/T | 1174 | 348 | 0.91(0.76–1.10) | 0.336 | 0.85(0.68–1.07) | 0.184 | 0.98(0.61–1.60) | 0.96 |
| TBRG4 | rs1992292 | T/C | 1196 | 350 | 1.18(1.03–1.37) | 0.018 | 1.49(1.15–1.93) | 0.002 | 1.40(1.04–1.90) | 0.027 |
| TBRG4 | rs2289375 | C/T | 1165 | 345 | 1.17(1.00–1.37) | 0.044 | 1.33(1.06–1.67) | 0.013 | 1.23(0.85–1.76) | 0.269 |
| HLA-DPA1 | rs1054026 | G/C | 1200 | 352 | 0.99(0.81–1.20) | 0.923 | 0.89(0.49–1.60) | 0.699 | 0.91( 0.52–1.59) | 0.732 |
| DHFR | rs2560424 | C/T | 1202 | 356 | 0.85(0.71–1.01) | 0.069 | 0.87(0.69–1.09) | 0.225 | 0.68(0.42–1.10) | 0.117 |
| HLA-DPA1 | rs116102562 | T/C | 1126 | 312 | 1.03(0.72–1.47) | 0.872 | 1.14(0.40–3.28) | 0.801 | 1.12(0.46–2.72) | 0.802 |
| RAB2A | rs948421 | T/C | 1192 | 351 | 1.10(0.94–1.28) | 0.243 | 1.20(0.87–1.66) | 0.253 | 1.25( 0.89–1.74) | 0.194 |
| SERPINB1 | rs62391542 | C/T | 1155 | 339 | 1.02(0.89–1.17) | 0.773 | 1.34(0.97–1.86) | 0.076 | 1.11(0.83–1.49) | 0.468 |
| DHFR | rs7387 | T/A | 1201 | 356 | 1.07(0.91–1.27) | 0.411 | 1.13(1.13–1.76) | 0.592 | 1.19( 0.77–1.84) | 0.431 |
| ACTR2 | rs4671647 | C/T | 1223 | 359 | 0.92(0.78–1.08) | 0.319 | 0.85 (0.68–1.06) | 0.153 | 0.92 (0.65–1.32) | 0.67 |
| HELLS | rs7100415 | G/C | 1185 | 351 | 0.98(0.84–1.15) | 0.871 | 0.96 (0.76–1.20) | 0.702 | 0.97 (0.71–1.33) | 0.851 |
| ENTPD1 | rs2153913 | G/C | 1227 | 356 | 0.91(0.78–1.06) | 0.219 | 0.80 (0.63–1.02) | 0.071 | 0.85 (0.63–1.13) | 0.261 |
| CCND2 | rs3217860 | A/G | 1223 | 355 | 0.89(0.75–1.06) | 0.202 | 0.89 (0.71–1.11) | 0.286 | 0.80 (0.51–1.27) | 0.35 |
| CCND1 | rs7102758 | A/G | 1018 | 277 | 1.04(0.83–1.30) | 0.736 | 1.06 (0.83–1.35) | 0.661 | 1.02 (0.76–1.37) | 0.907 |
| ANK3 | rs7072106 | C/G | 1017 | 272 | 1.07(0.91–1.26) | 0.39 | 1.13 (0.91–1.41) | 0.261 | 1.10 (0.73–1.64) | 0.648 |
adjusted for age, sex, country of orgin, ISS disease stage and kind of first line therapy
M = major allele; m = minor allele
Additionally, we found several associations with different end-points at the nominal level of p<0.05. Namely, the ENTPD1-rs2153913 SNP showed associations with OS when considering all cases (HR=0.71, 95% C.I.=0.54–0.94, p=0.017, for the heterozygotes in the codominant model) and cases treated with new therapies (HR=0.61, 95% C.I.=0.37–0.98, p=0.043), but not cases treated with the old therapies (HR=0.78, 95% C.I.=0.55–1.11, p=0.168).
Both polymorphisms in TBRG4 showed associations with OS when adjusting by bone lesions. In particular, the strongest association was observed for TBRG4-rs1992292 for the codominant model of inheritance (HRhet=2.21, 95% C.I.=1.49–3.28, p=0.0001). All results for these analyses are reported in supplementary table 2.
All the results presented and tables 3 and 4 were adjusted for ISS, while the results adjusted using Durie-Salmon staging are showed in supplementary tables 3 and 4.
Replication phase (InterLymph).
Survival analysis in the InterLymph datasets was performed on the top three associations seen in IMMEnSE (p<0.05): ENTPD1-rs2153913, TBRG4-rs1992292, TBRG4-rs2289375. Associations with both polymorphisms in TBRG4 replicated in the primary InterLymph dataset with OS: rs1992292 showed an HR=1.16, 95% C.I.=1.01–1.33, p=0.046 and rs2289375 an HR=1.24, 95% C.I.=1.06–1.47, p=0.008, considering the allelic model. The association with ENTPD1-rs2153913 was not replicated in this set (HR=1.03, 95% C.I.=0.88–1.19, p=0.731). None of the above-mentioned associations replicated in the additional set of cases from the secondary InterLymph dataset.
A total of 2579 cases were used for the meta-analysis and the polymorphism TBRG4-rs1992292 showed to be significantly associated with OS, with no heterogeneity between the three groups (HR=1.14 95% C.I. 1.04–1.26, p=0.007) and a forest plot for this analysis is shown in figure 1. No evidence of association was observed for ENTPD1-rs2153913 (HR=0.93, 95% C.I. 0.84–1.04, p=0.211).
FIGURE 1.
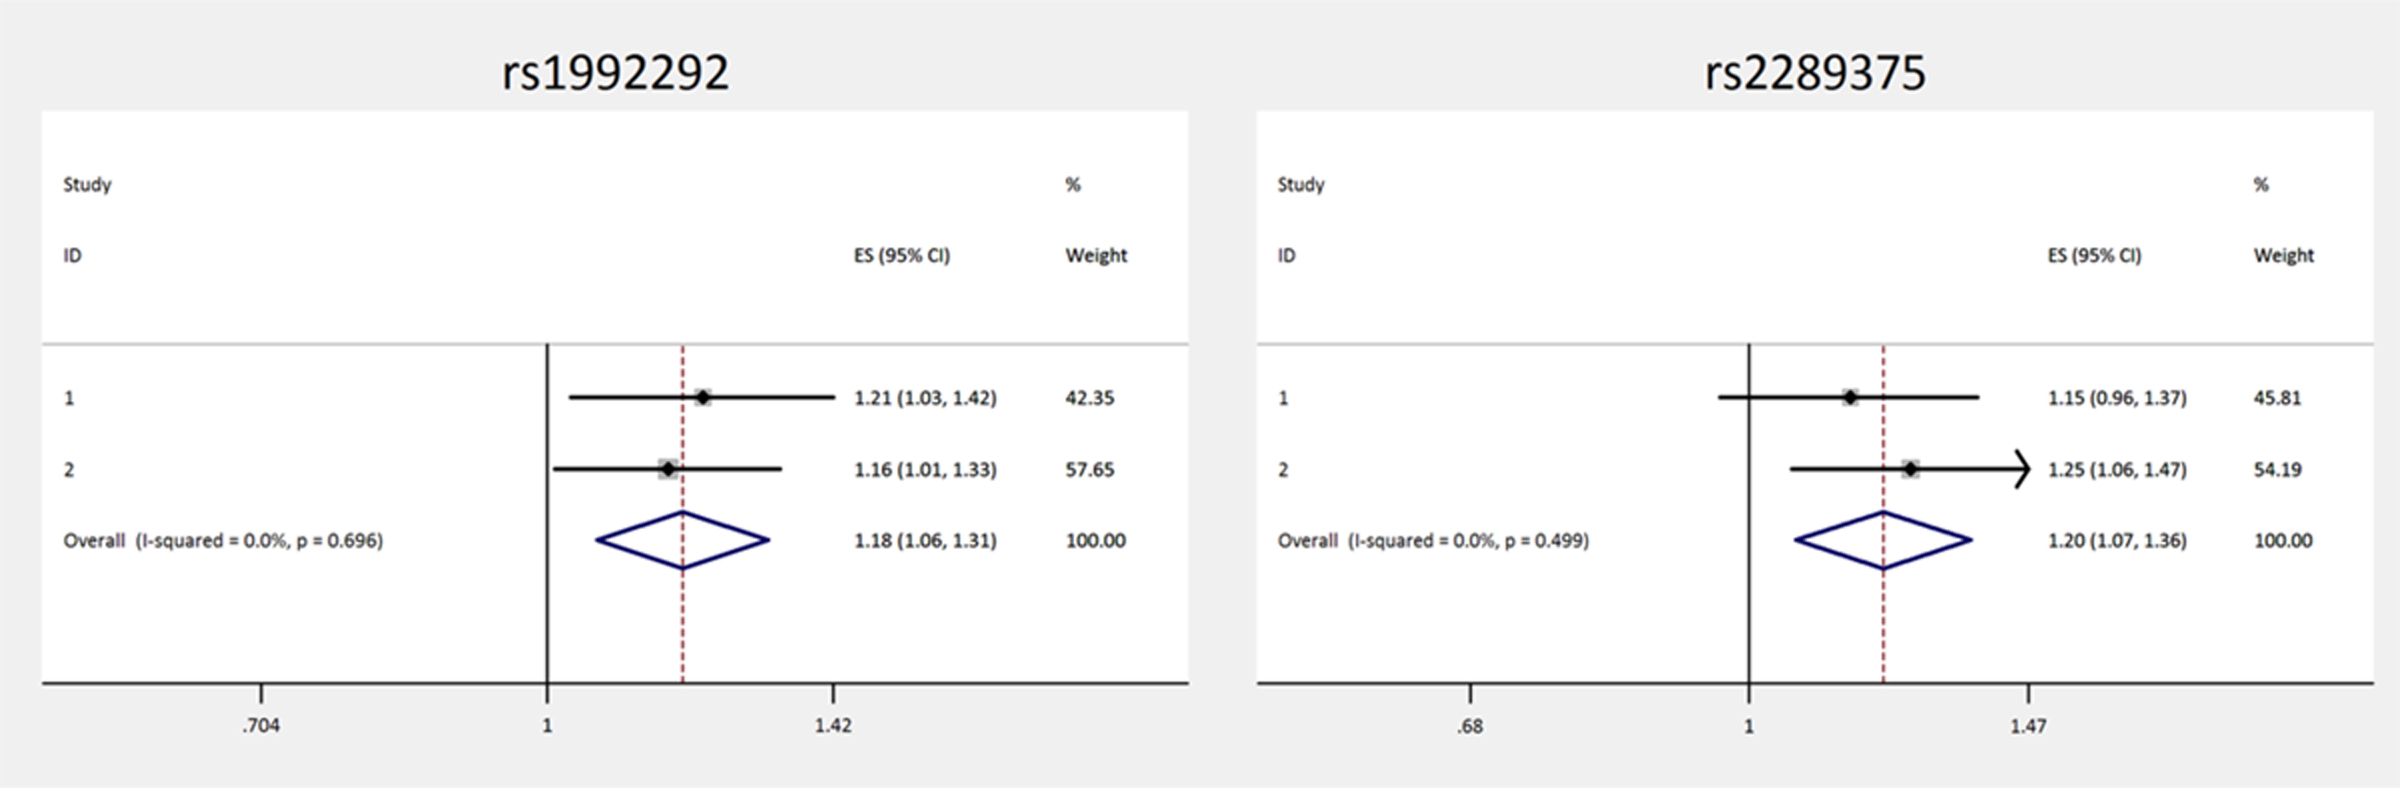
Forest plot forTBRG4-rs1992292
Kaplan-Meier curves for the survival of MM patients according to genotype at the two TBRG4 SNPs are shown separately for IMMEnSE and the primary InterLymph dataset (supplementary figure 1 and 2).
Discussion
The investigation of germline variants that act as expression quantitative trait loci (eQTL) for genes whose expression is known to affect MM prognosis could be used to identify predictors of patient outcome. Based on this rationale, we tested whether eQTLs of genes included in expression signatures that define MM patients with poor prognosis are associated with adverse outcome and therefore could be used as genetic markers of prognosis.
Our results suggest that the minor alleles of the TBRG4-rs1992292 and TBRG4-rs2289375 SNPs are associated with a worse survival. TBRG4 encodes for a regulator of transforming growth factor beta (TGF-β), which is involved in various cellular pathways, including the regulation of hematopoiesis, an important process for myeloma cell proliferation and survival26. Increased levels of TGF-β in the bone marrow microenvironment induce an increase of IL-6 and VEGF secretion, major cytokines involved in cancer cell proliferation and angiogenesis25. Moreover it has been reported that down-regulation of TBRG4 contributes to arrest of cell cycle in the G1 phase, which ultimately leads to a better outcome in MM 28. This gene was selected initially because it was reported that its higher expression is associated with a shorter survival in MM patients8.
TBRG4-rs1992292 is in strong LD (r2=0.935 in European population (CEU) of the 1000 Genomes project) with rs6967730, that has a rank of 1f in RegulomeDB, indicating that it is likely to affect the binding of additional transcription factors and it is linked to expression of TBRG4. In this regard, it has been reported that rs6967730 is located within a transcription factor binding site for CTCF (CCCTC-binding factor), a highly conserved zinc finger protein. CTCF can function as a transcriptional activator, a repressor or an insulator protein, blocking the communication between enhancers and promoters39. Therefore, rs6967730 could be responsible for changing the expression of TBRG4 by modifying the binding site of CTCF. Even though the information provided by our and other studies is relevant, in-depth analysis of the biological role of the TBRG4-rs1992292 SNP in modulating MM survival, including mechanistic insights, is still needed.
According to our results also TBRG4-rs2289375 is associated with a worse survival of MM patients. This SNP has a RegulomeDB rank of 2b and is in LD (r2=1) with rs3757573, which has a rank of 1f indicating that it could have a strong functional role in affecting the expression of TBRG4. The GTEx portal reports that the TT genotype is associated with a higher expression of TBRG4 in both the tissues we considered, in line with our results where carriers of this genotype have a worse survival (figure 2).
FIGURE 2.
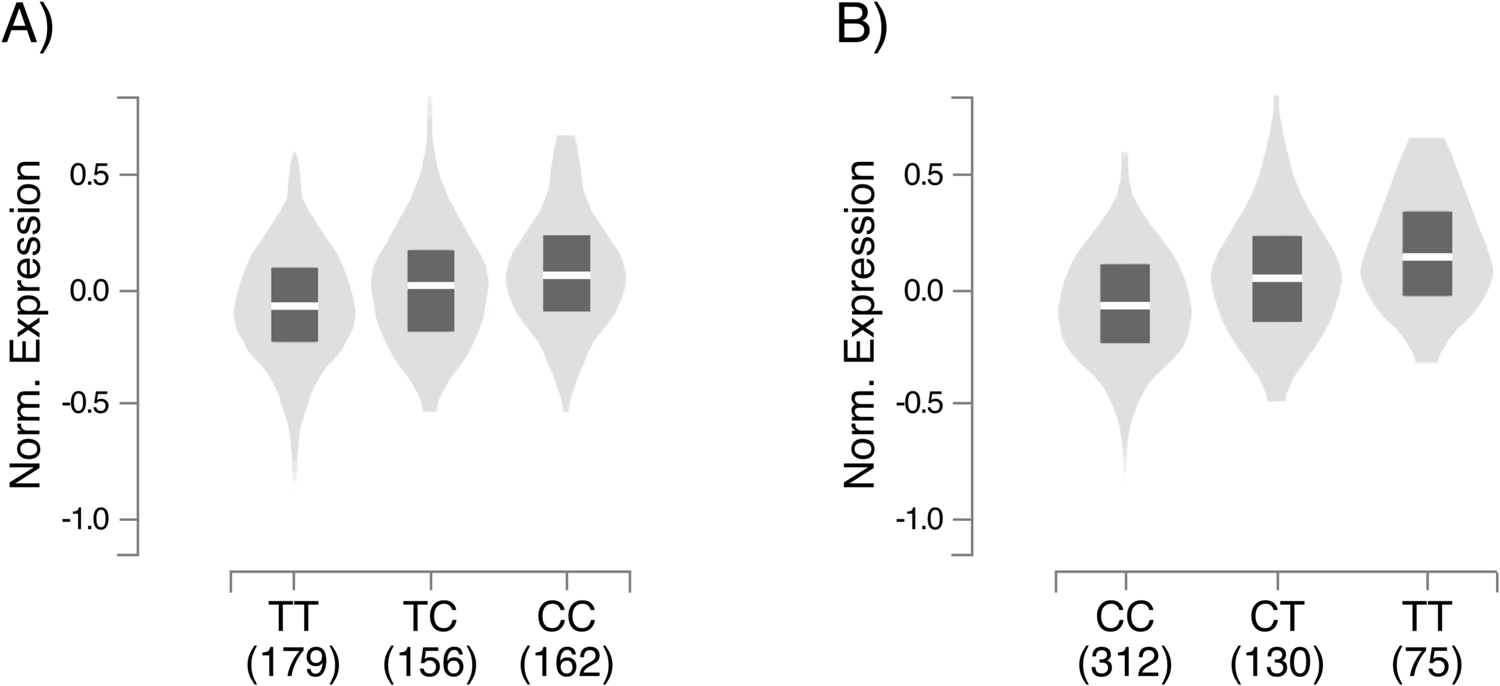
A, box plot of the association between rs1992292 andTBRG4 expression; B, box plot of the association between rs2289375and TBRG4 expression. The data used for the analyses described inthis manuscript were obtained from: GTEx Analysis Release V8,acccessed on 10/10/2019334.
Finally, although ENTPD1-rs215391 did not replicate in the InterLymph datasets, this SNP, according to our bioinformatics analysis, has a clear biological link with MM. Indeed, GTEx reports that the C allele of ENTPD1-rs215391 decreases the expression of the ENTPD1 gene, which translates into a lower production of adenosine which, in turn, results in a less active adenosine-mediated immunosuppressive pathway increasing the anticancer monitoring immune system. Considering the above, we cannot exclude a potential contribution of ENTPD1-rs215391 in MM outcome.
The study has some weaknesses: data on PFS and type of first line treatment were not available for InterLymph cases; therefore, we could not confirm the result obtained with PFS as endpoint. Another limitation is the lack of karyotype data which is involved in the heterogeneity observed in patient prognosis. Moreover, the selection of the eQTLs was limited to one or two eQTLs for each region that we selected (the ones showing associations with gene expression levels with the lowest p-values in GTEx) and therefore we could not exclude the possibility of having missed additional associations. Our results, however, represent a proof of principle that eQTLs could be used as MM survival markers and offer a starting point to further investigate in this direction alongside other known prognostic markers.
Standard eQTL analysis, which involves a direct association test between markers of genetic variation with gene expression levels, has many advantages. The main one is that the genotypes are not influenced by sample manipulation or by environmental variables since invariable throughout life of an individual. eQTL analysis can be performed in silico using available GWAS dataset and free bioinformatic tools as GTEx, which makes this kind of analysis basically costless compared to GEP which involves the use of expensive equipment and reagents.
The main strengths of the study are that our results were confirmed in two of three independent datasets with a large overall sample size with information on overall survival and stage.
In conclusion, we found biologically plausible associations between SNPs in TBRG4 and OS of MM patients that should be investigated more deeply. eQTLs are a valid surrogate for GEP, and are much easier to measure than GEP itself..
Supplementary Material
What’s new?
Gene expression profile (GEP) is widely used for tumor classification and prognosis of MM patients. SNPs so called expression quantitative trait loci (eQTLs) have been strongly associated with gene expression variation and have been successfully used as surrogates of direct measurement of gene expression to study disease etiology.
Herein we sought to test whether eQTLs of genes reported to be associated with prognosis of MM patients are directly associated with measures of adverse outcome.
Acknowledgements
The authors thank all site investigators that contributed to the studies within the Multiple Myeloma Working Group (Interlymph Consortium), staff involved at each site, and most importantly, the study participants for their contributions that made this study possible.
Grant support
This work was partially supported by intramural funds of University of Pisa and DKFZ.
This work was supported in part by the National Institute of Health/National Cancer Institute (R25 CA092049, P30 CA016672, R01 CA134674, P30 CA042014, R01 CA186646, R21 CA155951, U54 CA118948, P30 CA13148, R25 CA47888, R01 CA235026, R01 CA107476, R01 CA168762, P50 CA186781, and the NCI Intramural Research Program), Leukemia Lymphoma Society (6067-09), Huntsman Cancer Institute Pilot Funds, Utah Population Database, Utah Cancer Registry, Huntsman Cancer Center Support Grant, Utah State Department of Health, University of Utah, Canadian Institutes of Health Research (Grant number 81274), VicHealth, Cancer Council Victoria, Australian National Health and Medical Research Council (Grants 209057, 396414, 1074383), Victorian Cancer Registry, Australian Institute of Health and Welfare, Australian National Death Index, Australian Cancer Database, and the Mayo Clinic Cancer Center.
Abbreviation:
- ASCT
autologous stem cell transplantation
- CI
confidence intervals
- CTCF
CCCTC-binding factor
- EA
European ancestry
- eQTLs
expression quantitative trait loci
- GEP
Gene expression profile
- GWAS
genome wide association studies
- HR
hazard ratios
- HWE
Hardy-Weinberg equilibrium
- ISS
International staging syste
- LD
linkage disequilibrium
- MM
multiple myeloma
- OS
overall survival
- PFS
progression free survival
- SNPs
single nucleotide polymorphisms
Footnotes
Conflicts of interest
Authors declare no conflict of interests.
Data Availability Statement
The data that support the findings of this study are available on request from the corresponding author. The data are not publicly available due to privacy or ethical restrictions.
References
- 1.Bray F, Ferlay J, Soerjomataram I, et al. Global cancer statistics 2018: GLOBOCAN estimates of incidence and mortality worldwide for 36 cancers in 185 countries. CA: A Cancer Journal for Clinicians 2018;68:394–424. [DOI] [PubMed] [Google Scholar]
- 2.Rajkumar SV, Kumar S. Multiple Myeloma: Diagnosis and Treatment. Mayo Clin Proc 2016;91:101–19. [DOI] [PMC free article] [PubMed] [Google Scholar]
- 3.Moreaux J, Reme T, Leonard W, et al. Gene expression-based prediction of myeloma cell sensitivity to histone deacetylase inhibitors. Br J Cancer 2013;109:676–85. [DOI] [PMC free article] [PubMed] [Google Scholar]
- 4.Decaux O, Lodé L, Magrangeas F, et al. Prediction of survival in multiple myeloma based on gene expression profiles reveals cell cycle and chromosomal instability signatures in high-risk patients and hyperdiploid signatures in low-risk patients: a study of the Intergroupe Francophone du Myélome. J Clin Oncol 2008;26:4798–805. [DOI] [PubMed] [Google Scholar]
- 5.Fairfax BP, Makino S, Radhakrishnan J, et al. Genetics of gene expression in primary immune cells identifies cell type-specific master regulators and roles of HLA alleles. Nat Genet 2012;44:502–10. [DOI] [PMC free article] [PubMed] [Google Scholar]
- 6.Hermansen NEU, Borup R, Andersen MK, et al. Gene expression risk signatures maintain prognostic power in multiple myeloma despite microarray probe set translation. Int J Lab Hematol 2016;38:298–307. [DOI] [PubMed] [Google Scholar]
- 7.Heuck CJ, Qu P, van Rhee F, et al. Five gene probes carry most of the discriminatory power of the 70-gene risk model in multiple myeloma. Leukemia 2014;28:2410–3. [DOI] [PMC free article] [PubMed] [Google Scholar]
- 8.Shaughnessy JD, Zhan F, Burington BE, et al. A validated gene expression model of high-risk multiple myeloma is defined by deregulated expression of genes mapping to chromosome 1. Blood 2007;109:2276–84. [DOI] [PubMed] [Google Scholar]
- 9.Papanikolaou X, Alapat D, Rosenthal A, et al. The flow cytometry-defined light chain cytoplasmic immunoglobulin index and an associated 12-gene expression signature are independent prognostic factors in multiple myeloma. Leukemia 2015;29:1713–20. [DOI] [PMC free article] [PubMed] [Google Scholar]
- 10.Meißner T, Seckinger A, Hemminki K, et al. Profound impact of sample processing delay on gene expression of multiple myeloma plasma cells. BMC Med Genomics 2015;8:85. [DOI] [PMC free article] [PubMed] [Google Scholar]
- 11.Kuiper R, Broyl A, de Knegt Y, et al. A gene expression signature for high-risk multiple myeloma. Leukemia 2012;26:2406–13. [DOI] [PubMed] [Google Scholar]
- 12.Johnson SK, Heuck CJ, Albino AP, et al. The use of molecular-based risk stratification and pharmacogenomics for outcome prediction and personalized therapeutic management of multiple myeloma. Int J Hematol 2011;94:321–33. [DOI] [PMC free article] [PubMed] [Google Scholar]
- 13.Terragna C, Remondini D, Martello M, et al. The genetic and genomic background of multiple myeloma patients achieving complete response after induction therapy with bortezomib, thalidomide and dexamethasone (VTD). Oncotarget 2016;7:9666–79. [DOI] [PMC free article] [PubMed] [Google Scholar]
- 14.Erickson SW, Stephens OW, Chavan SS, et al. A common genetic variant in 19q13·3 is associated with outcome of multiple myeloma patients treated with Total Therapy 2 and 3. Br J Haematol 2016;174:991–3. [DOI] [PubMed] [Google Scholar]
- 15.Ríos-Tamayo R, Lupiañez CB, Campa D, et al. A common variant within the HNF1B gene is associated with overall survival of multiple myeloma patients: results from the IMMEnSE consortium and meta-analysis. Oncotarget 2016;7:59029–48. [DOI] [PMC free article] [PubMed] [Google Scholar]
- 16.Jakobsen Falk I, Lund J, Gréen H, et al. Pharmacogenetic study of the impact of ABCB1 single-nucleotide polymorphisms on lenalidomide treatment outcomes in patients with multiple myeloma: results from a phase IV observational study and subsequent phase II clinical trial. Cancer Chemother Pharmacol 2018;81:183–93. [DOI] [PMC free article] [PubMed] [Google Scholar]
- 17.Macauda A, Castelli E, Buda G, et al. Inherited variation in the xenobiotic transporter pathway and survival of multiple myeloma patients. Br J Haematol 2018;183:375–84. [DOI] [PubMed] [Google Scholar]
- 18.Campa D, Martino A, Macauda A, et al. Genetic polymorphisms in genes of class switch recombination and multiple myeloma risk and survival: an IMMEnSE study. Leuk Lymphoma 2019;60:1803–11. [DOI] [PubMed] [Google Scholar]
- 19.Ziv E, Dean E, Hu D, et al. Genome-wide association study identifies variants at 16p13 associated with survival in multiple myeloma patients. Nat Commun 2015;6:7539. [DOI] [PMC free article] [PubMed] [Google Scholar]
- 20.Johnson DC, Weinhold N, Mitchell JS, et al. Genome-wide association study identifies variation at 6q25.1 associated with survival in multiple myeloma. Nat Commun 2016;7:10290. [DOI] [PMC free article] [PubMed] [Google Scholar]
- 21.Vangsted A, Klausen TW, Vogel U. Genetic variations in multiple myeloma II: association with effect of treatment. Eur J Haematol 2012;88:93–117. [DOI] [PubMed] [Google Scholar]
- 22.Westra H-J, Franke L. From genome to function by studying eQTLs. Biochim Biophys Acta 2014;1842:1896–902. [DOI] [PubMed] [Google Scholar]
- 23.Li Q, Seo J-H, Stranger B, et al. Integrative eQTL-based analyses reveal the biology of breast cancer risk loci. Cell 2013;152:633–41. [DOI] [PMC free article] [PubMed] [Google Scholar]
- 24.Nicolae DL, Gamazon E, Zhang W, et al. Trait-associated SNPs are more likely to be eQTLs: annotation to enhance discovery from GWAS. PLoS Genet 2010;6:e1000888. [DOI] [PMC free article] [PubMed] [Google Scholar]
- 25.Peters JE, Lyons PA, Lee JC, et al. Insight into Genotype-Phenotype Associations through eQTL Mapping in Multiple Cell Types in Health and Immune-Mediated Disease. PLoS Genet 2016;12:e1005908. [DOI] [PMC free article] [PubMed] [Google Scholar]
- 26.Martino A, Sainz J, Buda G, et al. Genetics and molecular epidemiology of multiple myeloma: the rationale for the IMMEnSE consortium (review). Int J Oncol 2012;40:625–38. [DOI] [PubMed] [Google Scholar]
- 27.Dixon AL, Liang L, Moffatt MF, et al. A genome-wide association study of global gene expression. Nat Genet 2007;39:1202–7. [DOI] [PubMed] [Google Scholar]
- 28.GTEx Consortium. The Genotype-Tissue Expression (GTEx) project. Nat Genet 2013;45:580–5. [DOI] [PMC free article] [PubMed] [Google Scholar]
- 29.Loh P-R, Danecek P, Palamara PF, et al. Reference-based phasing using the Haplotype Reference Consortium panel. Nat Genet 2016;48:1443–8. [DOI] [PMC free article] [PubMed] [Google Scholar]
- 30.Matsumoto T, Abe M. TGF-β-related mechanisms of bone destruction in multiple myeloma. Bone 2011;48:129–34. [DOI] [PubMed] [Google Scholar]
- 31.Rizvi AA, Karaesmen E, Morgan M, et al. gwasurvivr: an R package for genome-wide survival analysis. Bioinformatics 2019;35:1968–70. [DOI] [PMC free article] [PubMed] [Google Scholar]
- 32.Ward LD, Kellis M. HaploReg v4: systematic mining of putative causal variants, cell types, regulators and target genes for human complex traits and disease. Nucleic Acids Res 2016;44:D877–881. [DOI] [PMC free article] [PubMed] [Google Scholar]
- 33.Boyle AP, Hong EL, Hariharan M, et al. Annotation of functional variation in personal genomes using RegulomeDB. Genome Res 2012;22:1790–7. [DOI] [PMC free article] [PubMed] [Google Scholar]
- 34.Graffelman J, Jain D, Weir B. A genome-wide study of Hardy-Weinberg equilibrium with next generation sequence data. Hum Genet 2017;136:727–41. [DOI] [PMC free article] [PubMed] [Google Scholar]
- 35.Yasukochi Y, Satta Y. Current perspectives on the intensity of natural selection of MHC loci. Immunogenetics 2013;65:479–83. [DOI] [PMC free article] [PubMed] [Google Scholar]
- 36.Urashima M, Ogata A, Chauhan D, et al. Transforming growth factor-beta1: differential effects on multiple myeloma versus normal B cells. Blood 1996;87:1928–38. [PubMed] [Google Scholar]
- 37.Sevcikova S, Paszekova H, Besse L, et al. Extramedullary relapse of multiple myeloma defined as the highest risk group based on deregulated gene expression data. Biomed Pap Med Fac Univ Palacky Olomouc Czech Repub 2015;159:288–93. [DOI] [PubMed] [Google Scholar]
- 38.Sarasquete ME, Martínez-López J, Chillón MC, et al. Evaluating gene expression profiling by quantitative polymerase chain reaction to develop a clinically feasible test for outcome prediction in multiple myeloma. Br J Haematol 2013;163:223–34. [DOI] [PubMed] [Google Scholar]
- 39.Kim S, Yu N-K, Kaang B-K. CTCF as a multifunctional protein in genome regulation and gene expression. Exp Mol Med 2015;47:e166. [DOI] [PMC free article] [PubMed] [Google Scholar]
Associated Data
This section collects any data citations, data availability statements, or supplementary materials included in this article.
Supplementary Materials
Data Availability Statement
The data that support the findings of this study are available on request from the corresponding author. The data are not publicly available due to privacy or ethical restrictions.