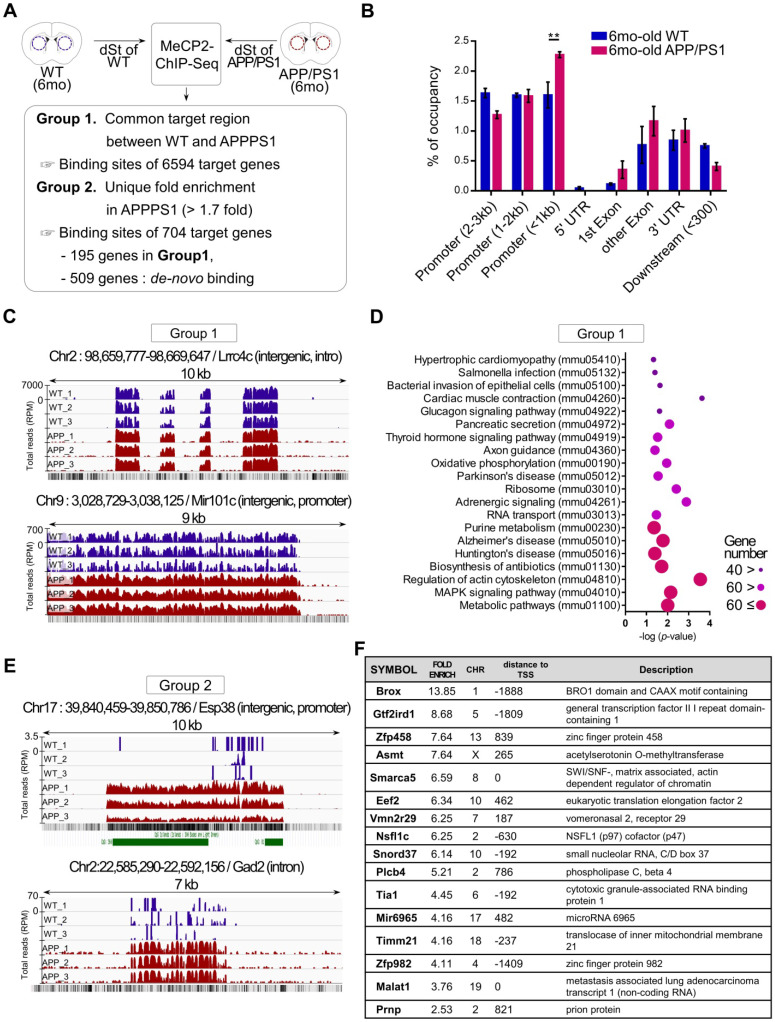
Figure 2.
MeCP2-ChIP-seq analysis reveals altered binding patterns of MeCP2 upon several target genes involved in the pathway of AD. (A) Flowchart showing the schematics of MeCP2-ChIP-seq analysis and the selection criteria for group1 and group2 that resulted from ChiP-seq analysis. (B) Bar graphs show the coverage of bound regions of MeCP2 within WT control and APP/PS1 mice. Overall trends showed an increased binding pattern of MeCP2 in APP/PS1 mice, and the proximal promoter region (< 1kb) showed increased MeCP2 occupancy in the APP/PS1 (mean ± SEM, WT n = 3; APP/PS1 n = 3; ** P < 0.01). (C) Representative images of IGV comparison analysis from group1. WT (dark blue) peaks and APP/PS1 (red) peaks each represent an accumulation of read counts of the ChIPed-DNA from the selected region. (D) KEGG pathway analysis of group1 showed that the MeCP2 occupancy on the genome was involved in several biological pathways including the major neurodegenerative pathways (AD, PD, HD) and cytoskeleton regulation. (E) Representative images of IGV comparison analysis of group2. WT (dark blue) peaks and APP/PS1 (red) peaks each represent an accumulation of read counts of the ChIPed-DNA from the selected region. Green boxes indicate CpG island regions detected in the UCSC genome browser (RPM: reads per million). (F) Table of the MeCP2 major binding sites to the target genes from group2, which shows the top 16 genes in descending order of fold-enrichment along with additional information (chromosome number, distance to transcription start site, brief description of the target gene).

