Abstract
Background and Objectives
To determine the effects of dimethyl fumarate (DMF) and glatiramer acetate on iron content in chronic active lesions in patients with multiple sclerosis (MS) and in human microglia in vitro.
Methods
This was a retrospective observational study of 34 patients with relapsing-remitting MS and clinically isolated syndrome treated with DMF or glatiramer acetate. Patients had lesions with hyperintense rims on quantitative susceptibility mapping, were treated with DMF or glatiramer acetate (GA), and had a minimum of 2 on-treatment scans. Changes in susceptibility in rim lesions were compared among treatment groups in a linear mixed effects model. In a separate in vitro study, induced pluripotent stem cell–derived human microglia were treated with DMF or GA, and treatment-induced changes in iron content and activation state of microglia were compared.
Results
Rim lesions in patients treated with DMF had on average a 2.77-unit reduction in susceptibility per year over rim lesions in patients treated with GA (bootstrapped 95% CI −5.87 to −0.01), holding all other variables constant. Moreover, DMF but not GA reduced inflammatory activation and concomitantly iron content in human microglia in vitro.
Discussion
Together, our data indicate that DMF-induced reduction of susceptibility in MS lesions is associated with a decreased activation state in microglial cells. We have demonstrated that a specific disease modifying therapy, DMF, decreases glial activity in chronic active lesions. Susceptibility changes in rim lesions provide an in vivo biomarker for the effect of DMF on microglial activity.
Classification of Evidence
This study provided Class III evidence that DMF is superior to GA in the presence of iron as a marker of inflammation as measured by MRI quantitative susceptibility mapping.
Dimethyl fumarate (DMF) is a first-line treatment for multiple sclerosis (MS) that reduces the relapse rate significantly in patients with relapsing-remitting MS (RRMS).1 Similar to other MS treatments, DMF has been shown to affect T-cell composition and reduce levels of proinflammatory T cells and their secretion of proinflammatory cytokines.2 DMF and its derivatives are shown to cross the blood-brain barrier suggesting potential for direct effects on the CNS.3 Furthermore, DMF has been implicated in multiple mechanisms of innate immune modulation.4 Chronic active lesions demonstrate persistent inflammatory activity at the lesion rim and have been associated with continued tissue damage and disease progression.5-7 The effect of disease-modifying therapies for MS on glial activation in chronic active lesions has not yet been elucidated.
Inflammation in chronic active lesions is associated with an accumulation of iron in activated microglia and macrophages, which corresponds to a paramagnetic rim on gradient echo imaging.8 This iron content can be quantified in vivo with quantitative susceptibility mapping (QSM), and multiple studies have demonstrated that hyperintense rims on QSM are associated with chronic active MS lesions.9-11 Thus, by using iron as a biomarker for microglial inflammatory activity, QSM can be used to determine whether disease-modifying treatments reduce microglial activation in chronic active lesions.
In this study, we aimed to determine whether DMF reduces microglial activation and whether QSM can capture this treatment effect in chronic active lesions of patients with MS. To do this, we examined the in vivo association of treatment with DMF on longitudinal innate immune activity in chronic active MS lesions, as measured by QSM, in comparison with glatiramer acetate (GA). Furthermore, we performed an in vitro study to demonstrate the impact of DMF on iron content and microglial activation.
Methods
Patient Cohort
This is a retrospective observational study designed to evaluate the effect of DMF vs GA treatment on the change in longitudinal susceptibility within QSM rim lesions. Patient data were collected between September 2011 and September 2020 at the Weill Cornell MS Center. GA was selected as a comparator because during the early stages of data collection, this therapy was a commonly prescribed first-line treatment. Inclusion criteria for this study were (1) the diagnosis of clinically isolated syndrome (CIS) or RRMS meeting the 2010 revised McDonald criteria12; (2) patients currently participating in a clinical and MRI MS research repository and ≥18 years of age; (3) subjects starting treatment with either GA or DMF; (4) subjects had a minimum of 2 on-treatment QSM scans; and (5) patients had at least 1 rim lesion on the baseline MRI. Demographic and clinical data including age, sex, self-reported race and ethnicity, disease subtype, disease duration from initial symptoms, and Expanded Disability Status Scale (EDSS) score were also collected. Clinical data were collected up to discontinuation of treatment or final scan.
MRI Protocol
Longitudinal imaging was performed at 3T using GE Signa HDxt (GE Healthcare, Waukesha, WI) and Siemens Magnetom Skyra (Siemens Medical Solutions, Malvern, PA) MRI scanners. The MRI protocol consisted of sagittal 3-dimensional (3D) T1-weighted (T1w) sequence for anatomic structure, 2-dimensional (2D) T2-weighted (T2w) fast spin-echo, and 3D T2w fluid-attenuated inversion recovery (FLAIR) sequences for lesion detection, gadolinium-enhanced 3D T1w sequence for acute lesion identification, and axial 3D multi-echo GRE sequence for QSM. Below is a detailed description of the imaging protocols.
The Siemens scanning protocol consisted of the following sequences: (1) 3D sagittal T1w MPRAGE: repetition time (TR)/echo time (TE)/inversion time (TI) = 2,300/2.3/900 milliseconds, flip angle (FA) = 8°, GRAPPA parallel imaging factor (R) = 2, and voxel size = 1.0 × 1.0 × 1.0 mm3; (2) 2D axial T2w turbo spin-echo: TR/TE = 5,840/93 milliseconds, FA = 90°, turbo factor = 18, R = 2, number of signal averages = 2, and voxel size = 0.5 × 0.5 × 3 mm3; and (3) 3D sagittal fat-saturated T2w FLAIR SPACE: TR/TE/TI = 8,500/391/2,500 milliseconds, FA = 90°, turbo factor = 278, R = 4, and voxel size = 1.0 × 1.0 × 1.0 mm3.
The GE scanning protocol consisted of the following sequences: (1) 3D sagittal T1w BRAVO: TR/TE/TI = 8.8/3.4/450 milliseconds, FA = 15°, voxel size = 1.2 × 1.2 × 1.2 mm3, and ASSET parallel imaging acceleration factor (R) = 1.5; (2) 2D axial T2w fast spin-echo: TR/TE = 5,267/86 milliseconds, FA = 90°, echo train length (ETL) = 100, number of excitations = 2, and voxel size = 0.6 × 0.9 × 3.0 mm3; and (3) 3D sagittal T2w FLAIR CUBE: TR/TE/TI = 5,000/139/1,577 milliseconds, FA = 90°, ETL = 162, R = 1.6, and voxel size = 1.2 × 1.2 × 1.2 mm3.
Both scanners had similar parameters for the axial 3D multi-echo GRE sequence for QSM: axial field of view = 24 cm, TR/TE1/ΔTE = 48.0/6.3/4.1 milliseconds, number of TEs = 10, FA = 15°, R = 2, voxel size = 0.75 × 0.93 × 3 mm3, and scan time = 4.2 minutes. The harmonized QSM imaging protocol was demonstrated to have high reproducibility across different scanner vendors.13 QSM was reconstructed from complex GRE images using a fully automated Morphology Enabled Dipole Inversion algorithm zero referenced to the CSF across the entire brain (MEDI + 0).14 All conventional (T1w, T1w + Gd, T2w, T2w FLAIR) and QSM images were coregistered to the baseline GRE echo-combined magnitude image using the FMRIB's Linear Image Registration Tool algorithm.
Lesion Identification and Susceptibility Analysis
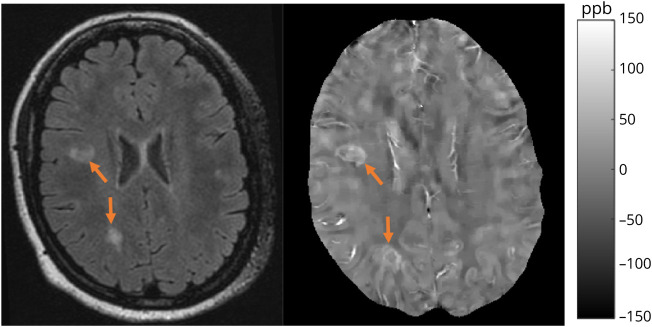
Lesions were first segmented on FLAIR images obtained at the baseline using the automated Lesion Prediction Algorithm in the LST toolbox version 3.0.0 (statisticalmodelling.de/lst.html), followed by manual editing and creation of individual lesion labels, which were then coregistered to QSM. Two independent reviewers classified lesions on baseline QSM as having hyperintense rim appearance. Acute enhancing lesions on T1w + Gd images were excluded from analysis. Both complete and partial rims were included in the rim category. In the case of disagreement, a third reviewer was called on to determine the lesion rim status. Figure 1 shows an example of chronic active rim lesions on QSM. The mean QSM value was recorded for each lesion on the baseline and coregistered follow-up QSM images.
Figure 1. Example of Rim Lesions.
Patient example of chronic active, rim lesions shown on FLAIR (left) and QSM (right). Orange arrows indicate the location of lesions, and images are coregistered. Scale bar indicates range of QSM intensity. FLAIR = fluid-attenuated inversion recovery; QSM = quantitative susceptibility mapping.
Human Microglial Cell Cultures
Induced pluripotent stem cells (iPSCs) derived from skin biopsies from a total of 6 consented donors with MS were differentiated into microglia.15 Briefly, iPSCs were cultured on Matrigel-coated plates in mTeSR1 medium supplemented with Y-27632 (ROCK inhibitor) until 50%–60% confluency. The culture medium was switched to STEMdiff Microglia Differentiation and Maturation medium (Stem Cell Technologies, Vancouver, Canada). After 4 days, the medium was switched to StemPro-34 supplemented with 2 mM Glutamax, 25 ng/mL bFGF, 100 ng/mL stem cell factor (SCF), and 80 ng/mL vascular endothelial growth factor. After 2 days, the medium was switched to StemPro-34 supplemented with 2 mM Glutamax, 50 ng/mL SCF, 50 ng/mL interleukin (IL)-3, 5 ng/mL thyroid peroxidase, 50 ng/ml macrophage colony-stimulating factor, and 50 ng/mL Flt-3. After 14 days, floating cells were collected, and immature microglia progenitors were purified with anti-CD14 coupled magnetic beads (Miltenyi, Bergisch Gladbach, Germany). Purified progenitors were differentiated into microglia by culturing with RPMI-1640 supplemented with 2 mM Glutamax, 10 ng/mL granulocyte-macrophage colony-stimulating factor and 100 ng/mL IL-34 and medium exchange every other day for 14 days. iPSC-derived microglia were polarized toward an M1 phenotype by incubation with lipopolysaccharide (1 mg/mL) and interferon γ (100 U/mL) or an M2 phenotype with IL-4 (20 ng/mL) for 3 days.16 To quantify iron uptake, microglia were cultured with Hanks Balanced Salt Solution (HBSS) containing 0.5 μM iron(III)sulfate and 55Fe (1 μCi, ferric chloride in 0.5 M HCl; PerkinElmer) at a 100:1 for 8 hours at 37°C and subsequently treated with DMF or GA for 24 hours. Cells were transferred onto ice, washed twice with ice-cold HBSS, and lysed with 0.1 N NaOH. [55Fe] radioactivity was measured using a scintillation counter, and counts were normalized to total protein level per sample.16
In separate studies, total RNA was extracted from iPSC-derived microglial cells using the miRNeasy Mini Kit (Qiagen, Hilden, Germany). After reverse transcription (TaqMan Reverse Transcription Reagents; Applied Biosystems, Waltham, MA), gene expression of IL-1β, IL-6, tumor necrosis factor (TNF), CD38, and NOS2 was performed using TaqMan gene expression assays (Hs99999029_m1 [IL-1β], Hs00174131_m1 [IL-6], Hs00174128_m1 [TNF], Hs01120071_m1 [CD38], and Hs01075529_m1 [NOS2]; Thermo Fisher, Waltham, MA) according to the manufacturer's instructions. Quantitative real-time PCR was run on a StepOne Real-time PCR system (Life Technologies, Carlsbad, CA) and data were analyzed with the ΔΔCT method with normalization of the raw data to the HPRT housekeeping gene.
Statistical Analysis
All statistical analysis was performed using the R programming language, version 4.04. Differences in patient characteristics between the 2 groups were tested using a t test for continuous variables and a χ2 test with continuity correction for categorical variables. A linear mixed effect model was used to test for differences in EDSS scores over time. We analyzed the longitudinal susceptibility change of rim lesions on QSM with the following considerations: a) time of treatment initiation with either DMF or GA as study baseline and b) censoring patients when they switched treatment, were lost to follow-up, or for administrative censoring. A linear mixed effect model was used to model susceptibility over time. In the model, susceptibility was regressed on time since baseline (start of treatment) and the interaction between treatment on DMF and time. We are interested in this interaction term, which explores whether treatment with DMF modifies the linear time trend in susceptibility. Additional covariates that were adjusted for in the model included: log-lesion-volume on QSM, sex, race (an indicator of being Caucasian), disease subtype, patient age, disease duration and EDSS. A random intercept for patient and a nested random intercept for lesion within patient were included to account for correlation in the data. As the follow-up times for the 2 treatment groups were different (Table 1), we used inverse probability of censor weighting17 to account for this difference. To determine the weights for the model, a survival model, at the patient level for time to censoring, was fit with treatment, sex, race, disease subtype, age, disease duration, and EDSS score. The probability of being censored at each time of observation for a patient was calculated, and observations were inversely weighted by this probability in the linear mixed effects model. Multicollinearity was checked in the linear mixed effects model and was not found. CIs were calculated using 1,000 nonparametric bootstrap samples on the patient level over the entire procedure to account for uncertainty in both the survival and linear mixed effects model.
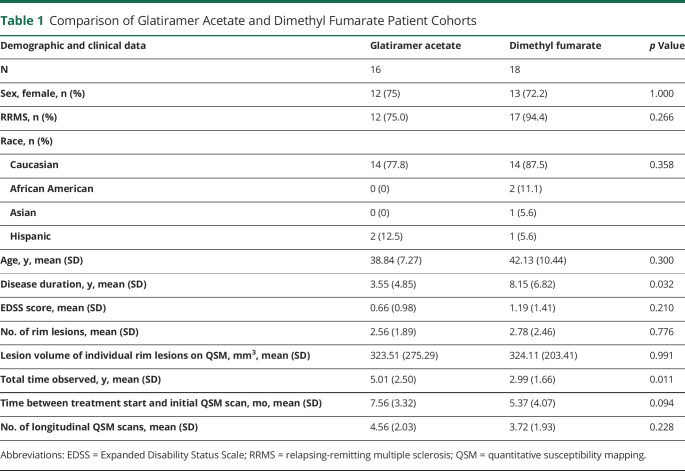
Table 1.
Comparison of Glatiramer Acetate and Dimethyl Fumarate Patient Cohorts
For the in vitro analysis, data were represented as mean ± SD from 3 independent experiments. Group comparisons of microglial cultures were analyzed by 1-way analysis of variance followed by the Tukey-Kramer multiple comparison test (*p < 0.05, **p < 0.01, ***p < 0.001, and ****p < 0.0001).
Standard Protocol Approvals, Registrations, and Patient Consents
The study was approved by an ethical standards committee on human subject research at Weill Cornell Medicine (approval no. 0711009544). In accordance with the Declaration of Helsinki, written informed consent was obtained from all study participants.
Data Availability
All data associated with this study are present in the article. Anonymized data and codes are available from the corresponding author on reasonable request from any qualified investigator. All models were created using publicly available packages and functions in the R programming language.
Results
Patient Cohort
Thirty-four patients were considered for this analysis, with 25 women and 9 men (Table 1). The mean age was 40.6 ± 9.1 years. Five patients had CIS, and 29 had RRMS with a median EDSS score of 0 (interquartile range = 2). Eighteen patients were treated with DMF, and 16 were treated with GA. Within the GA patient cohort, 41 rim lesions were identified, and within the DMF patient cohort, 50 rim lesions were identified. The number of rim lesions per patient ranged from 1 to 8, and the average number per patient was similar between treatment cohorts (p = 0.776). The mean overall time from treatment start to first QSM scan was 6.4 ± 3.8 months, which was also similar among the 2 groups (p = 0.094). In both groups, the EDSS score slightly increased over time (p = 0.0155), but no difference between groups (p = 0.110). Significant differences were found between the 2 treatment groups for disease duration (p = 0.032) and follow-up time (p = 0.011), but not in the number of follow-up scans (p = 0.252).
Longitudinal Lesion Quantitative Susceptibility Analysis
In an inverse probability of censor weighted linear mixed effects model, we compared the change in susceptibility in rim lesions among the 2 treatment groups (Table 2). A linear smooth of the lesion data among the 2 treatment groups is shown in Figure 2. The raw lesion data can be seen in eFigure 1 (links.lww.com/NXI/A689). There was a significant reduction in susceptibility over time in DMF-treated patients compared with those treated with GA. The coefficient for time was found to be statistically significant, indicating that in the GA treatment group, rim lesions, on average, demonstrated a 2.18-unit decrease in susceptibility per year (95% CI −2.88 to −1.03), holding other variables constant. The coefficient of interest in this model was statistically significant, indicating that rim lesions in patients on DMF decreased by an additional 2.77 units in susceptibility per year above that observed in GA-treated patients (95% CI −5.87 to −0.01), holding other variables constant. This represents a 2.27-fold greater rate of reduction with DMF treatment compared with GA. Of note, treatment with DMF, log lesion volume, sex, and disease duration were also found to be statistically significant.
Table 2.
Point Estimates and Bootstrapped 95% CIs for the Coefficients From the Model
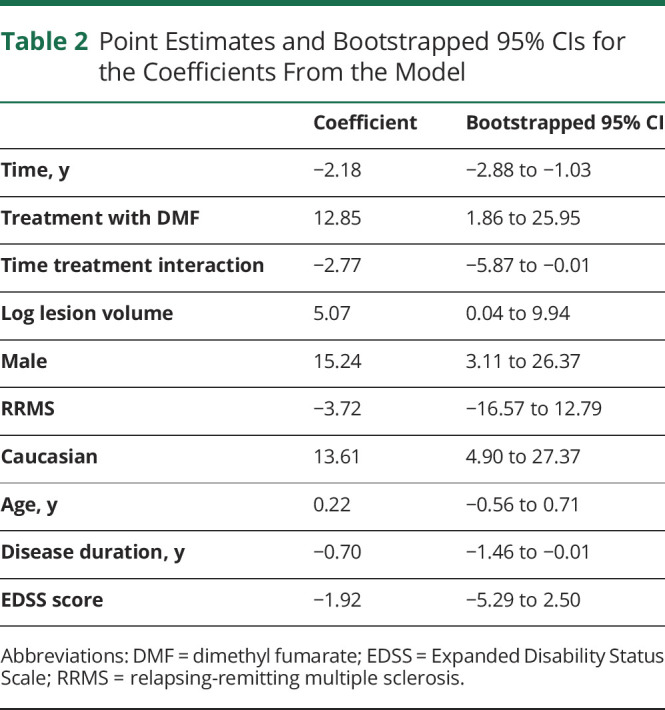
Figure 2. Comparison of Longitudinal Rim Lesion Data Among Treatment Groups.
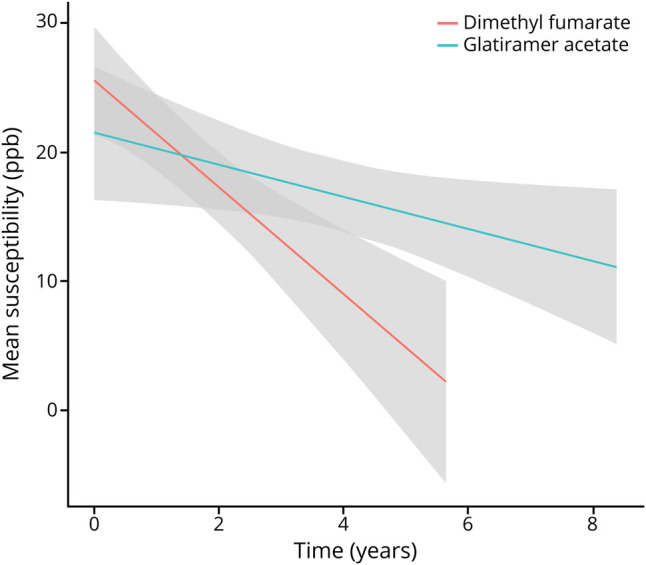
Smoothed longitudinal change in lesion susceptibility, as measured on quantitative susceptibility mapping, in the dimethyl fumarate (red) and glatiramer acetate (teal) groups. A linear smoother has been fit to each group with a 95% CI. The CIs do not account for the correlation of the data and are provided to visualize the general trend in the data.
Human Microglial Cell Cultures
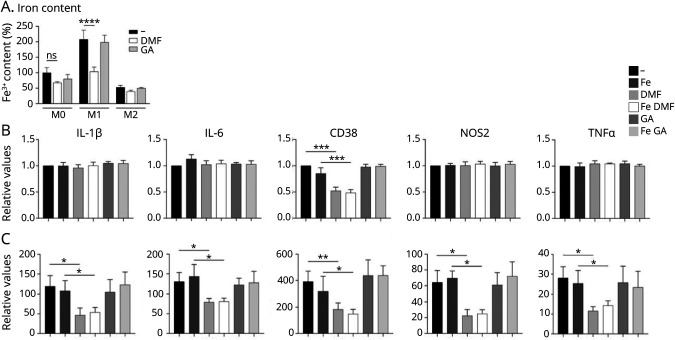
As previously demonstrated in macrophages,16 the polarization state of microglia determines the degree of iron uptake and was most pronounced with M1 polarization and the least pronounced with M2 polarization. DMF significantly reduced the iron content in M1-polarized but not M0- or M2-polarized microglia. GA had no effect on iron content in either polarization state. We then determined the impact of DMF and GA treatment on proinflammatory marker expression in M0- and M1-polarized macrophages incubated with and without iron (Figure 3A). As expected, expression of proinflammatory genes (IL-1β, IL-6, CD38, NOS2, and TNF) was minor in unpolarized microglia, but substantially upregulated in M1-polarized microglia (Figure 3, B and C). Of note, iron had no effect on gene expression in unpolarized or polarized microglia. Moreover, in unpolarized microglia, treatment with DMF and GA had no effect on gene expression except on expression of CD38, which was reduced substantially by DMF. In M1-polarized microglia, DMF but not GA inhibited expression of all proinflammatory markers, irrespective of iron content.
Figure 3. Changes in Iron Content and Activation State of Human Microglial Cell Cultures.
(A) Iron content in human iPSC-derived, M0-, M1-, and M2-polarized microglial cells was quantified with intracellular radioactive 55Fe after treatment with/without DMF and GA. Quantification of mRNA expression of IL-1β, IL-6, TNF, CD38, and NOS2 in (B) unpolarized and (C) M1-polarized microglia, incubated with and without FeCl3 and treated with DMF or GA. Data are normalized to the untreated, unpolarized microglia and represent mean ± SD. *p < 0.05, **p < 0.01, ***p < 0.005, and ****p < 0.0001; ns = nonsignificant. DMF = dimethyl fumarate; GA = glatiramer acetate; IL = interleukin; iPSC = induced pluripotent stem cell; mRNA = messenger RNA; TNF = tumor necrosis factor.
Discussion
Previous studies have provided evidence in vitro that DMF can modulate CNS innate immune activity. In this study, we utilize imaging to demonstrate this effect in vivo.
Here, we bridge this gap using QSM to quantify lesion-based iron content in DMF-treated patients with MS. Our results show that DMF reduces lesion susceptibility at a 2.3-fold greater rate than GA, suggesting that it diminishes lesion-based iron content. We further demonstrated that DMF, but not GA, directly ameliorates the proinflammatory activation state and reduces iron content in human microglia. Our in vitro findings provide a basis for interpreting the susceptibility changes in DMF-treated patients, suggesting that the reduction in susceptibility is consistent with a reduction in microglial activation.
We and others have previously shown that iron handling by monocyte-derived macrophages depends on their polarization states.16,18 Here, we demonstrated that iron uptake is increased in M1-polarized compared with M0- and M2-polarized human iPSC-derived microglia and that treatment with DMF reduced proinflammatory activation in M1-polarized microglia and increases iron release. These results indicate that iron content can serve as a surrogate marker for proinflammatory microglial activation. However, these findings cannot be directly extrapolated to MS lesions. Recently, several distinct microglial phenotypes have been identified in MS lesions with single-cell RNA sequencing, that did not follow the M1/M2 marker dichotomy,19 confirming that the M1/M2 polarization paradigm is an in vitro concept that has no bearing on microglial phenotypes in vivo.20 One subpopulation of microglia, characterized by expression of cathepsin D, was associated with high iron content, based on the expression of the ferritin gene,21 and localized to the lesion rim (unpublished results). This suggests that iron within MS lesion rims is present in a MS-specific microglial phenotype and wherein complement component 1q has recently been identified as a possible mediator of this glial cell activity.22 In contrast, 18-kDa translocator protein, a widely used PET imaging marker for microglial activation, is likely to reflect cell density rather than microglial activation.23
Several preclinical studies have demonstrated a directed anti-inflammatory benefit of DMF on immune cells, including microglia.24-28 Given that the majority of DMF is metabolized quickly into its primary metabolite, monomethyl fumarate (MMF) and serum levels of DMF are essentially undetectable,3 it is unclear whether CNS cells are exposed to DMF. Moreover, several studies found that DMF but not MMF has anti-inflammatory effects4,29,30; however, these results contrast with other studies that demonstrate a robust MMF effect on myeloid and lymphocytes cells.31-33 Furthermore, low levels of DMF may survive absorption after oral dosing, accumulate within the CNS, and thus exert a therapeutic impact on microglial cells.4 Several immune-modulating mechanisms have been attributed to GA, including induction of tolerance to myelin antigens, expansion of regulatory T-cell populations, and modification of antigen-presenting cell function such as increase in phagocytic activity34 and reduced expression of several activation markers.35 In contrast, we did not observe changes in a selected panel of proinflammatory markers in our cell culture model.
The quantitative nature of QSM provides a unique opportunity to capture temporal changes of rim lesions, as their susceptibility remains high even after years of initial detection and slowly decays over time.10 Our group has identified a specific pattern of change in lesion susceptibility, with a sharp rise after gadolinium enhancement and an eventual decay with increasing lesion chronicity. This observation is consistent with retention of iron by microglia in chronic active lesions and the subsequent loss of iron during a transition into a chronic inactive state.7 Importantly, our work indicates that DMF influences the longitudinal trajectory of iron within rim lesions. However, the age and inflammatory stage of the rim lesions are unknown in this data set, which limits the interpretation. Future work is planned to address this limitation and provide an estimated age to individual chronic active MS lesions.36 We selected GA as a comparator because our retrospective data collection started in 2011 when GA was a common first-line therapy. The slight decrease in susceptibility observed in rim lesions of GA-treated cohort may represent a minor effect of GA and/or the natural decay of susceptibility.10,37 Future work is planned to compare the influence of DMF on chronic active lesions to other current disease-modifying therapies. Importantly, little is understood regarding the pathologic consequence of iron release from chronic active lesions (i.e., how iron is recycled), and consequently, it remains unclear whether targeting these lesions will have a positive impact on disease progression. Thus, an essential next step is to establish the association between therapeutically targeting rim lesions and the beneficial effect on objective measures of disease progression.
The in vivo results should be interpreted as an association, as the data are observational and statistical techniques from causal inference were not used due to the limited size and retrospective nature of the data set. Future work involves using multicenter studies to increase our sample size and allow for causal techniques and interpretations to be applied. Notably, patients in the DMF group had shorter follow-up time and fewer scans than patients in the GA group. This can be attributed to DMF being a newer MS treatment than GA. To account for this, we used inverse probability of censor weighting in our model. In addition, patients in the DMF group had longer disease duration. This can be attributed to patients being switched to DMF later in their disease course after failure of other treatments. We accounted for disease duration in the model, but further investigation into the impact of disease duration is warranted. Finally, given that these results were based on retrospective observational data, the temporal relationship of starting therapy and QSM MRI varied among patients; for this reason, the statistical analysis considered start of treatment as the baseline. This limits our ability to capture changes soon after treatment initiation; however, importantly, this timing was similar among treatment groups. Although limited, these observations can inform the next stage of clinical investigation, which would include a prospective, randomized clinical trial.
In conclusion, our study demonstrates that a specific disease-modifying treatment, DMF, reduces rim lesion susceptibility and therefore decreases microglial activity in chronic active lesions, a pathologic feature associated with MS progression.5,38,39 Moreover, we demonstrate the use of QSM MRI as an imaging modality to monitor this therapeutic response.
Acknowledgment
The authors thank Dr. Weiyuan Huang for her contribution to the MRI analysis. The authors also acknowledge the help of Drs. Timothy Vartanian, Ulrike Kaunzner, Nancy Nealon, and Jai Perumal at the Weill Cornell Multiple Sclerosis Center, Department of Neurology, New York, NY. Finally, the authors thank the patients at the Weill Cornell MS center.
Glossary
- 2D
2 dimensional
- 3D
3 dimensional
- CIS
clinically isolated syndrome
- DMF
dimethyl fumarate
- EDSS
Expanded Disability Status Scale
- ETL
echo train length
- FA
flip angle
- FLAIR
fluid-attenuated inversion recovery
- GA
glatiramer acetate
- HBSS
Hanks Balanced Salt Solution
- IL
interleukin
- iPSC
induced pluripotent stem cell
- MMF
monomethyl fumarate
- MS
multiple sclerosis
- QSM
quantitative susceptibility mapping
- RRMS
relapsing-remitting MS
- SCF
stem cell factor
- T1w
T1 weighted
- T2w
T2 weighted
- TE
echo time
- TI
inversion time
- TNF
tumor necrosis factor
- TR
repetition time
Appendix. Authors

Contributor Information
Nicole Zinger, Email: nicolezinger4@gmail.com.
Gerald Ponath, Email: ponath@tolerogenixx.com.
Elizabeth Sweeney, Email: ems4003@med.cornell.edu.
Thanh D. Nguyen, Email: tdn2001@med.cornell.edu.
Chih Hung Lo, Email: chihhung.lo@yale.edu.
Ivan Diaz, Email: ild2005@med.cornell.edu.
Alexey Dimov, Email: ald2031@med.cornell.edu.
Leilei Teng, Email: leilei.teng@greenwichhospital.org.
Lily Zexter, Email: lily.zexter@downstate.edu.
Joseph Comunale, Email: joc2018@med.cornell.edu.
Yi Wang, Email: yiwang@med.cornell.edu.
David Pitt, Email: david.pitt@yale.edu.
Study Funding
This study was supported by NINDS/NIH RO1 NS102267, an investigator-initiated Clinical Trial/US-BGT-13-10516 (Biogen), BI-2007-36725 (NMSS), and by grant number UL1 TR 002384 from the National Center for Advancing Translational Sciences (NCATS) of the NIH.
Disclosure
N. Zinger, G. Ponath, E. Sweeney, T.D. Nguyen, C.H. Lo, I. Diaz, A. Dimov, L. Teng, L. Zexter, and J. Comunale report no disclosures relevant to the manuscript. Y. Wang owns equity of Medimagemetric LLC. D. Pitt received a grant from Biogen (investigator-initiated Clinical Trial/US-BGT-13-10516). S.A. Gauthier reported receiving grants from Genentech, Sanofi-Genzyme, and Mallinckrodt, outside the submitted work. Go to Neurology.org/NN for full disclosures.
References
- 1.Gold R, Kappos L, Arnold DL, et al. Placebo-controlled phase 3 study of oral BG-12 for relapsing multiple sclerosis. N Engl J Med. 2012;367(12):1098-1107. [DOI] [PubMed] [Google Scholar]
- 2.Diebold M, Sievers C, Bantug G, et al. Dimethyl fumarate influences innate and adaptive immunity in multiple sclerosis. J Autoimmun. 2018;86:39-50. [DOI] [PubMed] [Google Scholar]
- 3.Brennan MS, Patel H, Allaire N, et al. Pharmacodynamics of dimethyl fumarate are tissue specific and involve NRF2-dependent and -independent mechanisms. Antioxid Redox Signal. 2016;24(18):1058-1071. [DOI] [PubMed] [Google Scholar]
- 4.Peng H, Li H, Sheehy A, Cullen P, Allaire N, Scannevin RH. Dimethyl fumarate alters microglia phenotype and protects neurons against proinflammatory toxic microenvironments. J Neuroimmunol. 2016;299:35-44. [DOI] [PubMed] [Google Scholar]
- 5.Absinta M, Sati P, Masuzzo F, et al. Association of chronic active multiple sclerosis lesions with disability in vivo. JAMA Neurol. 2019;76(12):1474-1483. [DOI] [PMC free article] [PubMed] [Google Scholar]
- 6.Kuhlmann T, Ludwin S, Prat A, Antel J, Bruck W, Lassmann H. An updated histological classification system for multiple sclerosis lesions. Acta Neuropathol. 2017;133(1):13-24. [DOI] [PubMed] [Google Scholar]
- 7.Dal-Bianco A, Grabner G, Kronnerwetter C, et al. Long-term evolution of multiple sclerosis iron rim lesions in 7 T MRI. Brain. 2021;144(3):833-847. [DOI] [PubMed] [Google Scholar]
- 8.Bagnato F, Hametner S, Yao B, et al. Tracking iron in multiple sclerosis: a combined imaging and histopathological study at 7 Tesla. Brain. 2011;134(pt 12):3602-3615. [DOI] [PMC free article] [PubMed] [Google Scholar]
- 9.Kaunzner UW, Kang Y, Zhang S, et al. Quantitative susceptibility mapping identifies inflammation in a subset of chronic multiple sclerosis lesions. Brain. 2019;142(1):133-145. [DOI] [PMC free article] [PubMed] [Google Scholar]
- 10.Zhang S, Nguyen TD, Hurtado Rua SM, et al. Quantitative susceptibility mapping of time-dependent susceptibility changes in multiple sclerosis lesions. AJNR Am J Neuroradiol. 2019;40(6):987-993. [DOI] [PMC free article] [PubMed] [Google Scholar]
- 11.Gillen KM, Mubarak M, Park C, et al. QSM is an imaging biomarker for chronic glial activation in multiple sclerosis lesions. Ann Clin Transl Neurol. 2021;8(4):877-886. [DOI] [PMC free article] [PubMed] [Google Scholar]
- 12.Polman CH, Reingold SC, Banwell B, et al. Diagnostic criteria for multiple sclerosis: 2010 revisions to the McDonald criteria. Ann Neurol. 2011;69(2):292-302. [DOI] [PMC free article] [PubMed] [Google Scholar]
- 13.Deh K, Kawaji K, Bulk M, et al. Multicenter reproducibility of quantitative susceptibility mapping in a gadolinium phantom using MEDI+0 automatic zero referencing. Magn Reson Med. 2019;81(2):1229-1236. [DOI] [PMC free article] [PubMed] [Google Scholar]
- 14.Dimov A, Nguyen T, Spincemaille P, et al. Global cerebrospinal fluid as a zero-reference regularization for brain quantitative susceptibility mapping. J Neuroimaging. 2022;32(1):141-147. [DOI] [PMC free article] [PubMed] [Google Scholar]
- 15.Douvaras P, Sun B, Wang M, et al. Directed differentiation of human pluripotent stem cells to microglia. Stem Cell Rep. 2017;8(6):1516-1524. [DOI] [PMC free article] [PubMed] [Google Scholar]
- 16.Mehta V, Pei W, Yang G, et al. Iron is a sensitive biomarker for inflammation in multiple sclerosis lesions. PLoS One. 2013;8(3):e57573. [DOI] [PMC free article] [PubMed] [Google Scholar]
- 17.Robins JM, Finkelstein DM. Correcting for noncompliance and dependent censoring in an AIDS Clinical Trial with inverse probability of censoring weighted (IPCW) log-rank tests. Biometrics. 2000;56(3):779-788. [DOI] [PubMed] [Google Scholar]
- 18.Corna G, Campana L, Pignatti E, et al. Polarization dictates iron handling by inflammatory and alternatively activated macrophages. Haematologica. 2010;95(11):1814-1822. [DOI] [PMC free article] [PubMed] [Google Scholar]
- 19.Jackle K, Zeis T, Schaeren-Wiemers N, et al. Molecular signature of slowly expanding lesions in progressive multiple sclerosis. Brain. 2020;143(7):2073-2088. [DOI] [PubMed] [Google Scholar]
- 20.O'Loughlin E, Madore C, Lassmann H, Butovsky O. Microglial phenotypes and functions in multiple sclerosis. Cold Spring Harb Perspect Med. 2018;8(2):a028993. [DOI] [PMC free article] [PubMed] [Google Scholar]
- 21.Masuda T, Sankowski R, Staszewski O, et al. Spatial and temporal heterogeneity of mouse and human microglia at single-cell resolution. Nature. 2019;566(7744):388-392. [DOI] [PubMed] [Google Scholar]
- 22.Absinta M, Maric D, Gharagozloo M, et al. A lymphocyte-microglia-astrocyte axis in chronic active multiple sclerosis. Nature. 2021;597(7878):709-714. [DOI] [PMC free article] [PubMed] [Google Scholar]
- 23.Nutma E, Gebro E, Marzin MC, et al. Activated microglia do not increase 18 kDa translocator protein (TSPO) expression in the multiple sclerosis brain. Glia. 2021;69(10):2447-2458. [DOI] [PMC free article] [PubMed] [Google Scholar]
- 24.Wilms H, Sievers J, Rickert U, Rostami-Yazdi M, Mrowietz U, Lucius R. Dimethylfumarate inhibits microglial and astrocytic inflammation by suppressing the synthesis of nitric oxide, IL-1beta, TNF-alpha and IL-6 in an in-vitro model of brain inflammation. J Neuroinflammation. 2010;7:30. [DOI] [PMC free article] [PubMed] [Google Scholar]
- 25.Parodi B, Rossi S, Morando S, et al. Fumarates modulate microglia activation through a novel HCAR2 signaling pathway and rescue synaptic dysregulation in inflamed CNS. Acta Neuropathol. 2015;130(2):279-295. [DOI] [PMC free article] [PubMed] [Google Scholar]
- 26.Schulze-Topphoff U, Varrin-Doyer M, Pekarek K, et al. Dimethyl fumarate treatment induces adaptive and innate immune modulation independent of Nrf2. Proc Natl Acad Sci USA. 2016;113(17):4777-4782. [DOI] [PMC free article] [PubMed] [Google Scholar]
- 27.Gillard GO, Collette B, Anderson J, et al. DMF, but not other fumarates, inhibits NF-kappaB activity in vitro in an Nrf2-independent manner. J Neuroimmunol. 2015;283:74-85. [DOI] [PubMed] [Google Scholar]
- 28.Yadav SK, Soin D, Ito K, Dhib-Jalbut S. Insight into the mechanism of action of dimethyl fumarate in multiple sclerosis. J Mol Med (Berl). 2019;97(4):463-472. [DOI] [PubMed] [Google Scholar]
- 29.Michell-Robinson MA, Moore CS, Healy LM, et al. Effects of fumarates on circulating and CNS myeloid cells in multiple sclerosis. Ann Clin Transl Neurol. 2016;3(1):27-41. [DOI] [PMC free article] [PubMed] [Google Scholar]
- 30.Brennan MS, Matos MF, Li B, et al. Dimethyl fumarate and monoethyl fumarate exhibit differential effects on KEAP1, NRF2 activation, and glutathione depletion in vitro. PLoS One. 2015;10(3):e0120254. [DOI] [PMC free article] [PubMed] [Google Scholar]
- 31.Litjens NH, Rademaker M, Ravensbergen B, Thio HB, van Dissel JT, Nibbering PH. Effects of monomethylfumarate on dendritic cell differentiation. Br J Dermatol. 2006;154(2):211-217. [DOI] [PubMed] [Google Scholar]
- 32.de Jong R, Bezemer AC, Zomerdijk TP, van de Pouw-Kraan T, Ottenhoff TH, Nibbering PH. Selective stimulation of T helper 2 cytokine responses by the anti-psoriasis agent monomethylfumarate. Eur J Immunol. 1996;26(9):2067-2074. [DOI] [PubMed] [Google Scholar]
- 33.Booth L, Cruickshanks N, Tavallai S, et al. Regulation of dimethyl-fumarate toxicity by proteasome inhibitors. Cancer Biol Ther. 2014;15(12):1646-1657. [DOI] [PMC free article] [PubMed] [Google Scholar]
- 34.Pul R, Morbiducci F, Skuljec J, et al. Glatiramer acetate increases phagocytic activity of human monocytes in vitro and in multiple sclerosis patients. PLoS One. 2012;7(12):e51867. [DOI] [PMC free article] [PubMed] [Google Scholar]
- 35.Lalive PH, Neuhaus O, Benkhoucha M, et al. Glatiramer acetate in the treatment of multiple sclerosis: emerging concepts regarding its mechanism of action. CNS Drugs. 2011;25(5):401-414. [DOI] [PMC free article] [PubMed] [Google Scholar]
- 36.Sweeney EM, Nguyen TD, Kuceyeski A, et al. Estimation of multiple sclerosis lesion age on magnetic resonance imaging. Neuroimage. 2021;225:117451. [DOI] [PMC free article] [PubMed] [Google Scholar]
- 37.Chen W, Gauthier SA, Gupta A, et al. Quantitative susceptibility mapping of multiple sclerosis lesions at various ages. Radiology. 2014;271(1):183-192. [DOI] [PMC free article] [PubMed] [Google Scholar]
- 38.Sucksdorff M, Matilainen M, Tuisku J, et al. Brain TSPO-PET predicts later disease progression independent of relapses in multiple sclerosis. Brain. 2020;143(11):3318-3330. [DOI] [PMC free article] [PubMed] [Google Scholar]
- 39.Tozlu C, Jamison K, Nguyen T, et al. Structural disconnectivity from paramagnetic rim lesions is related to disability in multiple sclerosis. Brain Behav. 2021;11(10):e2353. [DOI] [PMC free article] [PubMed] [Google Scholar]
Associated Data
This section collects any data citations, data availability statements, or supplementary materials included in this article.
Data Availability Statement
All data associated with this study are present in the article. Anonymized data and codes are available from the corresponding author on reasonable request from any qualified investigator. All models were created using publicly available packages and functions in the R programming language.


