Abstract
Acute myeloid leukemia (AML) is an aggressive blood cancer with limited effective chemotherapy options and negative patient outcomes. Food-derived molecules such as avocatin B (Avo B), a fatty-acid oxidation (FAO) inhibitor, are promising novel therapeutics. The roots of the Curcuma amada plants have been historically used in traditional medicine, but isolated bioactive compounds have seldom been studied. Here, we report that 2,4,6-trihydroxy-3,5-diprenyldihydrochalcone (M1), a bioactive from C. Amada, possesses novel anticancer activity. This in vitro study investigated the antileukemia properties of M1 and its effects on mitochondrial metabolism. In combination with Avo B, M1 synergistically reduced AML cell line viability and patient-derived clonogenic growth with no effect on normal peripheral blood stem cells. Mechanistically, M1 alone inhibited mitochondria complex I, while the M1/Avo B combination inhibited FAO by 60%, a process essential to the synergy. These results identified a novel food-derived bioactive and its potential as a novel chemotherapeutic for AML.
Introduction
Acute myeloid leukemia (AML) is an aggressive malignancy of the blood and bone marrow. It is characterized by the presence of abnormally differentiated cells of the hematopoietic system in the blood, bone barrow, and other tissues that interfere with and replace normal blood cells.1 Treatment regimens for AML patients have not changed substantially over the last 30 years2 and consist of induction therapy involving cytarabine, a synthetic pyrimidine nucleoside, and an anthracycline (i.e., daunorubicin, idarubicin, or mitoxantrone).1,3−5 Low overall rates of survival and the dose-limiting toxicities associated with these therapies highlight the need for novel therapeutic approaches.
A distinguishing hallmark of cancer cell metabolism is the enhanced uptake and utilization of glucose during aerobic conditions, known as the Warburg effect.6 Rather than oxidative phosphorylation, cancer cell mitochondria predominantly produce energy through increased glycolysis followed by lactic acid fermentation.7 However, leukemia cells have the ability to reduce molecular oxygen, utilizing electrons from other carbon sources beyond pyruvate.8,9 Acetyl-CoA derived from fatty acid oxidation (FAO) powers the TCA cycle and subsequently promotes leukemia survival by supporting mitochondrial oxidative metabolism. Metabolically, FAO allows for continuous production of citrate and reducing equivalents (e.g., NADH and FADH2) in the TCA cycle via the copious production of acetyl CoA, which in turn supports the molecular reduction of oxygen into water.10 Notably, the regeneration of citrate is crucial in the synthesis of lipid membrane components and therefore essential in cellular proliferation.11 This cycle of FAO and fatty acid synthesis antagonizes the oligomerization of pro-apoptotic proteins Bax and Bak, effectively preventing cell death and further promoting leukemia cell survival.8
Food-derived bioactive molecules have shown promise as novel anticancer agents by targeting leukemia cell metabolism. Notably, avocatin B [Avo B; a 1:1 ratio of two 17-carbon polyhydroxylated fatty alcohols: 1,2,4-trihydroxyheptadec-16-ene (avocadene) and 1,2,4- trihydroxyheptadec-16-yne (avocadyne)]; is a bioactive compound found in avocados (Persea americana)12 with activity against tumors of the lung, breast, kidney, and pancreas.13 In leukemia, it synergizes with cytarabine14,15 and imparts selective and potent activity against patient-derived AML cells with no effect on normal hematopoietic cells.12 Mechanistically, Avo B accumulates in mitochondria to inhibit FAO.16 Additionally, no dose-limiting toxicities were noted in a phase I clinical trial where healthy human subjects consumed 50 or 200 mg of Avo B.17 Therefore, Avo B is a novel and promising food-derived bioactive with potent and selective anti-AML activity and demonstrated safety in humans.
Curcuma amada, commonly known as mango ginger, is a rhizomatous plant belonging to the Zingiberaceae family. Extracts of mango ginger have antioxidant and anti-inflammatory properties in acute and chronic mouse models.18,19 In addition, crude C. amada extracted with various solvents showed activity against NCI-H460 (human large cell lung cancer) cells20 and A-549 (human small cell lung carcinoma) cells.21 However, the toxicity of the extract in normal and noncancerous cells was not tested. To better understand the potential bioactive responsible for this activity, column chromatography on a crude chloroform mango ginger extract with noted antimicrobial activity was performed. Liquid chromatography–mass spectrometry identified 2,4,6-trihydroxy-3,5-diprenyldihydrochalcone (further referred to as M1 for simplicity) as a bioactive compound in mango ginger. The antimicrobial activity of M1 was confirmed against MRSA and Escherichia coli; the bioactive had a minimum inhibitory concentrations of 2 μg/mL, similar to that of vancomycin, a last resort antibiotic in most clinical settings.23
In this study, we tested the antileukemia property of M1 alone or in combination with Avo B. Additionally, we tested the effects of these compounds on mitochondrial metabolism to establish the mechanism by which these compounds may exert antileukemia activity.
Results
M1 Has Modest Anti-AML Activity
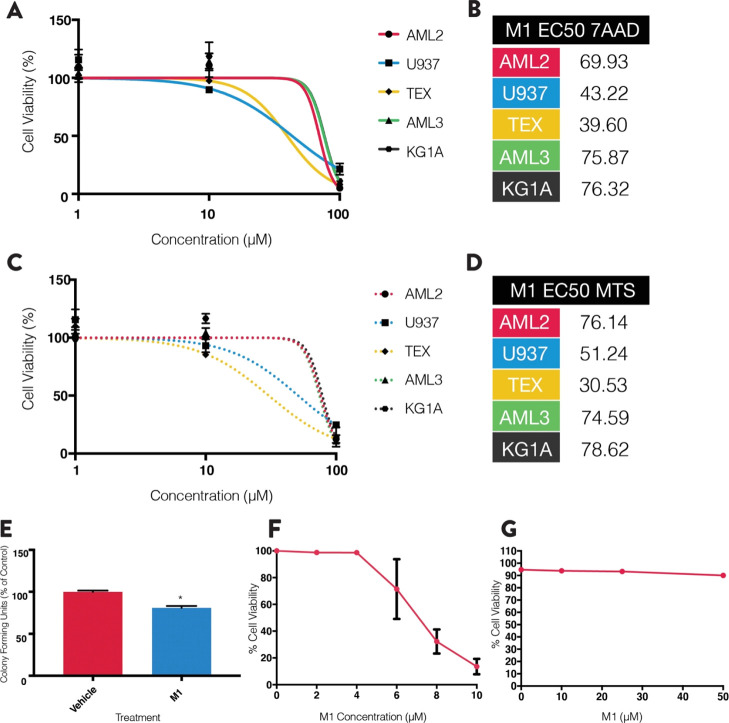
To determine the antileukemic properties of M1, dose response curves were generated using leukemia cell lines (e.g., OCI-AML2, OCI-AML3, KGIA, TEX, and U937 cells). Cell viability was measured after a 72 h incubation period using 7AAD staining (Figure 1A; n = 3) and the 3-(4,5-dimethylthiazol-2-yl)-5-(3-caboxymethoxyphenyl)-2-(4-sulfophenyl)-2H-tetrazolium inner salt (MTS) reduction assay (Figure 1C; n = 3). M1 demonstrated very weak antileukemia properties in all five cell lines tested (EC50 values: 30–80 μM).
Figure 1.
M1 shows antileukemic activity in various cell lines, with toxicity in normal and non-leukemic cell lines. (A) AML cell lines incubated with increasing concentrations of M1 for 72 h and viability was measured by flow cytometry using 7AAD staining. (B) EC50 values calculated from the dose responses in A. Values were the average of the three replicates. (C) AML cell lines incubated with increasing concentrations of M1 for 72 h and viability measured using the MTS reduction assay. (D) EC50 values calculated from the dose responses in C. Values were the average of three replicates. (E) Normal umbilical cord blood-derived cells incubated with 30 μM M1 and colonies counted after 14 days. (F) INS-1 cells incubated with 0–10 μM of M1 and viability measured using 7AAD staining. (G) C2C12 myoblasts incubated with 0–50 μM of M1 and viability measured using 7AAD staining. All experiments were performed three times in triplicate (n = 3), and data are mean ± SD. *p < 0.05, unpaired, two-tailed, Student’s t-test.
To examine selectivity, M1 toxicity was tested in INS-1 (832/13) rat pancreatic β-islet cell lines, C2C12 mouse skeletal myoblasts, and normal umbilical cord blood-derived stem cells (UCBSCs). After 72 h, INS-1 cells, but not C2C12 cells, had lower viability (Figure 1F,G, n = 3 for each). Moreover, using the colony formation assay, M1 at 30 μM (approximately the EC25) reduced UCBSC colonies by approximately 20%. Together, this suggests that M1 imparts toxicity toward normal cells at this dose range.
M1 Synergizes with Avocatin B (Avo B)
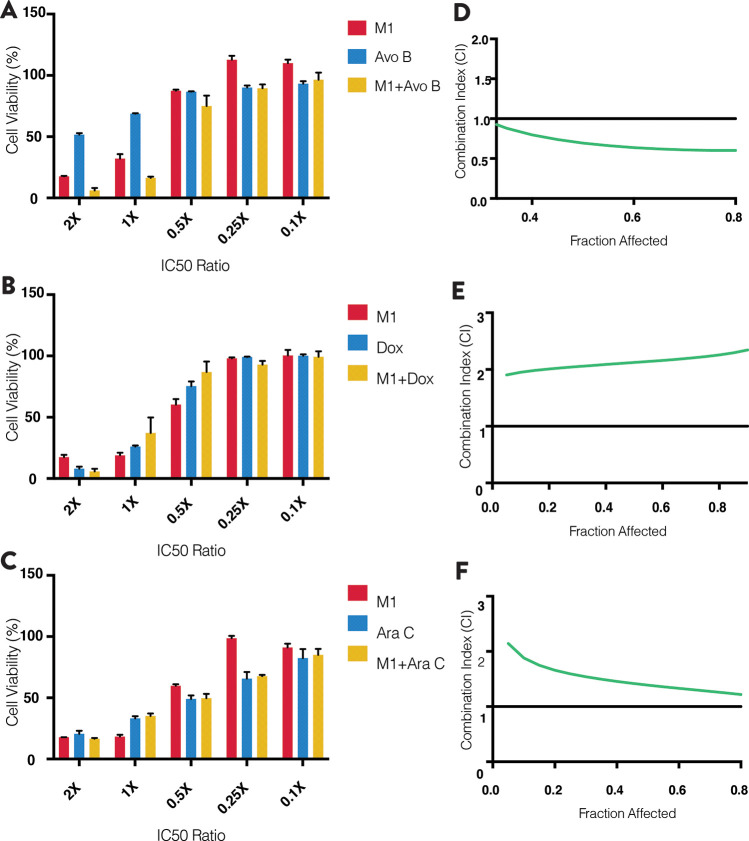
To utilize the potential of M1 and identify its therapeutic window, it was tested in combination with three known antileukemic drugs: Avo B, doxorubicin (Dox), and cytarabine (Ara C) using OCI-AML2, TEX, and U937 cells. Combination index (CI) values were calculated using the Chou-Talalay method, which evaluates whether the combinations are synergistic (CI < 1), antagonistic (CI > 1), or additive (CI = 1).24
At equal molar ratios (Avo B/M1 = 1:10), M1 and AvoB imparted synergistic bioactivity (Figure 2A; n = 3) with CI values of 0.6, 0.65, and 0.8, respectively (Figure 2D; n = 3). In similar experiments but with Dox or Ara C in combination with M1, antagonistic interactions were noted (i.e., CI > 1; Figure 2B,C; n = 3 for each) (Figure 2E,F; n = 3 for each; Figure S1). These trends of synergy and antagonism were seen in all three cell lines.
Figure 2.
M1 synergizes with the mitochondria target drug avocatin B (Avo B). Equal molar concentrations of M1 and Avo B (A), doxorubicin (B), or cytarabine (C) were incubated with OCI-AML2 leukemia cells and cell viability was measured after 72 h by flow cytometry using 7AAD. CI values (D–F), which assess drug-interaction effects, were calculated using the CompuSyn software. CI values of <1, >1, or equal to 1 denote statistical synergy, antagonism, or additivity, respectively. All experiments are n = 3, and data are mean ± SD. Representative figures are shown.
Low Concentrations of M1 and Avo B Synergize to Reduce AML Cell Viability
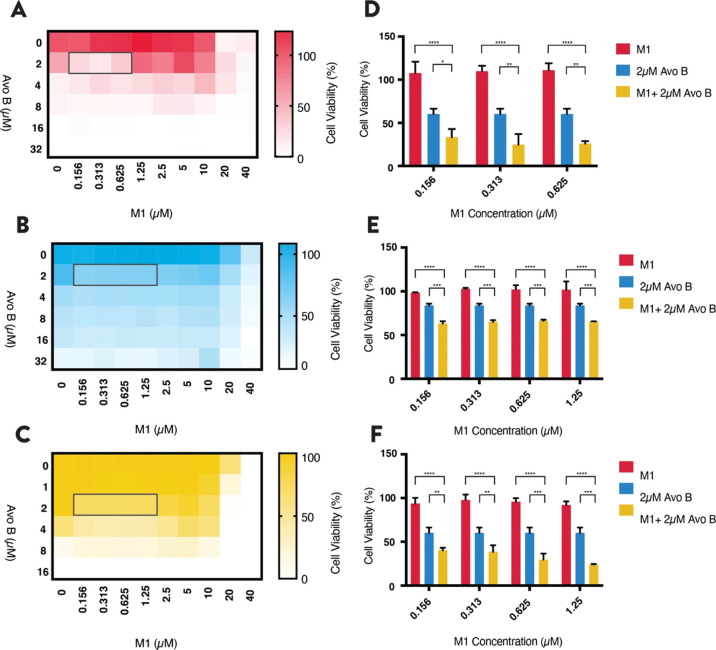
M1 synergizes with Avo B at equal molar ratios of 2× and 1× in leukemia cell lines; however, these M1 concentrations impart toxicity to UCBSCs. Therefore, additional concentration combinations were tested. Heat maps were generated, and viability was measured using the MTS reduction assay and reconfirmed using 7AAD staining. In OCI-AML2 cells, synergy was present at 0.16–0.63 μM M1 and 2.0 μM Avo B (Figure 3A; n = 3). In both TEX and U937 cells, the window was larger ranging between 0.16 and 1.3 μM M1 and 2 μM Avo B (Figure 3B,C; n = 3). The combination lowered cell viability to between 30 and 60% across the window in all three cell lines, a significant lowering from when drugs are individually added [i.e., M1 (p < 0.001); Avo B (p < 0.05) (Figure 3D–F; n = 3 for each)].
Figure 3.
Low concentrations of M1 and Avo B synergize in AML cell lines. Increasing concentrations of M1 and Avo B were co-incubated with OCI-AML2 (A), TEX (B), or U937 (C) cells. Viability was measured after 72 h by flow cytometry using 7AAD. Low concentration synergy windows are highlighted with a gray outline. These “heat map window” concentrations of M1 and Avo B were incubated with OCI-AML2 (D), TEX (E), and U937 (F) cells and viability was measured after 72 h by flow cytometry using 7AAD. All experiments were n = 3. Data are mean ± SD; *p < 0.05, **p < 0.01, ***p < 0.005, ****p < 0.001; one-way ANOVA, Dunnett’s post hoc test.
Low Concentration Combination Window Is Selectively Toxic to AML Cells
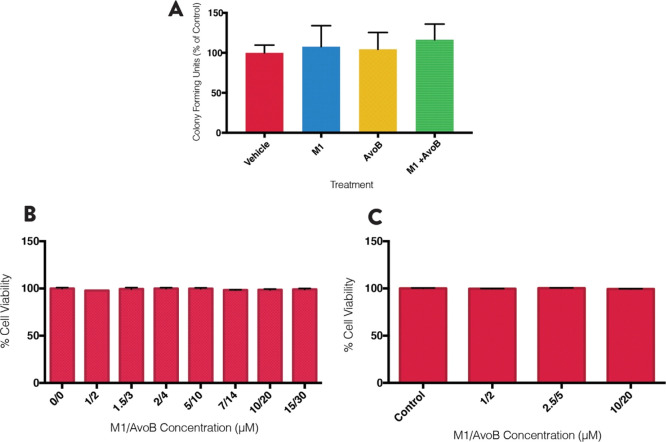
To confirm selective toxicity, the combination was tested on UCBSCs using the colony formation assay. A 1:2 μM ratio of M1/Avo B was used, as these concentrations were in the upper end of the low concentration combination window. The combination and individual drugs had no effect on UCBSC growth (Figure 4A; n = 3). Similarly, in INS-1 and C2C12 noncancer cell lines, several combinations of M1/AvoB had no effect on viability as measured by 7AAD after 72 h (Figure 4B; n = 3; Figure 4C; n = 3). Therefore, the combination (at these concentrations) is not toxic to normal cells but demonstrates selectivity toward leukemia cells.
Figure 4.
Low concentration window of M1 and Avo B is selective toward AML cells. (A) Normal umbilical cord blood-derived cells incubated with 1 μM M1, 2 μM AvoB, the combination, or a vehicle control (DMSO). Colonies were counted after 14 days. INS-1 (B) and C2C12 cells (C) were incubated with combinations of M1 and Avo B for 72 h and viability was measured by flow cytometry using 7AAD. All experiments were n = 3. Data are mean ± SD; *p < 0.05, **p < 0.01, ***p < 0.005, ****p < 0.001; one-way ANOVA, Dunnett’s post hoc test.
Combination of M1 and Avocatin B Inhibits Fatty Acid Oxidation
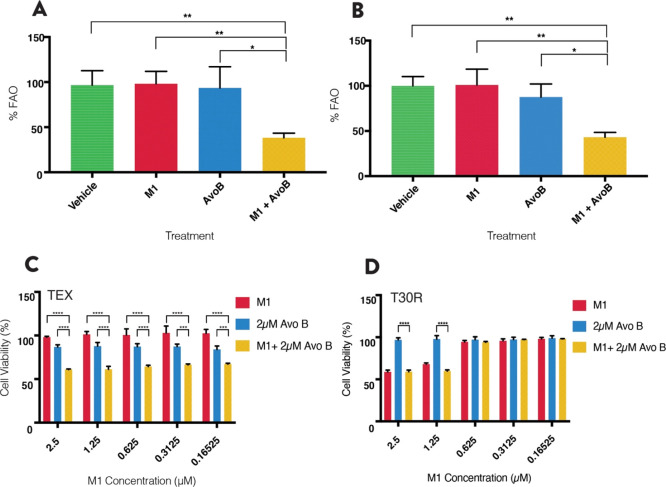
Since Avo B selectively results in leukemia cell death through inhibition of FAO,12 we tested whether the combination would synergistically inhibit FAO. OCI-AML2 and OCI-AML3 cells were treated with M1 (1 μM), Avo B (2 μM), or a combination thereof, and oxygen consumption was measured in permeabilized cells. The oxygen consumption rate (OCR) was measured after treatment with l-palmitoyl carnitine, malate, and ADP. In both cell lines, the combination resulted in a >50% decrease in OCR (61.7 ± 5.1% in OCI-AML2, 56.8 ± 5.3% in OCI-AML3), which was significantly different from M1 (p < 0.01), Avo B (p < 0.05), or the vehicle control (p < 0.01). The individual treatments had minimal-to-no effect on FAO-supported OCR at the concentration and duration tested; however, previous studies have shown FAO inhibitory effects at higher concentrations in these cell lines (Lee et al. 2015) (Figure 5A,B; n = 3).
Figure 5.
Combination of M1 and Avo B inhibit FAO, a process essential to synergy. FAO-supported respiration was measured as the OCR with palmitoylcarnitine and malate in permeabilized OCI-AML2 (A) or OCI-AML3 (B) cells using high-resolution respirometry. Cells were incubated for 1 h with a 1 μM M1, 2 μM AvoB, the combination, or a vehicle control (DMSO). Data are mean ± SD; *p < 0.05, **p < 0.01, ***p < 0.005, ****p < 0.001; one-way ANOVA, Dunnett’s post hoc test. Heat map window concentrations of M1 and Avo B were incubated in TEX (C) or T30R (D) leukemia cell lines, the latter of the two is Avo B-resistant (and subsequently, resistant to Avo B-induced FAO inhibition). Cell viability was measured after 72 h by flow cytometry using 7AAD. All experiments were n = 3. Data are mean ± SD; *p < 0.05, **p < 0.01, ***p < 0.005, ****p < 0.001; one-way ANOVA, Dunnett’s post hoc test.
Fatty Acid Oxidation Is Essential to M1 and Avocatin B Synergy
To understand the role and impact of FAO on the synergy demonstrated by the combination of M1 and Avo B, the low concentration window (expanded to 0.625–2.5 μM of M1) was tested against an Avo B resistant TEX cell line (denoted: T30R). Viability was determined after 72 h using 7AAD staining. As seen previously, synergy was present in TEX cells (Figure 5C; n = 3). However, in T30R cells, where Avo B does not cause cell death, synergy was lost at the low concentration combination window (Figure 5D, n = 3). Since AvoB does not cause FAO inhibition and subsequent cell death in the T30R cell line, the loss of synergy observed with the M1/AvoB combination strongly indicates that FAO inhibition is essential to the synergy mechanism.
M1 Inhibits Complex I of the Electron Transport Chain
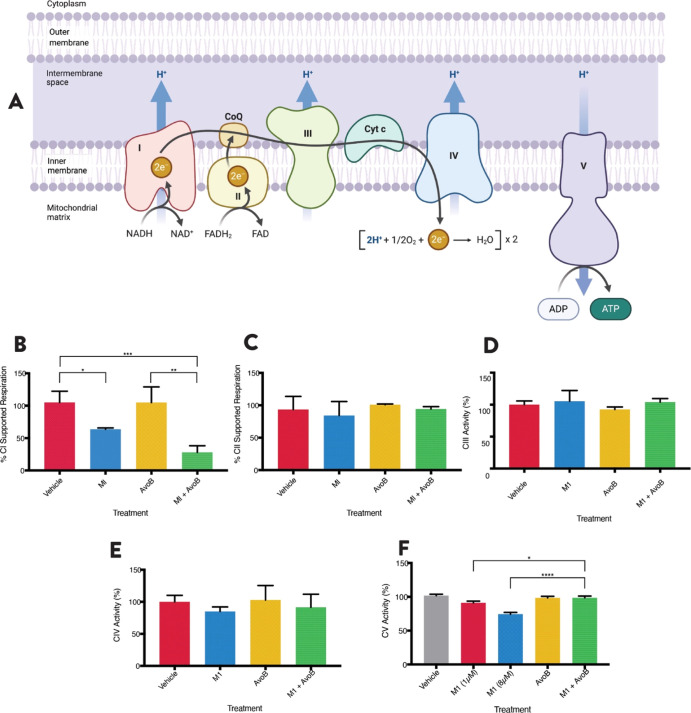
While the combination targets mitochondrial FAO, M1 is still active in the T30R cells, suggesting that its mechanism of activity is different from that of Avo B (Figure 5D). Thus, the effects of M1 and Avo B were further investigated on specific complexes within the mitochondrial electron transport chain (ETC) (Figure 6A). OCI-AML2 cells were treated with M1 (1 μM), Avo B (2 μM), or a combination thereof, and OCR was measured in permeabilized cells. CI-supported respiration was measured after the injection of 5 mM pyruvate, 2 mM malate, and 2.5 mM ADP, whereas CII-supported respiration was measured after the injection of 250 nM rotenone and 10 mM succinate. M1 inhibited CI-supported respiration to 63.7 ± 2.0% of the vehicle control (p < 0.05). Additionally, the M1 + Avo B combination also inhibited CI activity to 28.1 ± 10.1% compared to the vehicle control (p < 0.01); this inhibition was also significant compared to the individual M1 treatment (p < 0.05). Avo B did not inhibit CI activity (Figure 6B; n = 3), which attributes CI-inhibitory activity to the actions of M1. The individual treatments or the combination did not have a significant effect on CII-supported respiration (Figure 6C; n = 3).
Figure 6.
M1 inhibits complex I of the ETC. The activities of the five protein complexes of the ETC (A) were tested. Complex I (B)- and complex II (C)-supported respiration was measured as the OCR with pyruvate and malate (CI) or succinate (CII) in permeabilized OCI-AML2 cells using high-resolution respirometry. Cells were incubated for 1 h with a 1 μM M1, 2 μM AvoB, the combination, or a vehicle control (DMSO). Complex III (D) and complex IV (E) activity was measured as absorbance at 550 nm for 4 min. Complex V activity was measured as absorbance at 340 nm over 3 min (F). Mitochondrial rich lysates were treated with 1 μM M1, 2 μM AvoB, the combination, or a vehicle control (DMSO) for 1 (CIII and CIV) or 3 min (CV). All experiments were n = 3. Data are mean ± SD; *p < 0.05, **p < 0.01, ***p < 0.005, ****p < 0.001; one-way ANOVA, Tukey’s post hoc test.
To elucidate any downstream effects on the ETC, CIII, CIV, and CV activities were also measured. Mitochondrial lysates were prepared from OCI-AML2 cells and treated with 1 μM M1, 2 μM Avo B, or a combination thereof. There were no significant effects on the activity of CIII or CIV by any treatment (Figure 6D,E; n = 3 for each). The combination resulted in a slight inhibition of CV activity, although this reduction was insignificant relative to the vehicle control. At 1 μM concentration, M1 inhibited CV activity to 91.2 ± 2.5% of the vehicle control (p < 0.01). When increasing the concentration beyond the low concentration window to 8 μM, M1 decreases CV activity to 74.4 ± 2.6% compared to the vehicle control (p < 0.001). Avo B exerted no significant effect on CV (Figure 6F; n = 3). With an increasing effect at higher doses, this suggests that M1 has a dose-dependent effect on CV activity.
Discussion
M1, previously identified and tested as an antibiotic, reduced viability of leukemia cell lines with toxicity in normal and non-leukemic cell lines. However, a synergistic, in vitro anti-AML interaction between M1 and Avo B was identified, with a low concentration window between 0.156 and 1.25 μM M1 and 2 μM Avo B that did not impact normal cell viability. Mechanistically, the M1 and Avo B combination inhibited FAO in AML cells and FAO inhibition was necessary for synergy. M1 inhibited CI of the ETC, while demonstrating a dose-dependent inhibition of CV. Together, this highlights a novel and potent anti-AML therapeutic combination.
Beyond C. amada, M1 has only been identified in one other source—Glycyrrhiza pallidiflora.25 M1, a dihydrochalcone, was identified in G. pallidiflora in 1980 but was never tested for bioactivity.25 It was later identified in mango ginger and confirmed to be bactericidal. As C. amada bioactives have seldom been studied, there are no data on M1 concentrations in the mango ginger rhizomes or on the bioavailability of such molecules.
Dihydrochalcones from natural sources have been isolated and identified as having anticancer properties. Phloretin was one of the first dihydrochalcones identified with antileukemia properties. Isolated from Prunus mandshurica (also known as the Manchurian apricot), phloretin induced apoptosis in HL60 cells through the inhibition of protein kinase C.26 Early research also identified three C-benzylated dihydrochalcones from Uvaria acuminata—uvaretin, isouvaretin, and diuvaretin, which demonstrated inhibitory effects against leukemia cell lines. C-Benzylated dihydrochalcones were later determined to arrest the cell cycle at the G1 phase resulting in apoptosis.27 Multiple dihydrochalcones from Empetrum nigrum or black crowberry and Dracaena usambarensis, a tropical African berry, were also shown to reduce leukemia cell viability.28,29 Here, we show that M1 from C. amada imparts impressive antileukemia activity when combined with Avo B, the first reporting of M1 anticancer activity.
M1 inhibited CI of the ETC. CI, an NADH dehydrogenase, catalyzes the electron transfer from NADH to coenzyme Q10 (CoQ10) and translocates protons across the inner mitochondrial membrane. Metformin, a widely prescribed drug to treat type II diabetes, inhibits CI, which subsequently decreases NADH oxidation, reduces the proton gradient across the inner mitochondrial membrane, and decreases OCR in various cell lines.30 While this was first observed in rat hepatocytes, the effect was later observed in various cancer cell lines.31 Additionally, Velez et al. showed that metformin significantly increased triglyceride levels in leukemia cell lines, which promoted a dose-dependent accumulation of neutral lipids.32 The M1/Avo B combination inhibited FAO, while individual M1 or Avo B treatments at equivalent concentrations had no effect. Therefore, it is possible that through the inhibition of complex I, and in combination with Avo B-induced FAO inhibition, M1 causes the accumulation of FFAs, as is the case with metformin. This could further antagonize FAO inhibition and result in reduced energy production, as leukemia cells typically demonstrate increased rates of FAO.8 However, future studies would need to directly examine M1 effects on FFAs.
Unlike normal hematopoietic stem cells, which rely on anaerobic glycolysis, AML cells primarily use mitochondrial oxidative phosphorylation for energy production. AML stem cells are highly sensitive to inhibition of mitochondrial protein synthesis33 and DNA replication.34 Targeting CI using NADH dehydrogenase inhibitors demonstrated selective toxicity against a subgroup of chemotherapy-resistant leukemia cells, exhibiting hyperactivity of oxidative phosphorylation and high expression of mitochondrial activity genes.35 Finally, suppression of oxidative phosphorylation induced by the BCl-2 inhibitor venetoclax selectively targets AML stem cells and results in durable remission in AML patients.36,37 As oxidative phosphorylation and mitochondrial function are imperative to the survival of leukemia cells, inhibition of the ETC presents as a promising target for AML; the selectivity of CI as a target also increases its therapeutic promise. Metformin, via the inhibition of CI and subsequently FAO, potentiate the effects of ABT-737, a molecule that inhibits BCl-2 and induces apoptosis. Additionally, metformin potentiated oligomerization of the pro-apoptotic protein Bak, a process that results in apoptosis in leukemia cells treated with ABT-737.32 Similarly, inhibition of FAO with etomoxir, a carnitine palmitoyl CoA transferase 1 inhibitor, sensitizes leukemia cells to apoptosis induced by ABT-737 through BCl-2 and Bak.8 Collectively, these results show that CI and oxidative phosphorylation are suitable targets in AML.
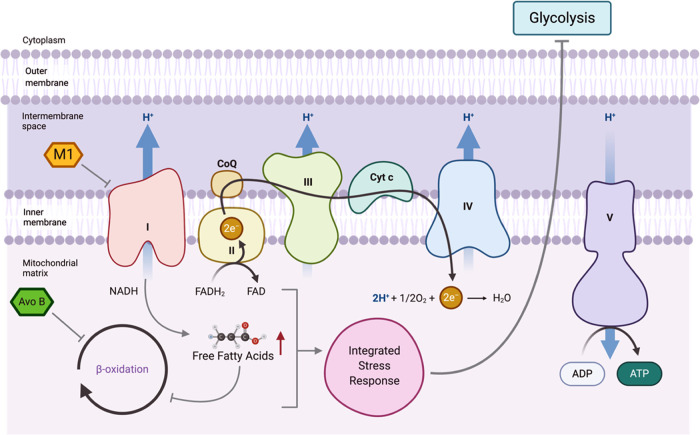
While the exact mechanism of FAO inhibition by Avo B (a 1:1 ratio of avocadyne and avocadene) is unclear, it does enter the mitochondria to inhibit FAO resulting in mitochondrial-mediated apoptosis.12 Moreover, avocadyne was shown to be the most active compound, which imparted selective toxicity through inhibition of very long chain acyl-CoA dehydrogenase, the first intra-mitochondrial enzyme in the FAO process.99 It is therefore likely that the individual compounds (M1 or AvoB) at the concentrations tested are insufficient to induce apoptosis alone; however, when provided in combination, the ability of M1 and Avo B to inhibit CI and FAO, respectively, could overcome the cell death threshold to impart toxicity (Figure 7). In this scenario and at the low concentrations used, Avo B-induced inhibition of FAO is mild and does not result in cell death. However, the added metabolic stress imparted by M1-induced CI inhibition is sufficient to cause cell death. While additional studies are required to confirm this mechanism, Avo B and other FAO inhibitors have shown a high propensity to synergize with chemotherapeutics.8,14 M1 did not positively interact with existing chemotherapy drugs and while the mechanism for this is unknown, it would limit M1’s incorporation into standard regimens. Therefore, studies, particularly those that look at pharmacokinetics, would be needed prior to any human study.
Figure 7.
Possible mechanisms by which M1 inhibition of complex I and Avo B inhibition of FAO result in toxicity (gray arrows). M1 inhibits complex I, which results in a decrease in electron transport and may increase free fatty acids, while Avo B inhibits FAO. The combined inhibition caused by M1 and Avo B may trigger lipotoxicity and/or a lethal integrated stress response.
Conclusions
AML is a devastating disease in need of novel therapies to improve patient outcomes. This article presents the promising combination of M1, a bioactive molecule extracted from mango ginger, and Avo B, an avocado-derived lipid, which selectively target leukemia cell lines at very low concentrations. M1 inhibits CI and synergizes with Avo B to inhibit FAO. The findings outlined in this article demonstrate a novel food-derived, anti-AML bioactive combination.
Materials and Methods
Cell Culture
Leukemia cells [OCI-AML2 (AML2), OCI-AML3 (AML3), Jurkat, KG1A, U937] were cultured in Iscove’s modified Dulbecco’s medium (IMDM; Wisent Bioproducts; St. Bruno, QC) or Roswell Park Memorial Institute (RPMI) medium (Cytiva; Logan, UT), supplemented with 10% fetal bovine serum (FBS; Sigma-Aldrich; St. Louis, MO) and 2% penicillin/streptomycin (Sigma-Aldrich). TEX and T30R leukemia cells were cultured in IMDM supplemented with 15% FBS, 2% penicillin/streptomycin, 2 mM l-glutamine (Cytiva), 20 ng/mL stem cell factor (Gibco; Grand Island, NY), and 2 ng/mL interleukin-3 (IL3; PeproTech; Rocky Hill, NJ).
INS-1 (832/13) cells were cultured in RPMI 1640 medium supplemented with 11.1 mM glucose, 10% FBS, 1% penicillin/streptomycin, 2 mM l-glutamine, 1 mM sodium pyruvate, and 50 μM β-mercaptoethanol. C2C12 myoblasts were cultured in Dulbecco’s modified Eagles medium (DMEM; Cytiva) supplemented with 10% FBS and 1% penicillin/streptomycin. Differentiation of C2C12 cells from myoblasts to myotubes required culture of 90% confluent myoblasts in differentiation medium composed of low-glucose (5 mM) DMEM supplemented with 2% horse-serum (Cytiva) and 1% penicillin/streptomycin. Differentiation medium was changed every day for 5 days, during which myoblasts were fully converted to myotubes as established by morphological assessment and analysis of the skeletal muscle protein, myogenin. All cell lines were grown in T25 or T75 vented filter cap tissue culture flasks (Sarstedt; Nümbrecht, Germany) and incubated in 5% CO2 at 37 °C.
Drugs
2,4,6-Trihydroxy-3,5-diprenyldihydrochalcone (M1) was purchased from ChemForce Laboratories Inc. (Edmonton, AB) and dissolved in dimethyl sulfoxide (DMSO). Doxorubicin (Sigma-Aldrich) and cytarabine (Cayman Chemicals; Ann Arbor, MI) were used in combination studies and dissolved in ddH2O. Avo B was extracted from Hass avocado seeds, as described by Kashman et al.(38) with modifications as described previously39 and described briefly in the Supporting Methods section. For all experiments, a maximum of 0.05% DMSO final concentration was used; this was also the concentration of the vehicle control.
Dose Response Curves
To generate dose response curves, OCI-AML2, OCI-AML3, KGIA, TEX, and U937 cells were seeded in triplicate on 96-well plates at a concentration of 1 × 10⁵ cells/mL in 95 μL of fresh media. To this, 5 μL of the respective drug was added to produce the desired final concentration. Concentrations tested were at logarithmic increments, typically 100, 10, 1, 0.1, and 0 μM, to determine the half maximal inhibitory concentration (IC50). The remaining wells of the plate were filled with 100 μL of phosphate-buffer saline (PBS) and placed in an incubator in 5% CO2 at 37 °C for 72 h. Cell viability was assessed using the MTS reduction assay and 7AAD staining.
Dose responses were also completed with two non-leukemia cell lines—INS-1 and C2C12 myotubes. These cells were seeded for 24 h to obtain 90% confluency using 1.2 × 10⁴ cells/well for INS-1 and 2 × 10⁴ cells/well for C2C12 in 12 well plates. Cells were then treated with 1–10 μM of M1 for 72 h. After treatment, cells were trypsinized using a 0.25% (w/v) trypsin + 0.53 mM EDTA solution (Gibco) and stained with 7AAD for viability measurements using flow cytometry.
Cell growth and viability were also measured using the MTS reduction assay (Promega; Madison, WI), as reported previously.40 The MTS assay is a colorimetric assay that assesses NAD(P)H-dependent cellular oxidoreductase enzyme activity, which in turn can proportionally reflect the number of viable cells present.41 After treatment and initial incubation, cells were treated with 20 μL of MTS and reincubated for 2 h at 37 °C and 5% CO2. Metabolically viable cells have enzymes that cleave MTS into a colored formazan product. After a 2 h incubation, the formazan product was quantified by measured absorbance at 490 nm using the Synergy HT spectrophotometer (BioTek; Winooski, VT).
Cell viability was also measured using 7-aminoactinomycin D (7-AAD; Cayman Chemicals) exclusion, as previously described.42 7-AAD is a fluorophore with a strong affinity for DNA that can distinguish between viable and dead cells, as live cells with intact cell membranes will exclude the fluorophore.43 7-AAD is excited using a 543 nm helium–neon laser; dead cells would be excited, while live cells would remain dark.44 Cells plated in triplicate on 96-well plates were centrifuged for 5 min at 1200 rpm, followed by discarding of the media. To each well, 200 μL of PBS and 1 μL of 7-AAD (1 mg/mL stock) were added, resulting in a final concentration of 5 μg/mL of 7-AAD. The plates were then incubated for 10 min at 37 °C. Plates were then analyzed using the Guava easyCyte 8HT flow cytometer (Millipore; Burlington, MA) using GuavaSoft 3.1. (Millipore) flow cytometry software, with settings to acquire 5000 events per well.
Colony Forming Assays
Colony forming assays were performed, as previously described.45 Cells were suspended in IMDM media containing 2% fetal calf serum (FCS; Cytiva) at a concentration of 1 × 10⁵ cells/mL. In a 15 mL tube, 300 μL of cell suspension was added to 3 mL of MethoCult GF H4434 medium (Stemcell Technologies; Vancouver, BC) containing 1% methylcellulose in IMDM, 30% FCS, 1% bovine serum albumin (BSA; Sigma-Aldrich), 3 U/mL recombinant human erythropoietin, 100 μM 2-mercaptoethanol, 2 mM l-glutamine, 50 ng/mL recombinant human stem cell factor, 10 ng/mL recombinant human granulocyte macrophage-colony stimulating factor, and 10 ng/mL recombinant human IL-3. The cells were plated in a 35 mm cell culture dish (Corning; Tewksbury, MA) at a concentration of 104 cells/dish using a 5 mL syringe with a blunt tip needle (Covidien; Minneapolis, MN). Replicate dishes of each treatment were stored in a 100 mm cell culture dish (Corning) with an additional uncapped 35 mm dish containing distilled water to control humidity. The plates were incubated for 7–14 days at 37 °C with 5% CO2 and 95% humidity. The colonies were counted on an inverted microscope; clusters of 10 or more cells were counted as one colony.
Drug Combinations
Combination Indexes
CI was used to evaluate the interaction between M1 and other known antileukemic drugs: Avo B, doxorubicin, and cytarabine. OCI-AML2, TEX, and U937 cells were seeded in triplicate on 96-well plates at a concentration of 1 × 10⁵ cells/mL and treated with M1, the drug of interest, and a combination of the two in equal IC50 molar ratios. Cell viability was measured with both the MTS reduction assay and 7-AAD exclusion, as detailed above. The CI values were calculated and generated by CompuSyn (ComboSyn, Inc.; Paramus, NJ) and were used to evaluate whether the M1 combinations were synergistic, antagonistic, or additive. CI values less than, equal to, or greater than 1 indicate synergy, additivity, or antagonism, respectively. Details of Chou-Talalay formulas used for the calculation are found in the Supporting Information.
Heat Map
To determine the ranges of synergistic concentrations, a heat map was created with increasing concentrations of Avo B and decreasing concentrations of M1, relative to the EC50. OCI-AML2, TEX, and U937 cells were seeded in triplicate on 96-well plates at a concentration of 1 × 10⁵ cells/mL in 95 μL of media. Concentrations of M1 used were between 0 and 40 μM, treated in columns, while concentrations of Avo B were between 0 and 32 μM. The remaining wells of the plate were filled with 100 μL of PBS and placed in an incubator in 5% CO2 at 37 °C for 72 h. Cell viability was measured with both the MTS reduction assay and 7-AAD exclusion, as detailed above.
Respirometry
High-resolution O2 consumption measurements were conducted on permeabilized OCI-AML2 and OCI-AML3 cells suspended in 2 mL of MiR05 (pH 7.5, stir speed 750 rpm) using the Oroboros Oxygraph-2k set to 37 °C with a gain of 2 in both chambers. Additional details are provided in the Supporting Methods section.
Fatty Acid Oxidation
FAO-supported respiration was measured using the following fuel substrate series: 16.65 μM l-palmitoyl carnitine (Sigma-Aldrich), 2 mM malate (Sigma-Aldrich), and 2.5 mM ADP (Sigma-Aldrich). Fuel substrates were injected into the chambers at 5 min intervals in 10 μL volumes using precision glass syringes (Hamilton Company; Reno, NV). Oxygen consumption was measured following the injection of ADP; basal oxygen consumption was background-subtracted from the measured rates. Following all measurements, respiration was completely inhibited using 250 nM antimycin A (Sigma-Aldrich). Data were recorded with DatLab software 7.4 (Oroboros Instruments).
Complex I + II
Complex I-supported respiration was measured using the fuel substrate series: 5 mM pyruvate (Sigma-Aldrich), 2 mM malate, and 2.5 mM ADP. Substrates were injected into the chambers at 5 min intervals in 10 μL volumes. Oxygen consumption was measured following the injection of ADP. After measurements, complex I-supported respiration was inhibited using 250 nM rotenone (Sigma-Aldrich).
Following inhibition with rotenone, complex II-supported respiration was measured after the injection of 10 mM succinate (Sigma-Aldrich) Respiration was completely inhibited using 250 nM antimycin A. Data were recorded with DatLab software 7.4.
Complex III
Assessment of complex III activity was completed spectrophotometrically, modified from the methods of Spinazzi et al.(46) To a 1 mL cuvette, 50 μL of 0.5 M potassium phosphate buffer (pH 7.5), 75 μL of 1 mM oxidized cytochrome c, 50 μL of 10 mM KCN, 20 μL of 5 mM EDTA, and 10 μL of 2.5% Tween 20 (all Sigma-Aldrich) were added; ddH2O was added to 985 μL. To this assay buffer, 20 μg of mitochondrial rich lysate was added. Next, 5 μL of the desired treatment (1 μM M1, 2 μM Avo B, 1 μM M1 + 2 μM Avo B, or DMSO) was added. The cuvette was then placed in a Genesys 10 spectrophotometer (Fisher Scientific) for a blank reading and absorbance was measured at 550 nM. After 1 min, 10 μL of 10 mM decylubiquinol (reduced decylubiquinone, Sigma-Aldrich) was added to the cuvette and absorbance measurements at 550 nM were taken for another 4 min. The assay was repeated in triplicate for each treatment.
Complex IV
Assessment of complex IV activity was completed spectrophotometrically, modified from the protocols of Spinazzi et al.(46) To a 1 mL cuvette, 250 μL of 0.1 M potassium phosphate buffer (pH 7.0) and 50 μL of 1 mM reduced cytochrome c were added; ddH2O was added to 995 μL. 5 μL of the desired treatment (1 μM M1, 2 μM Avo B, 1 μM M1 + 2 μM Avo B, or DMSO) was added. The cuvette was then placed in a Genesys 10 spectrophotometer for a blank reading and absorbance was measured at 550 nM. After 1 min, 20 μg of mitochondrial rich lysate was added to the cuvette and absorbance measurements were taken at 550 nM for another 4 min. The assay was repeated in triplicate for each treatment.
Complex V
Assessment of complex V activity was completed spectrophotometrically, modified from the protocols of Barrientos et al.(47) Assay media was prepared containing 50 mM Tris (pH 8.0), 5 mg/mL BSA, 20 mM MgCl2, 50 mM KCl, 15 μM carbonyl cyanide m-chlorophenylhydrazone, 5 μM antimycin A, 10 mM phosphoenolpyruvate, 2.5 mM ATP, 4 units of lactate dehydrogenase and pyruvate kinase, and 1 mM NADH (unless previously mentioned, all Sigma-Aldrich). The media was then incubated at 37 °C for 5 min prior to the start of the assay. In a 96-well plate, 20 μg of mitochondria-rich lysate in distilled water was added to each sample well. The plate was incubated in a Synergy H4 microplate plater (BioTek) at 37 °C for 30 s. To each well, 200 μL of the assay media was added and absorbance was measured at 340 nm for 3 min. After 3 min, the treatments (1 μM M1, 2 μM Avo B, 1 μM M1 + 2 μM Avo B, or DMSO) are added in triplicate, and the absorbance is read for another 3 min at 340 nm.
Statistical Analysis
Data were analyzed with GraphPad Prism 7.0 (GraphPad Software; San Diego, CA) using one-way ANOVA with Tukey’s or Dunnett’s post hoc analysis for between group comparisons where applicable. Student’s t-tests were also employed where applicable. p < 0.05 was accepted as being statistically significant. Data presented are mean ± standard deviation (SD); *p < 0.05, **p < 0.01, ***p < 0.005, ****p < 0.001. Drug combination data were analyzed using CalcuSyn software (Biosoft, Cambridge, UK).
Acknowledgments
We thank Drs. Preethi Jayanth and Medhat Ibrahim for assistance with experiments. We also thank Drs. Gopi Paliyath and Jayasankar Subramanian for their insight regarding C. amada.
Supporting Information Available
The Supporting Information is available free of charge at https://pubs.acs.org/doi/10.1021/acsomega.1c04053.
Avocatin B extraction, CI calculations, and respirometry (PDF)
Author Contributions
V.J. and P.A.S. developed and performed experiments, analyzed the data, and wrote the manuscript. A.R. conducted all colony-forming cell assays. N.A., P.J., and M.T. assisted with in vitro experiments. N.V. assisted with experiments and manuscript formatting. M.D.M. provided materials.
The authors declare the following competing financial interest(s): P.A.S. serves on the scientific advisory board for the Hass avocado board.
Supplementary Material
References
- Döhner H.; Weisdorf D. J.; Bloomfield C. D. Acute Myeloid Leukemia. N. Engl. J. Med. 2015, 373, 1136–1152. 10.1056/NEJMra1406184. [DOI] [PubMed] [Google Scholar]
- Döhner H.; Estey E. H.; Amadori S.; Appelbaum F. R.; Büchner T.; Burnett A. K.; Dombret H.; Fenaux P.; Grimwade D.; Larson R. A.; et al. Diagnosis and Management of Acute Myeloid Leukemia in Adults: Recommendations from an International Expert Panel, on Behalf of the European LeukemiaNet. Blood 2010, 115, 453–474. 10.1182/blood-2009-07-235358. [DOI] [PubMed] [Google Scholar]
- Niederhuber J. E.; Armitage J. O.; Doroshow J. H.; Kastan M. B.; Tepper J. E.. Abeloff’s Clinical Oncology, 6th ed.; Elsevier: Amsterdam, 2020. [Google Scholar]
- DeVita V. T.; Rosenberg S. A.; Lawrence T. S.. DeVita, Hellman, and Rosenberg’s Cancer: Principles and Practice of Oncology; Lippincott Williams & Wilkins, 2018. [Google Scholar]
- Bishop J. F. The Treatment of Adult Acute Myeloid Leukemia. Semin. Oncol. 1997, 24, 57–69. [PubMed] [Google Scholar]
- Jang M.; Kim S. S.; Lee J. Cancer Cell Metabolism: Implications for Therapeutic Targets. Exp. Mol. Med. 2013, 45, e45 10.1038/emm.2013.85. [DOI] [PMC free article] [PubMed] [Google Scholar]
- Warburg O. On the Origin of Cancer Cells. Science 1956, 123, 309–314. 10.1126/science.123.3191.309. [DOI] [PubMed] [Google Scholar]
- Samudio I.; Harmancey R.; Fiegl M.; Kantarjian H.; Konopleva M.; Korchin B.; Kaluarachchi K.; Bornmann W.; Duvvuri S.; Taegtmeyer H.; et al. Pharmacologic Inhibition of Fatty Acid Oxidation Sensitizes Human Leukemia Cells to Apoptosis Induction. J. Clin. Invest. 2010, 120, 142–156. 10.1172/JCI38942. [DOI] [PMC free article] [PubMed] [Google Scholar]
- Samudio I.; Fiegl M.; McQueen T.; Clise-Dwyer K.; Andreeff M. The Warburg Effect in Leukemia-Stroma Cocultures Is Mediated by Mitochondrial Uncoupling Associated with Uncoupling Protein 2 Activation. Cancer Res. 2008, 68, 5198–5205. 10.1158/0008-5472.CAN-08-0555. [DOI] [PMC free article] [PubMed] [Google Scholar]
- Samudio I.; Konopleva M. Targeting Leukemia’s Fatty Tooth. Blood 2015, 126, 1874–1875. 10.1182/blood-2015-08-665125. [DOI] [PubMed] [Google Scholar]
- Carracedo A.; Cantley L. C.; Pandolfi P. P. Cancer Metabolism: Fatty Acid Oxidation in the Limelight. Nat. Rev. Cancer 2013, 13, 227–232. 10.1038/nrc3483. [DOI] [PMC free article] [PubMed] [Google Scholar]
- Lee E. A.; Angka L.; Rota S.-G.; Hanlon T.; Mitchell A.; Hurren R.; Wang X. M.; Gronda M.; Boyaci E.; Bojko B.; et al. Targeting Mitochondria with Avocatin B Induces Selective Leukemia Cell Death. Cancer Res. 2015, 75, 2478–2488. 10.1158/0008-5472.CAN-14-2676. [DOI] [PubMed] [Google Scholar]
- Yasir M.; Das S.; Kharya M. The Phytochemical and Pharmacological Profile of Persea Americana Mill. Pharmacogn. Rev. 2010, 4, 77–84. 10.4103/0973-7847.65332. [DOI] [PMC free article] [PubMed] [Google Scholar]
- Tcheng M.; Samudio I.; Lee E. A.; Minden M. D.; Spagnuolo P. A. The Mitochondria Target Drug Avocatin B Synergizes with Induction Chemotherapeutics to Induce Leukemia Cell Death. Leuk. Lymphoma 2017, 58, 986–988. 10.1080/10428194.2016.1218005. [DOI] [PubMed] [Google Scholar]
- Tabe Y.; Saitoh K.; Yang H.; Sekihara K.; Yamatani K.; Ruvolo V.; Taka H.; Kaga N.; Kikkawa M.; Arai H.; et al. Inhibition of FAO in AML Co-Cultured with BM Adipocytes: Mechanisms of Survival and Chemosensitization to Cytarabine. Sci. Rep. 2018, 8, 16837. 10.1038/S41598-018-35198-6. [DOI] [PMC free article] [PubMed] [Google Scholar]
- Schrauwen P.; Hoeks J.; Schaart G.; Kornips E.; Binas B.; Vusse G. J.; Bilsen M.; Luiken J. J. F. P.; Coort S. L. M.; Glatz J. F. C.; et al. Uncoupling Protein 3 as a Mitochondrial Fatty Acid Anion Exporter. FASEB J. 2003, 17, 2272–2274. 10.1096/fj.03-0515fje. [DOI] [PubMed] [Google Scholar]
- Ahmed N.; Tcheng M.; Roma A.; Buraczynski M.; Jayanth P.; Rea K.; Akhtar T. A.; Spagnuolo P. A. Avocatin B Protects Against Lipotoxicity and Improves Insulin Sensitivity in Diet-Induced Obesity. Mol. Nutr. Food Res. 2019, 63, 1900688. 10.1002/mnfr.201900688. [DOI] [PubMed] [Google Scholar]
- Mujumdar A. M. M.; Naik D. G. G.; Dandge C. N. N.; Puntambekar H. M. M. Antiinflammatory Activity of Curcuma Amada Roxb . in Albino Rats. J. Pharm. Pharmacol. 2000, 32, 375–377. [Google Scholar]
- Chirangini P.; Sharma G. J.; Sinha S. K. Sulfur Free Radical Reactivity with Curcumin as Reference for Evaluating Antioxidant Properties of Medicinal Zingiberales. J. Environ. Pathol., Toxicol. Oncol. 2004, 23, 227–236. 10.1615/JEnvPathToxOncol.v23.i3.60. [DOI] [PubMed] [Google Scholar]
- Kumar T. M.; Raaman N.; Balasubramanian K. Anticancer and Antioxidant Activity of Curcuma Zedoaria and Curcuma Amada Rhizome Extracts. J. Acad. Ind. Res. 2012, 1, 91–96. [Google Scholar]
- Policegoudra R. S.; Rehna K.; Jaganmohan Rao L.; Aradhya S. M. Antimicrobial, Antioxidant, Cytotoxicity and Platelet Aggregation Inhibitory Activity of a Novel Molecule Isolated and Characterized from Mango Ginger (Curcuma Amada Roxb.) Rhizome. J. Biosci. 2010, 35, 231–240. 10.1007/s12038-010-0027-1. [DOI] [PubMed] [Google Scholar]
- Aguado J. M.; San-Juan R.; Lalueza A.; Sanz F.; Rodríguez-Otero J.; Gómez-Gonzalez C.; Chaves F. High Vancomycin MIC and Complicated Methicillin-Susceptible Staphylococcus Aureus Bacteremia. Emerging Infect. Dis. 2011, 17, 1099–1102. 10.3201/eid1706.101037. [DOI] [PMC free article] [PubMed] [Google Scholar]
- Chou T.-C. Preclinical versus Clinical Drug Combination Studies. Leuk. Lymphoma 2008, 49, 2059–2080. 10.1080/10428190802353591. [DOI] [PubMed] [Google Scholar]
- Li W.; Koike K.; Asada Y.; Hirotani M.; Rui H.; Yoshikawa T.; Nikaido T. Flavonoids from Glycyrrhiza Pallidiflora Hairy Root Cultures. Phytochemistry 2002, 60, 351–355. 10.1016/S0031-9422(02)00093-6. [DOI] [PubMed] [Google Scholar]
- Kobori M.; Iwashita K.; Shinmoto H.; Tsushida T. Phloretin-Induced Apoptosis in B16 Melanoma 4A5 Cells and HL60 Human Leukemia Cells. Biosci., Biotechnol., Biochem. 1999, 63, 719–725. 10.1271/bbb.63.719. [DOI] [PubMed] [Google Scholar]
- Nakatani N.; Ichimaru M.; Moriyasu M.; Kato A. Induction of Apoptosis in Human Promyelocytic Leukemia Cell Line HL-60 by C-Benzylated Dihydrochalcones, Uvaretin, Isouvaretin and Diuvaretin. Biol. Pharm. Bull. 2005, 28, 83–86. 10.1248/bpb.28.83. [DOI] [PubMed] [Google Scholar]
- Nchiozem-Ngnitedem V.-A.; Omosa L. K.; Derese S.; Tane P.; Heydenreich M.; Spiteller M.; Seo E.-J.; Efferth T. Two New Flavonoids from Dracaena Usambarensis Engl. Phytochem. Lett. 2020, 36, 80–85. 10.1016/j.phytol.2020.01.001. [DOI] [Google Scholar]
- Oka S.; Kuniba R.; Tsuboi N.; Tsuchida S.; Ushida K.; Tomoshige S.; Kuramochi K. Isolation, Synthesis, and Biological Activities of a Bibenzyl from Empetrum Nigrum Var. Japonicum. Biosci., Biotechnol., Biochem. 2020, 84, 31–36. 10.1080/09168451.2019.1662279. [DOI] [PubMed] [Google Scholar]
- Vial G.; Detaille D.; Guigas B. Role of Mitochondria in the Mechanism(s) of Action of Metformin. Front. Endocrinol. 2019, 10, 294. 10.3389/fendo.2019.00294. [DOI] [PMC free article] [PubMed] [Google Scholar]
- Fontaine E. Metformin-Induced Mitochondrial Complex I Inhibition: Facts, Uncertainties, and Consequences. Front. Endocrinol. 2018, 9, 753. 10.3389/fendo.2018.00753. [DOI] [PMC free article] [PubMed] [Google Scholar]
- Velez J.; Pan R.; Lee J. T. C.; Enciso L.; Suarez M.; Duque J. E.; Jaramillo D.; Lopez C.; Morales L.; Bornmann W.; Konopleva M.; Krystal G.; Andreeff M.; Samudio I. Biguanides Sensitize Leukemia Cells to ABT-737-Induced Apoptosis by Inhibiting Mitochondrial Electron Transport. Oncotarget 2016, 7, 51435–51449. 10.18632/oncotarget.9843. [DOI] [PMC free article] [PubMed] [Google Scholar]
- Škrtić M.; Sriskanthadevan S.; Jhas B.; Gebbia M.; Wang X.; Wang Z.; Hurren R.; Jitkova Y.; Gronda M.; Maclean N.; et al. Inhibition of Mitochondrial Translation as a Therapeutic Strategy for Human Acute Myeloid Leukemia. Cancer Cell 2011, 20, 674–688. 10.1016/j.ccr.2011.10.015. [DOI] [PMC free article] [PubMed] [Google Scholar]
- Bralha F. N.; Liyanage S. U.; Hurren R.; Wang X.; Son M. H.; Fung T. A.; Chingcuanco F. B.; Tung A. Y. W.; Andreazza A. C.; Psarianos P.; et al. Targeting Mitochondrial RNA Polymerase in Acute Myeloid Leukemia. Oncotarget 2015, 6, 37216–37228. 10.18632/oncotarget.6129. [DOI] [PMC free article] [PubMed] [Google Scholar]
- Molina J. R.; Sun Y.; Protopopova M.; Gera S.; Bandi M.; Bristow C.; McAfoos T.; Morlacchi P.; Ackroyd J.; Agip A.-N. A.; et al. An Inhibitor of Oxidative Phosphorylation Exploits Cancer Vulnerability. Nat. Med. 2018, 24, 1036–1046. 10.1038/s41591-018-0052-4. [DOI] [PubMed] [Google Scholar]
- Pollyea D. A.; Stevens B. M.; Jones C. L.; Winters A.; Pei S.; Minhajuddin M.; D’Alessandro A.; Culp-Hill R.; Riemondy K. A.; Gillen A. E.; et al. Venetoclax with Azacitidine Disrupts Energy Metabolism and Targets Leukemia Stem Cells in Patients with Acute Myeloid Leukemia. Nat. Med. 2018, 24, 1859–1866. 10.1038/s41591-018-0233-1. [DOI] [PMC free article] [PubMed] [Google Scholar]
- Jones C. L.; Stevens B. M.; D’Alessandro A.; Reisz J. A.; Culp-Hill R.; Nemkov T.; Pei S.; Khan N.; Adane B.; Ye H.; et al. Inhibition of Amino Acid Metabolism Selectively Targets Human Leukemia Stem Cells. Cancer Cell 2018, 34, 724–740. 10.1016/j.ccell.2018.10.005. [DOI] [PMC free article] [PubMed] [Google Scholar]
- Tcheng M.; Roma A.; Ahmed N.; Smith R. W.; Jayanth P.; Minden M. D.; Schimmer A. D.; Hess D. A.; Hope K.; Rea K. A.; Akhtar T. A.; Bohrnsen E.; D'Alessandro A.; Mohsen A.-W.; Vockley J. Very long chain fatty acid metabolism is required in acute myeloid leukemia. Blood 2021, 137, 3518–3532. 10.1182/blood.2020008551. [DOI] [PMC free article] [PubMed] [Google Scholar]
- Kashman Y.; Néeman I.; Lifshitz A. New Compounds from Avocado Pear. Tetrahedron 1969, 25, 4617–4631. 10.1016/S0040-4020(01)83005-2. [DOI] [Google Scholar]
- Ahmed N.; Kermanshahi B.; Ghazani S. M.; Tait K.; Tcheng M.; Roma A.; Callender S. P.; Smith R. W.; Tam W.; Wettig S. D.; et al. Avocado-Derived Polyols for Use as Novel Co-Surfactants in Low Energy Self-Emulsifying Microemulsions. Sci. Rep. 2020, 10, 5566. 10.1038/s41598-020-62334-y. [DOI] [PMC free article] [PubMed] [Google Scholar]
- Tcheng M.; Samudio I.; Lee E. A.; Minden M. D.; Spagnuolo P. A. The Mitochondria Target Drug Avocatin B Synergizes with Induction Chemotherapeutics to Induce Leukemia Cell Death. Leuk. Lymphoma 2017, 58, 986–988. 10.1080/10428194.2016.1218005. [DOI] [PubMed] [Google Scholar]
- Riss T. L.; Moravec R. A.; Niles A. L.; Duellman S.; Benink H. A.; Worzella T. J.; Minor L.. Cell Viability Assays. Assay Guidance Manual; Eli Lilly & Company and the National Center for Advancing Translational Sciences, 2004. [PubMed] [Google Scholar]
- Roma A.; Rota S. G.; Spagnuolo P. A. Diosmetin Induces Apoptosis of Acute Myeloid Leukemia Cells. Mol. Pharm. 2018, 15, 1353–1360. 10.1021/acs.molpharmaceut.7b01151. [DOI] [PubMed] [Google Scholar]
- Zembruski N. C. L.; Stache V.; Haefeli W. E.; Weiss J. 7-Aminoactinomycin D for Apoptosis Staining in Flow Cytometry. Anal. Biochem. 2012, 429, 79–81. 10.1016/j.ab.2012.07.005. [DOI] [PubMed] [Google Scholar]
- Pallis M.; Syan J.; Russell N. H. Flow Cytometric Chemosensitivity Analysis of Blasts from Patients with Acute Myeloblastic Leukemia and Myelodysplastic Syndromes: The Use of 7AAD with Antibodies to CD45 or CD34. Cytometry 1999, 37, 308–313. . [DOI] [PubMed] [Google Scholar]
- Spagnuolo P. A.; Hurren R.; Gronda M.; Maclean N.; Datti A.; Basheer A.; Lin F.-H.; Wang X.; Wrana J.; Schimmer A. D. Inhibition of Intracellular Dipeptidyl Peptidases 8 and 9 Enhances Parthenolide’s Anti-Leukemic Activity. Leukemia 2013, 27, 1236–1244. 10.1038/leu.2013.9. [DOI] [PubMed] [Google Scholar]
- Spinazzi M.; Casarin A.; Pertegato V.; Salviati L.; Angelini C. Assessment of Mitochondrial Respiratory Chain Enzymatic Activities on Tissues and Cultured Cells. Nat. Protoc. 2012, 7, 1235–1246. 10.1038/nprot.2012.058. [DOI] [PubMed] [Google Scholar]
- Barrientos A. In Vivo and in Organello Assessment of OXPHOS Activities. Methods 2002, 26, 307–316. 10.1016/S1046-2023(02)00036-1. [DOI] [PubMed] [Google Scholar]
Associated Data
This section collects any data citations, data availability statements, or supplementary materials included in this article.


